All Activity
- Past hour
-
The next key warm stat at JFK is the Dec, 7: 75 (1998) record high.
-
Honestly, why even bother trying to fact check what that asshole says?
-

Spooky Season (October Disco Thread)
Damage In Tolland replied to Prismshine Productions's topic in New England
Stay warm n safe -
Spooky Season (October Disco Thread)
Damage In Tolland replied to Prismshine Productions's topic in New England
It’s a fast west east zonal flow on ensembles. Doesn’t appear to be much troughiness at least thru last week of music nth -
Looks like warmth in the first week of November is becoming more common.
-
The weather pattern has turned into a miracle since the spattering of midday clouds yesterday.
-
what has a real connection to our cold and snowy winters is warmth in Alaska. If Alaska is warm it usually means our winter is going well.
-

2025-2026 ENSO
donsutherland1 replied to 40/70 Benchmark's topic in Weather Forecasting and Discussion
Once the winter mean temperature reaches 34.0° or above, the frequency of 50" or above snow seasons largely but not completely disappears. Washington, DC's 35.8° (2009-10) is the single case above 35.0° among all of the listed locations. For Central Park and also additional locations: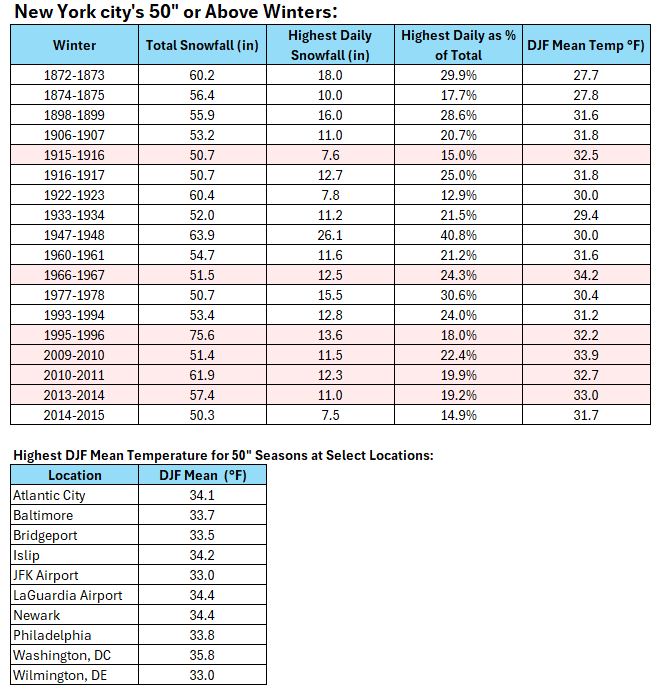
-
so we still have a shot sooner or later?
-

Spooky Season (October Disco Thread)
tamarack replied to Prismshine Productions's topic in New England
Late last evening the temp was 5° lower than same time day before, but this morning's low of 31 was 2° higher than yesterday morning. Warmer aloft - 8 AM at MWN: 46° (and TD -8!) -
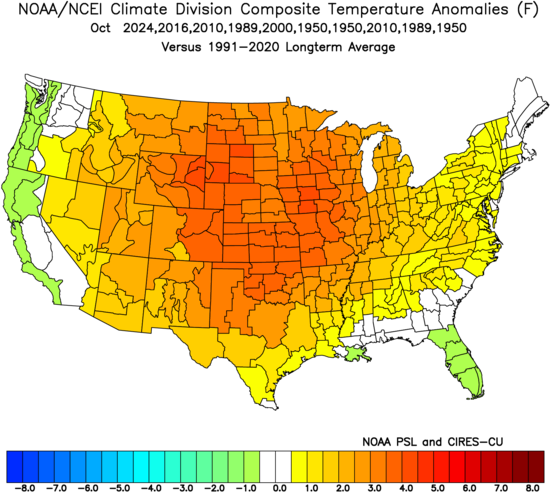
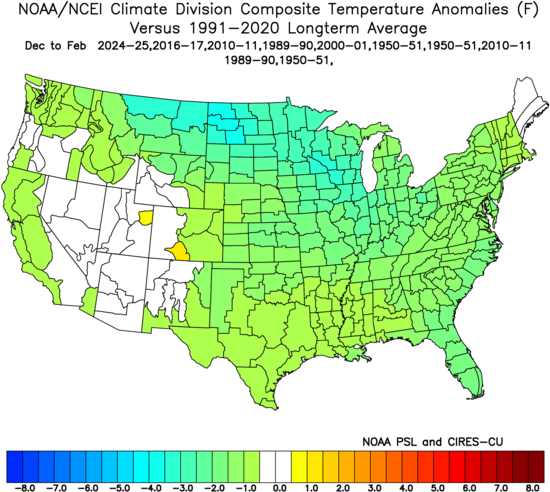
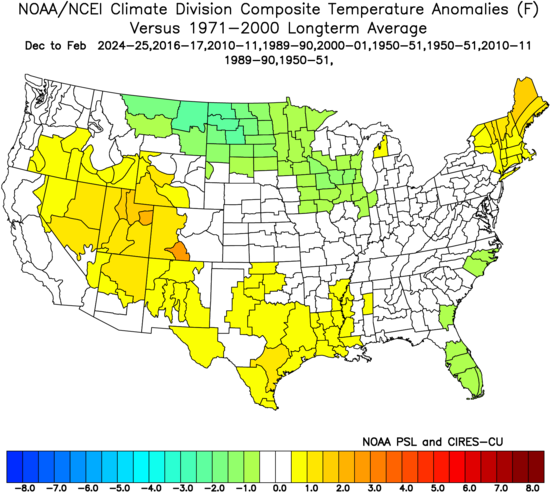
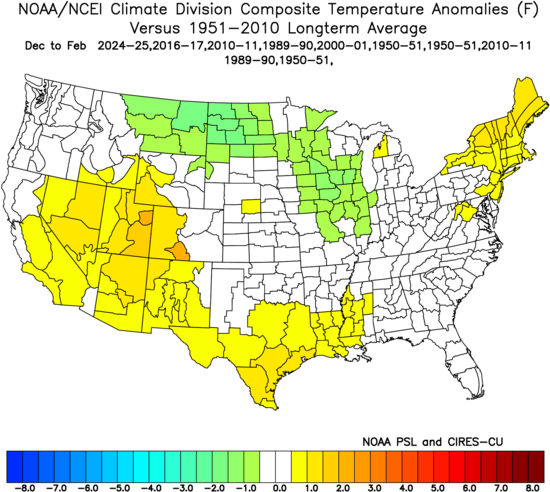
Fwiw today from JB: Warm October, Warm Winter. Yes and No I received an email last night saying alot of people on X are starting to hammer our winter idea because of the warm October. And they have good reason too, because warm Octobers centered in the Northeast tend to be warm winters. Some of the worst winters I can remember are those warm, dry Octobers However there is a problem when we look at the analogs. When warm Octobers are centered in the heartland and the back part of the hurricane season ( more than 50% of ace after Sept 15) we get a very different story. What I did here with this analog is pick out the warmest Octobers since 1950 and double weighted the late season ACE ones: So what do the winters look like? Here’s my main problem with his maps. He’s using 1991-2020 for climo, which makes his winter analog composite look significantly colder than if earlier climo were used. Keep in mind that half of his years are 1989 and earlier. What’s the most appropriate climo to use from that site? There’s no easy answer but something earlier than 1991-2020 would obviously be more appropriate. Octobers are still warm no matter what climo is chosen (different degrees of warmth depending on climo that’s chosen). If I use 1951-2010, I get this: That actually shows very slightly mild or essentially NN. But perhaps that’s too far back although he does have 3 of his 10 weights as 1950-1. What about if I use 1971-2000? It’s also very slightly mild/NN in the NE US: The point is that he used too warm climo, which made his winter analog average too cold.
-
yeah January 2021 certainly did and was aided by the extreme blocking across Greenland.
-
2022 was the latest 80° and 2024 was the latest 82°. First/Last Summary for JFK INTERNATIONAL AIRPORT, NY Each section contains date and year of occurrence, value on that date. Click column heading to sort ascending, click again to sort descending. 2022 05-21 (2022) 87 11-07 (2022) 80 169 2024 04-29 (2024) 82 11-01 (2024) 82 185 1950 05-07 (1950) 81 11-01 (1950) 80 177 1971 05-11 (1971) 80 10-29 (1971) 80 170 2023 04-12 (2023) 84 10-28 (2023) 81 198 1963 04-18 (1963) 82 10-21 (1963) 81 185 1949 05-05 (1949) 83 10-21 (1949) 80 168 1969 04-26 (1969) 80 10-20 (1969) 81 176 2016 05-25 (2016) 87 10-19 (2016) 86 146 1975 05-20 (1975) 81 10-15 (1975) 82 147 2021 03-26 (2021) 81 10-14 (2021) 80 201 1990 03-13 (1990) 85 10-14 (1990) 82 214 1962 04-22 (1962) 81 10-12 (1962) 81 172
-
Glad we finally put the Siberian snow cover myth to bed.
- Today
-

2025-2026 ENSO
40/70 Benchmark replied to 40/70 Benchmark's topic in Weather Forecasting and Discussion
This is true, although the late 80s and early 90s were petty comparable in terms of snowfall....obviously not temps. No debate there. -
Welp almost winter so time to check back into the place and see if it is still here. Yup looks like the sh*tshow continues. Haha
-
It’s more like a regression to the mean for what used to be average in past decades for locations to our south. So Boston has seen a reversion last 7 seasons for what was the old average closer to NYC. Then NYC has had a 7 year average closer to what used to be the old norm from DC to Philly.
-
2025-2026 ENSO
40/70 Benchmark replied to 40/70 Benchmark's topic in Weather Forecasting and Discussion
I understand your argument...I just don't fully agree with it. I think part of this unfavorable storm track is regression to the mean after getting high off of a decade that dealt 40" winters out like crack. And I am convinced that even if NYC gets 50" in another winter, you won't change your mind. It will be "they are done now in this new and even warmer, climate"....keep kicking the can. -
Chris when was JFK's latest 80+ temperature, was it last year or in 2022 or in 1950?
-
wow so both the 95 in October 2019 and the 82 last November are monthly records, Chris? And were the 96 at EWR and 95 at LGA also monthly records in October 2019?
-
2020-2021 didn't have below average heights per se, but there were certainly some lower heights and colder air knifing into the country.
-
From NWS just now, exerpt, Brattleboro: Tuesday Night Showers likely, mainly after 2am. Mostly cloudy, with a low around 57. Chance of precipitation is 70%. Wednesday Showers likely. Mostly cloudy, with a high near 68. Chance of precipitation is 60%. Wednesday Night A chance of showers. Partly cloudy, with a low around 40. Chance of precipitation is 30%. Discussion: While the dry and unseasonably warm trend continues into Monday, our attention then turns to a shortwave trough and associated sfc cold front progressing form southern Canada into the Northeast. Guidance has trended earlier with the start time of the rain ahead of the sfc boundary with most ensembles now suggesting rain spreads into areas north and west of Albany Tuesday evening before rain advances further east overnight. There remains uncertainty regarding the intensity of the shortwave trough tracking through Canada which will provide the necessary forcing for ascent to enhance the precipitation shield along the incoming boundary. Ensemble clusters suggest two types of scenarios. If the trough become neutrally to even slightly negatively tilted by Tuesday night, the CVA ahead of it should be strong enough to support a widespread soaking rain with 24-hr rainfall probabilities through 00 UTC Wed for near or above 0.50" ranging 50-70%. On the other hand, should the trough be weaker, limited CVA along the boundary will keep rainfall amounts lower with 24-hr rainfall probabilities for at or greater than 0.50" near or under 30%.
-
NYC needs two things in order to have a 50” snowfall season. One is an average winter temperature close to 32°or colder. The other is a cold storm track out near the benchmark. NYC has been nowhere near achieving this combination since the winters shifted so much warmer since 2015-2016. First, the winters shifted warmer in 2015-2016 which was followed by a storm track warming since 2018-2019. NYC highest snowfall total over the last decade has only been 40.9”. The coldest winter average temperature has been 34.8°.
-
Yeah...we did get a great pattern late February and March and established prime troughing for us
-

Occasional Thoughts on Climate Change
Typhoon Tip replied to donsutherland1's topic in Climate Change
It's a drug addiction metaphor. It feels really good ( immediate dividends on growing season...) until it is no longer sustained, and then it's is horror story journey to either a demise, or a helluva lot of hardship to recover.