All Activity
- Past hour
-

July 2025 Discussion-OBS - seasonable summer variability
LibertyBell replied to wdrag's topic in New York City Metro
wow two separate 99 degree heatwaves in July and August? thats like all the pain without the reward of a triple digit high at least 1983 (which was a hotter summer) hit 100 both in July and August at JFK and 99 at Central Park in September -

July 2025 Discussion-OBS - seasonable summer variability
Brian5671 replied to wdrag's topic in New York City Metro
that would be crazy a midnight high of 90.... -
A day later and the purple is back.
-
July 2025 Discussion-OBS - seasonable summer variability
LibertyBell replied to wdrag's topic in New York City Metro
1993 and 2010 way ahead of everyone else, just as I remember them :-) -

July 2025 Obs/Disco ... possible historic month for heat
Sey-Mour Snow replied to Typhoon Tip's topic in New England
Weatherbell that was 00z.. 6z just got released since I posted that which is much less with that in mind it flops like that NAM and hrrr so take with a grain of salt -

July 2025 Discussion-OBS - seasonable summer variability
SACRUS replied to wdrag's topic in New York City Metro
All about timing with the boundary and clouds. There may be some popup storms this afternoon/evening and also the opportunity for a city overnight 90 degree readings. -

July 2025 Discussion-OBS - seasonable summer variability
Jersey Andrew replied to wdrag's topic in New York City Metro
Do we have any idea about the dew points and humidity back then? I was 10 years old living in DC area in 1988 and remember a hot summer but nothing like the uncomfortable humidities today. -
July 2025 Discussion-OBS - seasonable summer variability
Brian5671 replied to wdrag's topic in New York City Metro
90+ from Philly to central NJ-NYC is mid 80's on most models tomorrow -

July 2025 Obs/Disco ... possible historic month for heat
CoastalWx replied to Typhoon Tip's topic in New England
6z euro is more impressive though. -

July 2025 Obs/Disco ... possible historic month for heat
CT Rain replied to Typhoon Tip's topic in New England
Where do you see that? The 6z RRFS looks like 1-3" for Fairfield County up through Oxford. -
July 2025 Discussion-OBS - seasonable summer variability
SACRUS replied to wdrag's topic in New York City Metro
NYC 1988 / east of NJ not as much strong heat buy still a top 5 or so summer overall une 1988 New York City Weather Day High (°F) Low (°F) Precip. (inches) Snow (inches) June 1 90 58 0.40 0.0 June 2 63 51 0.00 0.0 June 3 66 50 0.14 0.0 June 4 67 50 0.15 0.0 June 5 82 54 0.00 0.0 June 6 81 65 0.00 0.0 June 7 77 62 0.00 0.0 June 8 75 59 0.00 0.0 June 9 65 52 0.10 0.0 June 10 71 50 0.00 0.0 June 11 78 52 0.00 0.0 June 12 90 61 0.00 0.0 June 13 93 69 0.00 0.0 June 14 96 71 0.00 0.0 June 15 96 74 0.00 0.0 June 16 92 69 0.09 0.0 June 17 74 65 0.05 0.0 June 18 85 65 0.00 0.0 June 19 86 66 0.00 0.0 June 20 87 68 0.00 0.0 June 21 97 76 0.00 0.0 June 22 98 75 0.00 0.0 June 23 87 65 0.00 0.0 June 24 81 61 0.00 0.0 June 25 76 61 0.00 0.0 June 26 82 63 0.34 0.0 June 27 83 58 0.00 0.0 June 28 86 61 0.00 0.0 June 29 80 60 0.02 0.0 June 30 78 55 0.00 0.0 July 1988 New York City Weather Day High (°F) Low (°F) Precip. (inches) Snow (inches) July 1 71 53 0.00 0.0 July 2 80 58 0.00 0.0 July 3 88 61 0.00 0.0 July 4 88 65 0.00 0.0 July 5 88 66 0.00 0.0 July 6 92 68 0.00 0.0 July 7 93 68 0.00 0.0 July 8 97 73 0.00 0.0 July 9 88 71 0.23 0.0 July 10 99 72 0.09 0.0 July 11 98 79 0.00 0.0 July 12 84 72 0.37 0.0 July 13 90 73 0.00 0.0 July 14 90 69 0.00 0.0 July 15 93 72 0.14 0.0 July 16 96 72 0.42 0.0 July 17 94 71 1.21 0.0 July 18 96 71 0.00 0.0 July 19 89 75 0.94 0.0 July 20 83 73 1.28 0.0 July 21 89 72 1.71 0.0 July 22 78 70 0.04 0.0 July 23 83 69 0.27 0.0 July 24 84 71 0.40 0.0 July 25 89 68 0.00 0.0 July 26 87 68 0.65 0.0 July 27 85 69 0.05 0.0 July 28 85 69 0.33 0.0 July 29 92 72 0.00 0.0 July 30 98 79 0.00 0.0 July 31 87 75 0.01 0.0 August 1988 New York City Weather Day High (°F) Low (°F) Precip. (inches) Snow (inches) August 1 91 73 0.00 0.0 August 2 91 75 0.00 0.0 August 3 89 76 0.00 0.0 August 4 89 76 0.00 0.0 August 5 89 76 0.00 0.0 August 6 89 75 0.00 0.0 August 7 91 77 0.00 0.0 August 8 88 72 0.00 0.0 August 9 93 73 0.00 0.0 August 10 93 76 0.00 0.0 August 11 95 77 0.00 0.0 August 12 94 80 0.00 0.0 August 13 96 79 0.00 0.0 August 14 99 80 0.00 0.0 August 15 97 81 0.00 0.0 August 16 86 74 0.00 0.0 August 17 89 74 0.14 0.0 August 18 82 70 0.00 0.0 August 19 82 63 0.00 0.0 August 20 77 62 0.00 0.0 August 21 88 62 0.00 0.0 August 22 80 56 0.00 0.0 August 23 75 61 0.06 0.0 August 24 75 62 1.60 0.0 August 25 83 62 0.05 0.0 August 26 88 68 0.09 0.0 August 27 84 67 0.00 0.0 August 28 88 71 0.00 0.0 August 29 78 67 0.25 0.0 August 30 77 63 0.00 0.0 August 31 82 59 0.00 0.0 -

July 2025 Obs/Disco ... possible historic month for heat
40/70 Benchmark replied to Typhoon Tip's topic in New England
I look foreward to Friday...so, so much. -
July 2025 Obs/Disco ... possible historic month for heat
CoastalWx replied to Typhoon Tip's topic in New England
HRRR sort of meh for the rain. Narrow area may get dumped, but doesn't seem overly impressive. Srfc front needs to be further north. -
July 2025 Discussion-OBS - seasonable summer variability
SACRUS replied to wdrag's topic in New York City Metro
EWR joins 1966 and others for most 95F or higher season leaders with a long way to go for the top 3. We'll see mid august - early sep has a few to run up the number. Year Rank Days >= 95 °F 1993 1 25 2010 2 21 2022 3 20 1988 3 20 1944 3 20 2021 4 18 2012 5 17 2011 5 17 2002 5 17 1955 5 17 1949 6 16 2005 7 14 1953 7 14 2016 8 13 1999 8 13 1991 8 13 1987 8 13 1994 ,9 12 1983 9 12 1966 9 12 2025 9 12 -
 If the numbers are taken as is, there would be 90s. The signal gets damped down over time due to the spread among the ensemble members. It's still fairly prominent at this timeframe.
 -
86/74/77 Went out on the deck to water the container plants and came back in all sweaty. Am counting down the hours for that cooler dryer air to come in tomorrow evening.
-
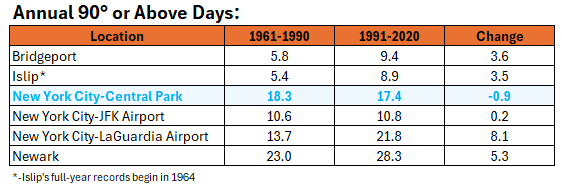
Here's how 90° or above days have changed in frequency between 1961-1990 and 1991-2020.
-
July 2025 Discussion-OBS - seasonable summer variability
LibertyBell replied to wdrag's topic in New York City Metro
Do you think NWS is going to use any of these stations for their official backup or perhaps even apply a corrective factor to the poorly sited Central Park ASOS? Which of these would be the closest to Central Park (so we can see the difference.) -
July 2025 Discussion-OBS - seasonable summer variability
LibertyBell replied to wdrag's topic in New York City Metro
wow 4 100+ in July and 99 in August -

July 2025 Discussion-OBS - seasonable summer variability
bluewave replied to wdrag's topic in New York City Metro
That’s why ConEd installed the new network. They were probably noticing stronger cooling demand from those neighborhoods in Queens and wanted to get reliable temperatures there. Since the airports are located right on the water and there is a large area of urban neighborhoods that are located more in the interior of the city. -
July 2025 Discussion-OBS - seasonable summer variability
LibertyBell replied to wdrag's topic in New York City Metro
so still a chance at 90 tomorrow? -
July 2025 Discussion-OBS - seasonable summer variability
SACRUS replied to wdrag's topic in New York City Metro
1988 as a scorcher especially west of the city July 1988 Newark Weather Day High (°F) Low (°F) Precip. (inches) Snow (inches) July 1 73 54 0.00 0.0 July 2 82 59 0.00 0.0 July 3 87 61 0.00 0.0 July 4 87 66 0.00 0.0 July 5 86 69 0.00 0.0 July 6 91 70 0.00 0.0 July 7 92 71 0.00 0.0 July 8 97 73 0.00 0.0 July 9 89 74 0.03 0.0 July 10 100 72 0.00 0.0 July 11 100 78 0.00 0.0 July 12 86 74 0.17 0.0 July 13 89 74 0.00 0.0 July 14 96 70 0.00 0.0 July 15 94 76 0.02 0.0 July 16 101 74 0.12 0.0 July 17 100 73 0.92 0.0 July 18 96 74 0.00 0.0 July 19 90 74 1.10 0.0 July 20 82 74 2.55 0.0 July 21 88 73 1.84 0.0 July 22 80 74 0.03 0.0 July 23 78 71 0.45 0.0 July 24 84 73 0.62 0.0 July 25 90 69 0.00 0.0 July 26 87 70 1.81 0.0 July 27 84 69 0.06 0.0 July 28 87 71 0.26 0.0 July 29 95 73 0.00 0.0 July 30 99 78 0.00 0.0 July 31 90 76 0.00 0.0 August 1988 Newark Weather Day High (°F) Low (°F) Precip. (inches) Snow (inches) August 1 91 76 0.00 0.0 August 2 94 76 0.00 0.0 August 3 93 76 0.00 0.0 August 4 92 77 0.00 0.0 August 5 90 77 0.00 0.0 August 6 90 75 0.00 0.0 August 7 93 77 0.00 0.0 August 8 90 75 0.00 0.0 August 9 92 75 0.00 0.0 August 10 93 76 0.01 0.0 August 11 97 77 0.00 0.0 August 12 95 80 0.00 0.0 August 13 98 79 0.00 0.0 August 14 98 80 0.00 0.0 August 15 99 81 0.00 0.0 August 16 92 74 0.00 0.0 August 17 90 70 0.05 0.0 August 18 88 71 0.00 0.0 August 19 79 64 0.00 0.0 August 20 76 64 0.00 0.0 August 21 87 61 0.00 0.0 August 22 80 60 0.00 0.0 August 23 74 65 0.06 0.0 August 24 79 64 1.38 0.0 August 25 83 64 0.01 0.0 August 26 89 67 0.01 0.0 August 27 81 71 0.00 0.0 August 28 89 71 0.00 0.0 August 29 79 67 0.30 0.0 August 30 76 66 0.00 0.0 August 31 81 60 0.00 0.0 -
July 2025 Discussion-OBS - seasonable summer variability
Brian5671 replied to wdrag's topic in New York City Metro
models have slowed everything down-looks more like over night Thurs into Fri for the best rains -
July 2025 Discussion-OBS - seasonable summer variability
LibertyBell replied to wdrag's topic in New York City Metro
10 minutes lol? It's 91 here now. In and out of clouds too. -
Raining in the S sub, and smoked out in the N. I'll take the smoke over the high dews. I don't have A/C, so I tough it out.