All Activity
- Past hour
-

July 2025 Obs/Disco ... possible historic month for heat
NW_of_GYX replied to Typhoon Tip's topic in New England
Big let down here, no wind. -

July 2025 Discussion-OBS - seasonable summer variability
donsutherland1 replied to wdrag's topic in New York City Metro
The climate models couple the ocean and atmosphere in forecasting circulation changes. To date, the trends in the Southwest (part of California) and Northeast are consistent with what is expected from the circulation changes. The 1960s were snowier, because the cold was so much greater than it has been recently. There was greater opportunity for precipitation to fall in the form of snow than there is today. During winters 1960-61 through 1969-70, the mean winter temperature was 32.6°, four winters had mean temperatures at or below 32°, with the warmest winter having a mean temperature of 35.9°. During 2010-11 through 2024-25, the mean winter temperature was 37.1° (above the warmest winter of the 1960s), the coldest winter was 32.7° (above the mean figure for the 1960s), and four winters had mean temperatures of 40° or above. The rapid increase in warmth has more than offset the wetter climate. As a result, New York City's snowfall is likely in the early stages of a secular decline. By the mid-2030s, it will be clear whether snowfall has truly entered a long-term decline, even as there will still be snowier cycles and snowier winters. I suspect that the 30-season mean snowfall figure will reach or fall below 20.0" at Central Park by the mid-2030s. -
85 at 12:30. Enjoy the weekend before significant humidity and heat come back Monday.
-

July 2025 Obs/Disco ... possible historic month for heat
Chrisrotary12 replied to Typhoon Tip's topic in New England
Congrats to me on the 30 seconds of rain and wind. -

July 2025 Obs/Disco ... possible historic month for heat
Lava Rock replied to Typhoon Tip's topic in New England
Gonna get rocked Sent from my SM-S921U using Tapatalk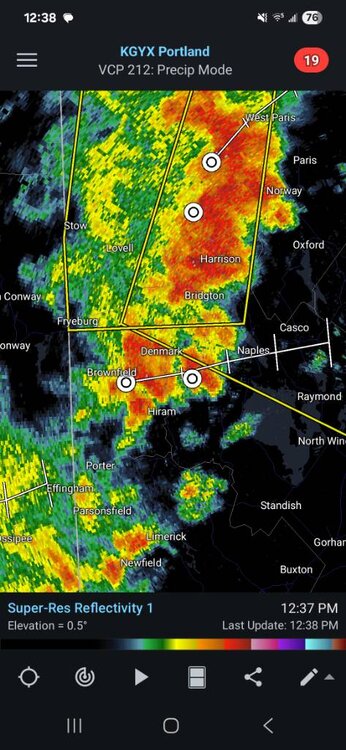
-

July 2025 Obs/Disco ... possible historic month for heat
dryslot replied to Typhoon Tip's topic in New England
Under a warning now for those cells over the Lakes region moving east. -

July 2025 Discussion-OBS - seasonable summer variability
LibertyBell replied to wdrag's topic in New York City Metro
100 back to back days in 1901 would have been a really big deal wow!! -
Occasional Thoughts on Climate Change
donsutherland1 replied to donsutherland1's topic in Climate Change
For purposes of illustration, below is an example of why Shewchuk's arguments are deeply flawed. The illustration examines the change in Phoenix's mean summer minimum temperatures. Shewchuk's dismissal of adjusted data would mean that Phoenix's climate has seen summer minimum temperatures increase almost 1.5° per decade due to climate change (natural and anthropogenic). His claims would ignore the impact that the emergence and then rapid growth of Phoenix's Urban Heat Island Effect has had on summer minimum temperatures. In 1941, the beginning of the first 30-year period under consideration, Phoenix had a population of just over 65,000. In 2024, Phoenix's population was 1,682,515. During 1940-1980, Phoenix's population grew an average of 6.4% per year; since 1980, it has been growing at about 1.8% per year. The sharper rise in the raw data during the first part of the chart and flattening afterward provide a footprint of the growth in the UHI. If one were seeking to understand how fast Phoenix's climate has been warming, one would need to exclude artificial factors e.g., UHI. That's what the adjustments do. They remove the impacts of siting changes (location, features such as new buildings, etc.), UHI, time of observation bias, etc. The adjustments allow for comparability. They make robust scientific analysis possible.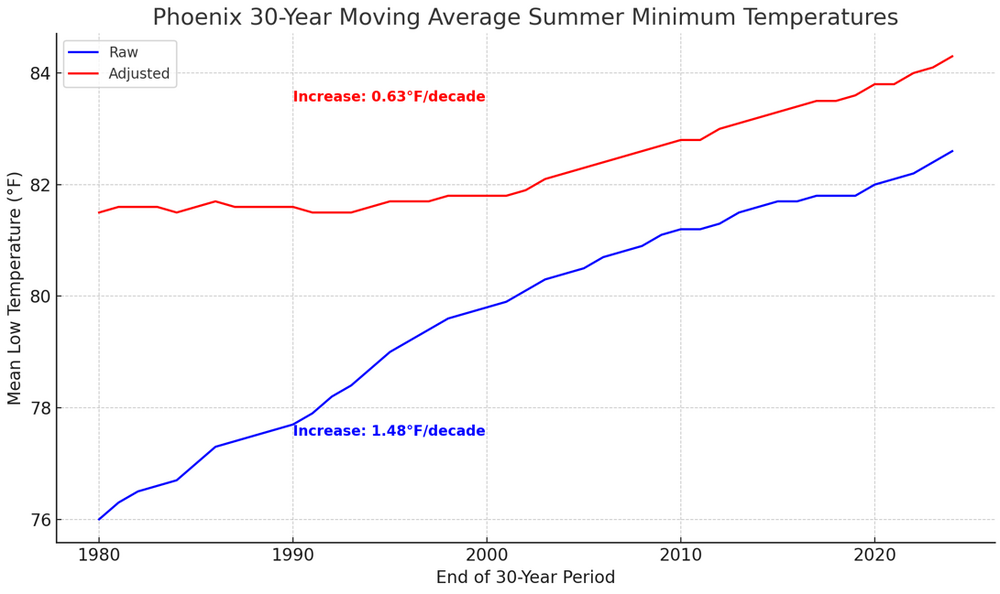
-
July 2025 Discussion-OBS - seasonable summer variability
LibertyBell replied to wdrag's topic in New York City Metro
It's fairly common to have really good winters after 100 degree heat in the summer (examples are 1933, 1944, 1955, 1966, 1977, 1993, 1995, 2010, 2013). -
July 2025 Discussion-OBS - seasonable summer variability
LibertyBell replied to wdrag's topic in New York City Metro
Another thing worth noting about the 60s is that although they were dryer, they had a lot more snow than the decades surrounding them-- my ideal combo, lots of snow in the winter and dry and hot weather in the summer. 1960-61, 1963-64 and 1966-67 were all classic and even historic winters. -
July 2025 Obs/Disco ... possible historic month for heat
NW_of_GYX replied to Typhoon Tip's topic in New England
We’re about to rock and roll here A SEVERE THUNDERSTORM WARNING REMAINS IN EFFECT UNTIL 1245 PM EDT FOR SOUTHWESTERN OXFORD AND NORTHWESTERN CUMBERLAND COUNTIES... At 1218 PM EDT, severe thunderstorms were located along a line extending from 6 miles north of Bethel to Fryeburg, moving east at 25 mph. HAZARD...60 mph wind gusts and quarter size hail. SOURCE...Radar indicated. IMPACT...Hail damage to vehicles is expected. Expect wind damage to roofs, siding, and trees. Locations impacted include... Hanover, Waterford, Woodstock, Stow, Fryeburg, Lovell, Sweden, Andover, Stoneham, Bethel, Albany, Greenwood, Bridgton, Roxbury, Rumford, Harrison, Mason, Norway, Milton, and Gilead. This also includes... Speckled Mountain, Pleasant Mountain, Long Lake, Caribou Mountain, and Screw Auger Falls. -
July 2025 Discussion-OBS - seasonable summer variability
LibertyBell replied to wdrag's topic in New York City Metro
So nice of you to acknowledge 1966, Tony! Was this the summer with the most 100+ days at all reporting sites at the same time? 1966 - The northeastern U.S. was in the midst of a sweltering heat wave. The temperature at Philadelphia reached 104 degrees. Afternoon highs of 102 degrees at Hartford CT, 105 degrees at Allentown PA, and 107 degrees at LaGuardia Airport in New York City established all-time records for those two locations. (David Ludlum) (The Weather Channel) and dont forget the 104 at JFK, our all time record too and our only three day 100+ streak!!! Highs: EWR: 105 (1966) NYC: 103 (1966) LGA: 107 (1966) JFK: 104 (1966) -
July 2025 Obs/Disco ... possible historic month for heat
dryslot replied to Typhoon Tip's topic in New England
I hope we 7-10 here. -
July 2025 Discussion-OBS - seasonable summer variability
LibertyBell replied to wdrag's topic in New York City Metro
ideal weather!! -
July 2025 Discussion-OBS - seasonable summer variability
LibertyBell replied to wdrag's topic in New York City Metro
deep blue skies are ideal, we had that for the Fourth a few years ago, was that in 2018? I don't remember the year.... -
July 2025 Obs/Disco ... possible historic month for heat
Chrisrotary12 replied to Typhoon Tip's topic in New England
Wind is ripping and cold. -
July 2025 Discussion-OBS - seasonable summer variability
LibertyBell replied to wdrag's topic in New York City Metro
Don what are the geographical differences that are causing these different results? I would expect more rainfall in the West because they have an ocean to the west of them (the jet stream goes west to east for the most part) and less rainfall in the East because we have an entire continent to the west of us. Another thing worth noting about the 60s is that although they were dryer, they had a lot more snow than the decades surrounding them-- my ideal combo, lots of snow in the winter and dry and hot weather in the summer. 1960-61, 1963-64 and 1966-67 were all classic and even historic winters. -

July 2025 Obs/Disco ... possible historic month for heat
SJonesWX replied to Typhoon Tip's topic in New England
can confirm it was pretty windy for a few mins, but now it's just some rain -

July 2025 Obs/Disco ... possible historic month for heat
Typhoon Tip replied to Typhoon Tip's topic in New England
anyway, you'll go back sunny in a half hour ... we'll see if we can recharge. -
July 2025 Obs/Disco ... possible historic month for heat
Typhoon Tip replied to Typhoon Tip's topic in New England
we had a wind shift prior to this line moving in ... was SW ..now WNW I think this was a processed air from when this was over eastern NY earlier this morning. it's not really associated/generated by this current/nascent stuff because it was too far out ahead. -

July 2025 Obs/Disco ... possible historic month for heat
JJBASHB replied to Typhoon Tip's topic in New England
Watching a plane take off right now. That cell was weird, it formed a bit ahead of the line and was stationary over the city for a few frames. No rain but sustained 33 with a gust to 47. Car was rocking a bit. -

2025-2026 ENSO
40/70 Benchmark replied to 40/70 Benchmark's topic in Weather Forecasting and Discussion
Yea, that cooling of the subsurface towards the dateline was expected with the weakening of the WWBs....will probably progress eastward amd at least somewhat upwards. -
Couldn’t ask for a better holiday weekend weather wise
-

July 2025 Obs/Disco ... possible historic month for heat
weatherwiz replied to Typhoon Tip's topic in New England
The dew trends have been interesting. It still seems though that the HRRR is a bit off with the dews but it does increases dews later this afternoon/early evening (as you'd expect) and that's when it kind of generates more precip. Also wondering if maybe we dry things out a bit too much in the mlvls. It's going to be interesting to see how things unfold later this afternoon. -

2025-2026 ENSO
Stormchaserchuck1 replied to 40/70 Benchmark's topic in Weather Forecasting and Discussion
Actually some big changes in the ENSO subsurface over the last 2 months.