blackngoldrules Posted January 22 Share Posted January 22 Winter Storm WatchURGENT - WINTER WEATHER MESSAGENational Weather Service Pittsburgh PA204 AM EST Thu Jan 22 2026OHZ039>041-048>050-057>059-068-069-PAZ013-014-020>022-029-031-073-075-WVZ001>004-012-021-509>511-513-221515-/O.NEW.KPBZ.WS.A.0001.260125T0000Z-260126T1800Z/Tuscarawas-Carroll-Columbiana-Coshocton-Harrison-Jefferson OH-Muskingum-Guernsey-Belmont-Noble-Monroe-Lawrence-Butler-Beaver-Allegheny-Armstrong-Washington-Greene-Westmoreland-Fayette-Hancock-Brooke-Ohio-Marshall-Wetzel-Marion-Monongalia-Ridges of Eastern Monongalia and Northwestern Preston-Preston-Western Tucker-Including the cities of Malvern, Greensburg, New Philadelphia,Monessen, Wheeling, Cambridge, Weirton, Zanesville, Parsons,Ambridge, Canonsburg, Coshocton, Dover, Uniontown, Cadiz, Fairmont,Follansbee, Salem, New Martinsville, Kittanning, Martins Ferry, SaintGeorge, New Castle, Washington, EastLiverpool, St. Clairsville, Butler, Bruceton Mills, Monaca,Caldwell, Kingwood, New Kensington, Beaver Falls, Wellsburg,Woodsfield, Aliquippa, Morgantown, Moundsville, Latrobe, Columbiana,Steubenville, Ellwood City, Murrysville, Waynesburg, Lower Burrell,Pittsburgh Metro Area, Hendricks, Coopers Rock, Ford City, andCarrollton204 AM EST Thu Jan 22 2026...WINTER STORM WATCH IN EFFECT FROM SATURDAY EVENING THROUGH MONDAYAFTERNOON...* WHAT...Moderate to major impacts to the region are possible later this weekend with periods of moderate to heavy snow.* WHERE...Portions of east central Ohio, southwest and western Pennsylvania, and northern and the northern panhandle of West Virginia.* WHEN...From Saturday evening through Monday afternoon.* IMPACTS...Travel could be very difficult to impossible later this weekend and Monday morning.PRECAUTIONARY/PREPAREDNESS ACTIONS...Monitor the latest forecasts for updates on this situation. 3 Link to comment Share on other sites More sharing options...
blackngoldrules Posted January 22 Share Posted January 22 06z GFS. Yikes. Not sure what Euro is showing when ratios are added as I don't have the paid version. Almost 10 inches 10:1 ratio. Sent from my SM-S931U using Tapatalk 1 Link to comment Share on other sites More sharing options...
southpark Posted January 22 Share Posted January 22 38 minutes ago, blackngoldrules said: 06z GFS. Yikes. Not sure what Euro is showing when ratios are added as I don't have the paid version. Almost 10 inches 10:1 ratio. Sent from my SM-S931U using Tapatalk What a turnaround on the GFS. Wish the storm was starting right now with that run! Link to comment Share on other sites More sharing options...
colonel717 Posted January 22 Share Posted January 22 We are at 12-13 inches with all this to the west for the NAM Link to comment Share on other sites More sharing options...
southpark Posted January 22 Share Posted January 22 3 minutes ago, colonel717 said: We are at 12-13 inches with all this to the west for the NAM Let's hope that sleet line doesn't get any closer and goes south in future runs. Link to comment Share on other sites More sharing options...
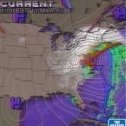
SteelCity87 Posted January 22 Share Posted January 22 06z Euro 2 1 1 Link to comment Share on other sites More sharing options...
colonel717 Posted January 22 Share Posted January 22 26 minutes ago, southpark said: Let's hope that sleet line doesn't get any closer and goes south in future runs. Yea but we would have 15+ by the time it may even mix for a little so at that point no big deal. It's not letting me WTOD at the beginning if it even happens at any point. Link to comment Share on other sites More sharing options...
jwilson Posted January 22 Share Posted January 22 NBM mean on today's 7 UTC run up to 11" even. Spread tightened a little more to 7" to 13" on average. 1 in 3 odds of >12" total. >8" up slightly to 68% chance. Most guidance held, so I guess we're waiting to see if a last minute de-amplification occurs. (As a side note, I see a lot of Kuchera maps, but just be careful about those as they tend to get overdone on totals.) Link to comment Share on other sites More sharing options...
colonel717 Posted January 22 Share Posted January 22 14 minutes ago, jwilson said: NBM mean on today's 7 UTC run up to 11" even. Spread tightened a little more to 7" to 13" on average. 1 in 3 odds of >12" total. >8" up slightly to 68% chance. Most guidance held, so I guess we're waiting to see if a last minute de-amplification occurs. (As a side note, I see a lot of Kuchera maps, but just be careful about those as they tend to get overdone on totals.) Most kuchara are about 13-15 to 1 which is quite possible for a good part of the storm. Link to comment Share on other sites More sharing options...
Burghblizz Posted January 22 Author Share Posted January 22 I’d say the 6Zs more than held serve! 1 Link to comment Share on other sites More sharing options...
Gordo74 Posted January 22 Share Posted January 22 8 hours ago, colonel717 said: Skinner has been a good surprise. He may even end up being the advantage in, dare I say, a playoff round with all of his experience. Really fun to be tracking both a snowstorm and pens playoff chances again. It’s like the early 10’s all over again. 1 Link to comment Share on other sites More sharing options...
RitualOfTheTrout Posted January 22 Share Posted January 22 Great overnight runs that look to be continuing into 6z. I passed out and missed all the fun, the prior two nights staying up late and getting up for work took their toll lol. Looks like I missed a good Pens game too. 1 Link to comment Share on other sites More sharing options...
colonel717 Posted January 22 Share Posted January 22 1 Link to comment Share on other sites More sharing options...
Gordo74 Posted January 22 Share Posted January 22 4 minutes ago, colonel717 said: I feel like this is purposeful rage bait with stopping it at 7am Sunday when it’s an all day event Sunday, 2 Link to comment Share on other sites More sharing options...
Ahoff Posted January 22 Share Posted January 22 Yea, that snow map is tricky from NWS. Link to comment Share on other sites More sharing options...
TimB Posted January 22 Share Posted January 22 Those maps can only ever go out 72 hours. Link to comment Share on other sites More sharing options...
jwilson Posted January 22 Share Posted January 22 21 minutes ago, colonel717 said: Most kuchara are about 13-15 to 1 which is quite possible for a good part of the storm. The issue with Kuchera isn't necessarily the math but rather model output, so the maps themselves are often flawed. Ground truth is typically less, but that doesn't mean they are always wrong, of course. Snow calculation is complex, as is my explanation here (apologies). The actual equation for Kuchera is this: Quote 1) Find the maximum temperature in the lowest 500 hPa in degrees K (MaxT). 2) If MaxT is greater than 271.16K, then the liquid equivalent ratio (RAT) is 12.0 + 2.0*(271.16-MaxT). 3) If MaxT is less than 271.16K, then the liquid equivalent ratio (RAT) is 12.0 + (271.16-MaxT) But nearly none of the output products in models take into account the other variables of snow growth. Lift, dendrite growth, and humidity, for example. Snowfall rates are never constant over X time. As a basic tenet, highest snowfall ratios (say 25:1) occur when most of the lift is situated at temps in the atmosphere between -12 and -18 Celcius. Otherwise known as the "snow production zone." There's a method (Cobb) that uses a layered approach to estimate snowfall ratios at a given time. It can be paired with Bufkit data to estimate total snowfall, because the Bufkit software has the highest vertical resolution to pair with soundings. Using this with the 6Z GFS run, for example, gives us 13.2" of snow on 1.04" of precip at AGC. Ratios vary from 5:1 up to 30:1 in hour snapshots. That's a higher-end result when compared with the averaged NBM data (0.79" precip average). Same method is 9.6" of snow on the 0Z GFS run. We can run this on the NAM, too, but it's not yet within range. My main point is that, looking at the 6Z Euro for instance, if people start expecting 17" they are quite likely to end up disappointed, so I had wanted to put out a general caveat emptor for those reading the maps that maybe aren't aware of the limitations. 1 Link to comment Share on other sites More sharing options...
RitualOfTheTrout Posted January 22 Share Posted January 22 3 minutes ago, jwilson said: The issue with Kuchera isn't necessarily the math but rather model output, so the maps themselves are often flawed. Ground truth is typically less, but that doesn't mean they are always wrong, of course. Snow calculation is complex, as is my explanation here (apologies). The actual equation for Kuchera is this: But nearly none of the output products in models take into account the other variables of snow growth. Lift, dendrite growth, and humidity, for example. Snowfall rates are never constant over X time. As a basic tenet, highest snowfall ratios (say 25:1) occur when most of the lift is situated at temps in the atmosphere between -12 and -18 Celcius. Otherwise known as the "snow production zone." There's a method (Cobb) that uses a layered approach to estimate snowfall ratios at a given time. It can be paired with Bufkit data to estimate total snowfall, because the Bufkit software has the highest vertical resolution to pair with soundings. Using this with the 6Z GFS run, for example, gives us 13.2" of snow on 1.04" of precip at AGC. Ratios vary from 5:1 up to 30:1 in hour snapshots. That's a higher-end result when compared with the averaged NBM data (0.79" precip average). Same method is 9.6" of snow on the 0Z GFS run. We can run this on the NAM, too, but it's not yet within range. My main point is that, looking at the 6Z Euro for instance, if people start expecting 17" they are quite likely to end up disappointed, so I had wanted to put out a general caveat emptor for those reading the maps that maybe aren't aware of the limitations. I made a similar point a few days ago, although you dove much more into the technical side. This is why I would rather see total qpf for an event when determining if it's a "better" run vs Kuchera or even 10:1 if you are talking surface maps. That being said, looking at maps with all these high totals for our backyards is fun as long as you keep yourself grounded and as you say, don't end up disapointed. I never got some of the angst people had when someone posted a "clown map" Afterall, where else outside of a weather forum would something like that be understood or appreciated? 1 1 Link to comment Share on other sites More sharing options...
Burghblizz Posted January 22 Author Share Posted January 22 10 minutes ago, jwilson said: The issue with Kuchera isn't necessarily the math but rather model output, so the maps themselves are often flawed. Ground truth is typically less, but that doesn't mean they are always wrong, of course. Snow calculation is complex, as is my explanation here (apologies). The actual equation for Kuchera is this: But nearly none of the output products in models take into account the other variables of snow growth. Lift, dendrite growth, and humidity, for example. Snowfall rates are never constant over X time. As a basic tenet, highest snowfall ratios (say 25:1) occur when most of the lift is situated at temps in the atmosphere between -12 and -18 Celcius. Otherwise known as the "snow production zone." There's a method (Cobb) that uses a layered approach to estimate snowfall ratios at a given time. It can be paired with Bufkit data to estimate total snowfall, because the Bufkit software has the highest vertical resolution to pair with soundings. Using this with the 6Z GFS run, for example, gives us 13.2" of snow on 1.04" of precip at AGC. Ratios vary from 5:1 up to 30:1 in hour snapshots. That's a higher-end result when compared with the averaged NBM data (0.79" precip average). Same method is 9.6" of snow on the 0Z GFS run. We can run this on the NAM, too, but it's not yet within range. My main point is that, looking at the 6Z Euro for instance, if people start expecting 17" they are quite likely to end up disappointed, so I had wanted to put out a general caveat emptor for those reading the maps that maybe aren't aware of the limitations. Good info and good balanced take. I’ll still look at the clown maps and dream, but great info for what is more likely (which isn’t bad at all) 1 Link to comment Share on other sites More sharing options...
southpark Posted January 22 Share Posted January 22 30 minutes ago, colonel717 said: I'll reserve judgement until they put out the next one since that should cover the scope of the storm. Link to comment Share on other sites More sharing options...
MikeB_01 Posted January 22 Share Posted January 22 Good morning, all. NAM is running. Lets keep track on this 12z suite. Link to comment Share on other sites More sharing options...
Burghblizz Posted January 22 Author Share Posted January 22 31 minutes ago, Gordo74 said: I feel like this is purposeful rage bait with stopping it at 7am Sunday when it’s an all day event Sunday, lol - rage bait. Yeah, I had to do a double take at the timeframe. I really do think though it’s because they don’t want to put out a map that extends more than 72 hours out. 1 Link to comment Share on other sites More sharing options...
Rd9108 Posted January 22 Share Posted January 22 I saw this on Facebook. Who are these guys and why do they think its a good idea to predict 16-22 inches for area A. No model even with ratios is predicting that. Link to comment Share on other sites More sharing options...
colonel717 Posted January 22 Share Posted January 22 37 minutes ago, jwilson said: Always appreciate your detailed posts. I am obviously someone who is guilty of posting Kuchara at times , but I certainly don't ever expect those totals that any model puts out. Maybe RD9108 does.. Just kidding bud.. It helps me put together a range. As ROTT said, it is fun. That is what following this weather is all about for me. Enjoy any snow we get. 1 Link to comment Share on other sites More sharing options...
Rd9108 Posted January 22 Share Posted January 22 SREF mean is almost 11-12 inches at 10 to 1. 1 Link to comment Share on other sites More sharing options...
Rd9108 Posted January 22 Share Posted January 22 Deep Mind 2 Link to comment Share on other sites More sharing options...
TimB Posted January 22 Share Posted January 22 NAM is going to be meh, isn’t it? Link to comment Share on other sites More sharing options...
colonel717 Posted January 22 Share Posted January 22 NAM is south of where it was this morning. Its so over... Link to comment Share on other sites More sharing options...
Burghblizz Posted January 22 Author Share Posted January 22 6 minutes ago, TimB said: NAM is going to be meh, isn’t it? It was looking stringy and unorganized at first, but it’s getting its act together by hour 72. The end result will be good. Taken literally, it suppresses the precip at first, and then drives the SLP into our backyard which creates mix and dry slot issues. I guess it’s an example of threading the needle to get a “fail” for bigger snows, but verbatim still probably 10” + Link to comment Share on other sites More sharing options...
MikeB_01 Posted January 22 Share Posted January 22 2 minutes ago, TimB said: NAM is going to be meh, isn’t it? I think it look very similar to the 6z. Only difference i can see through hr 69 is the HP over new england is suprressing the precip shild slightly. At the 500 level, the southern energy seems to be a little more outfront of the kicker from the north. This should cause more amplification, but it doesn't appear to be when you look at the reflectivity maps Link to comment Share on other sites More sharing options...

Recommended Posts
Create an account or sign in to comment
You need to be a member in order to leave a comment
Create an account
Sign up for a new account in our community. It's easy!
Register a new accountSign in
Already have an account? Sign in here.
Sign In Now