
radarman
-
Posts
14,412 -
Joined
-
Last visited
Content Type
Profiles
Blogs
Forums
American Weather
Media Demo
Store
Gallery
Everything posted by radarman
-
That radar loop is nuts especially at the end
-
Good sized fire in BTown also
-
Fixable problems
-
summit chair laps on Mt Ellen
-
CONCERNING...SEVERE POTENTIAL...WATCH LIKELY VALID 021822Z - 022015Z PROBABILITY OF WATCH ISSUANCE...95 PERCENT SUMMARY...SUPERCELLS WITH A RISK FOR ALL HAZARDS MAY DEVELOP AS EARLY AS MID AFTERNOON ACROSS PORTIONS OF CENTRAL AND NORTH TX, INTO SOUTHERN OK. A TORNADO WATCH WILL BE ISSUED SOON TO COVER THE THREAT. DISCUSSION...ACROSS THE SOUTHERN PLAINS, AFTERNOON WV IMAGERY SHOWED A WELL-DEVELOPED, COMPACT VORT MAX TRANSITING ACROSS FAR WEST TX AND EASTERN NM. AHEAD OF THE VORT MAX, RAPID LOW-LEVEL SURFACE MOISTURE RETURN WAS EVIDENT ACROSS CENTRAL AND NORTH TX WITH DEWPOINTS SURGING FROM THE LOW TO MID 50S TO MID 60S F OVER THE LAST 1-2 HOURS. WITH RAPID MOISTENING AND PARTIAL CLOUD BREAKS ONGOING, CONTINUED DESTABILIZATION (1500-2000 J/KG MLCAPE) IS EXPECTED THROUGH THE AFTERNOON. VERY STEEP MID-LEVEL LAPSE RATES (8.5-9 C/KM) FROM THE 12Z RAOBS WILL SUPPORT RAPID AND ROBUST UPDRAFT DEVELOPMENT, POTENTIALLY AS EARLY AS 19-20Z. STRONG VERTICAL SHEAR AHEAD OF THE VORT MAX ( 45-60 KT 0-6KM SHEAR) WILL ALLOW FOR STORM ORGANIZATION WITH A PREDOMINATELY SUPERCELLULAR MODE. A SOMEWHAT COMPLEX CONVECTIVE SCENARIO MAY EVOLVE THIS AFTERNOON WITH MULTIPLE AREAS OF NEAR SIMULTANEOUS INITIATION POSSIBLE. CELLS MAY INITIATE WITHIN THE MODIFYING WARM SECTOR NEAR AND TO THE WEST/NORTHWEST OF THE METROPLEX AND FAR SOUTHWEST OK. AT THE SAME TIME, THE DRYLINE IN WEST-CENTRAL TX WILL LIKELY INITIATE A FEW SUPERCELLS AS IT MIXES EASTWARD. HODOGRAPHS, WHILE CURVED IN THE LOWEST 1-2 KM, ARE EXTENDED AND MOSTLY STRAIGHT LINE ALOFT. THIS, ALONG WITH THE FAVORABLE BUOYANCY AND LAPSE RATES STRONGLY SUGGESTS LARGE AND WIND-DRIVEN DAMAGING HAIL WILL BE LIKELY WITH ANY SUSTAINED STORMS. A TORNADO RISK (SOME SIGNIFICANT) MAY ALSO EVOLVE GIVEN THE POTENTIAL FOR DISCRETE CELLS AND 0-1KM SRH OF 150-200 M2/S2. A LOCALLY GREATER TORNADO RISK MAY ALSO EVOLVE FARTHER EAST WHERE LOW-LEVEL SHEAR IS EXPECTED TO INCREASE LATER THIS EVENING. GIVEN THE POTENTIAL FOR SEVERAL SUPERCELLS WITHIN A RAPIDLY MODIFYING AND FAVORABLE THERMODYNAMIC/KINEMATIC ENVIRONMENT, A TORNADO WATCH WILL LIKELY BE ISSUED THIS AFTERNOON. ..LYONS/HART.. 04/02/2023
-
latest HRRR is eye opening... 3km nam not quite as bullish. Really the only question mark is the strength of the LLJ. April 2nd is a notorious day for severe weather in Dallas.
-
Cell really intensified fast. Lapse rates ftw. Tons of lightning
-
Hail here Edit- dimes
-
Thunder here
-
Looks like crapvection
-
Went from 60s sun and blue skies at Berkshire east to low 50s and gloomy fog in Greenfield ftl
-
Pentathalon crowd at Berkshire East today being rewarded with a well deserved gorgeous afternoon.
-
 Pond skating A- (two high end stretches with multi year return periods) Local skiing B+ (very good early and late with an extended period of suck) Snow in the back yard, D (3rd lowest seasonal total of the last 20 years, several counterfeit front end snows immediately wiped out, and multiple painful just misses) Pleasantness, D-. (some garbage winters have a lot of nice days, like 11-12 for example. 22-23? Yeah no)
- 64 replies
-
- 1
-

-
- terrible
- depressing
- (and 3 more)
-
Does the sun come out after this batch of rain pushes through?
-
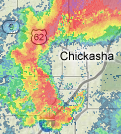
NBC 5 has a fairly nice S Band radar SE of Dallas that can be viewed here: https://www.nbcdfw.com/weather/ (zoom in on radar on the right side of the page and it switches to their high res S band) SVR watch issued for a nearby storm, entering the Tornado Watch area
-
speaking of... 90/90 tornado probs in the PDS watch... that's 4/27/11
-
Minor deal compared to elsewhere but a few decently strong storms fired on the east side of DFW with hail and strong winds, if sub-severe. Areas of NE Texas might catch a few severe cells later on with the better atmosphere. edit- Tornado watch just issued for the far eastern metroplex and areas further east
-
This was the first double high risk area since 4/14/12 A lot of tornadoes that day, but I vaguely recall folks considering it a minor bust. I chased the tail end of the dryline in SW which was always very low probability of producing, and sure enough it didn't produce. But I was out there anyway so NBD.
-
Given that 4/27/2011 was a top 3 day or something, it's just about impossible to expect that kind of an outbreak in advance. Let's hope it doesn't amount to that at any rate. 5/24/2011 was another huge day (see my avatar) and this could be up there with that one, although a much different set up obviously.
-
that's a helluva hatched area... for all 3 hazards
-
This video is freaking intense https://komonews.com/amp/news/local/video-snowboarder-rescued-back-country-mount-baker-ski-area-bellingham-washington-state-snowboarding-skiing-safety-gopro-outdoor-sports
-
Unclear if the extreme reversals are the norm or something other than the norm but at least it's balance to an extent. This happened in North Texas as well... long term drought almost totally reversed in spring of 2015. Reservoirs went from way down to filled up. And by and large the drought has not returned there in any serious fashion thereafter. Hopefully the same can be said about Cali in the years to come, though we wouldn't mind them sharing the wealth sometimes.
-
Some variation but largely reservoirs are in good shape. Also, just anecdotally I took this flying into Sacramento a week and a half ago. Moist.
-
XMas '02 was a biggie for many to the west. Logan in NY killed it especially. I recall it absolutely pounding snow driving south down 128 sometime that evening. Total whiteout and a scary scene. But some point near the going east/going west clusterf*** it flipped and then poured rain once on the SE expressway all the way down rt 3. Don't recall what areas between 128 and 495 ended up with. It was paste so probably bad ratios. But a nice storm either way. Big HP in place IIRC.
-
Yep, today was the day. Skied wonderfully and the weather was ideal.

