Winter Wizard
-
Posts
689 -
Joined
-
Last visited
Content Type
Profiles
Blogs
Forums
American Weather
Media Demo
Store
Gallery
Everything posted by Winter Wizard
-

Strong Nor'Easter/Hybrid Storm Late September 2026
Winter Wizard replied to Rjay's topic in New York City Metro
-
Strong Nor'Easter/Hybrid Storm Late September 2026
Winter Wizard replied to Rjay's topic in New York City Metro
The only similarities between this storm and Sandy are they're both occurring at high tide and to an extent retrograding westward. Sandy is going to be 40-50 mb stronger and several times larger in diameter and wind field. This isn't even in the same league. Having said that, I do think the coastal flooding in some areas may end up getting close to those levels, particularly on Long Island, Raritan Bay, and parts of the Jersey Shore. -
Strong Nor'Easter/Hybrid Storm Late September 2026
Winter Wizard replied to Rjay's topic in New York City Metro
I am honestly quite concerned that Upton is behind the ball and significantly downplaying the winds and coastal impacts. I would argue Long Island, not the Cape is looking increasingly like the overall bullseye. -
2026-2027 Record-breaking El Nino
Winter Wizard replied to Stormchaserchuck1's topic in Weather Forecasting and Discussion
An interesting thing about the GLAAM is that when it's plotted on a latitudinal basis, it's actually shown to be strongly in the negative direction around the mid-latitudes. It almost looks like a glitch but it has been moderately to strongly negative at various other points since July. Perhaps some interference somewhere? -
Agreed. The frequency of events is almost certainly going to be lower than normal. The question is, will we be able to take advantage of the opportunities when they arise?
-
Even in the two Super El Ninos (1972-73 and 1997-98) that produced near shutout winters, it wasn't because of lack of opportunities. There were big storms, just elsewhere. January 1973 was one of the biggest daily snowfalls in Virginia Beach's history. Then February 1973 was one of the most greatest snowstorms in the Southeast. 1998 had one of the worst ice storms on record in New England and an all timer blizzard in Kentucky. Even interior areas of the Northeast managed to do well in some of the events that were all rain near I-95. It's not hard to see how those storms could become an I-95 hit instead if the deck is reshuffled. Pinpointing whether storms are a hit or miss comes down to storm track, which partially comes down to luck but more so based on large scale teleconnections that cannot be accurately pinpointed this far out. Either way, warm overall (dare I say torch) with a higher than usual chance of a KU seems like a reasonable call.
- 841 replies
-
- 14
-

-
2026 Atlantic Hurricane Season
Winter Wizard replied to Stormchaserchuck1's topic in Tropical Headquarters
Record warmth now covers most of the Gulf. northern Caribbean Sea, and portions of the Atlantic. Wouldn't take much for a spin-up to occur in a prime spot with the right steering flow to put parts of the US in danger over the coming weeks. I do worry that the narrative of "record low" activity (which is true) is going to cause people to let their guards down. @GaWxshowed proof of that. Additionally, if this combo does not occur in 2026, then that becomes extra concerning for 2027, especially if there is a flip back to a cool ENSO state. -
2026 Atlantic Hurricane Season
Winter Wizard replied to Stormchaserchuck1's topic in Tropical Headquarters
But what's interesting about this graph is it shows closer to home, the Gulf and the Atlantic, have been less hostile with subdued wind shear. Not to mention SSTs are an inferno. I certainly don't see anything on the horizon anytime soon, but that's another piece of data that suggests if something does take off this year, it will likely be closer to home. I think Edouard was a warning shot in that regard considering how close it was to becoming a hurricane in the runup to landfall. We very well may come out unscathed, but I think it's a mistake for people to write off the season entirely at this point. -
2026-2027 Record-breaking El Nino
Winter Wizard replied to Stormchaserchuck1's topic in Weather Forecasting and Discussion
Makes sense. Here was today's date in 2015 for reference...much worse on the West Coast but majority of the CONUS was drought free.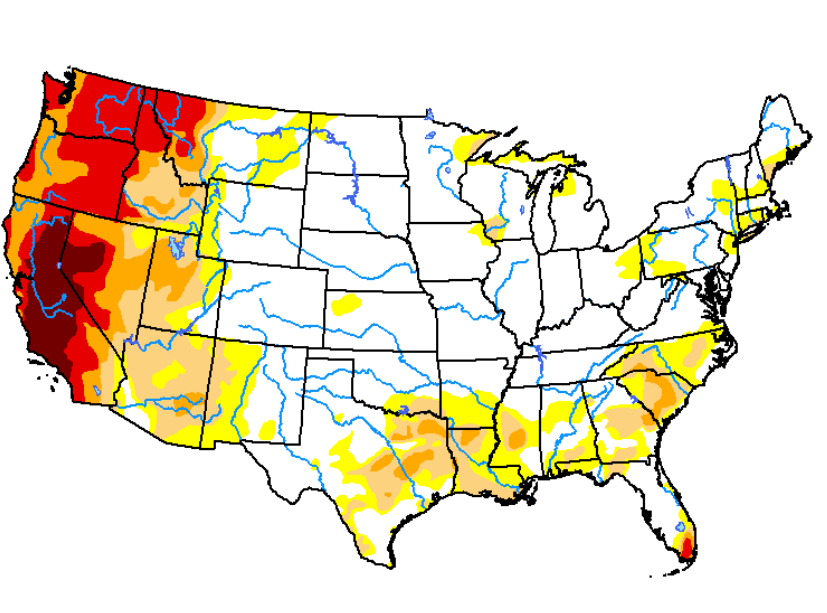
-
2026-2027 Record-breaking El Nino
Winter Wizard replied to Stormchaserchuck1's topic in Weather Forecasting and Discussion
I'm not sure what, if any implications, this will have going forward or exactly what the root cause is but it's pretty clear August 2026 behaved much differently than other Super Nino cases (1982, 1997, 2015) and was essentially a hotter version of 2023. I don't think there was anyone in the industry who predicted anything close to a recor Right away, you could probably attribute it, at least in part, to much higher national drought coverage than we've seen in other Nino cases since 2000.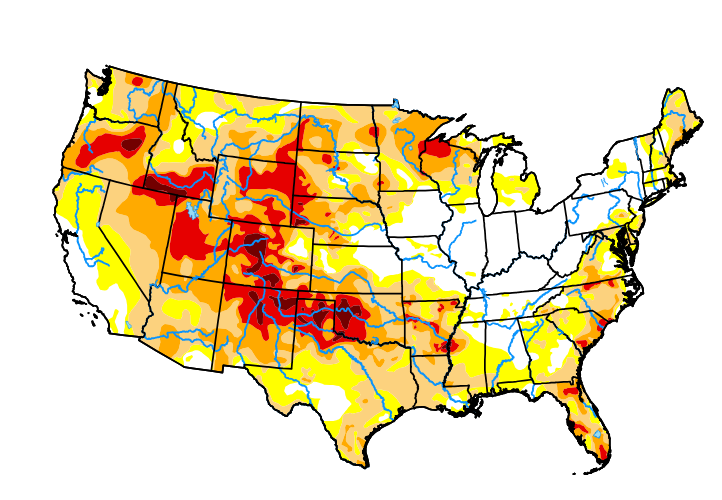
-
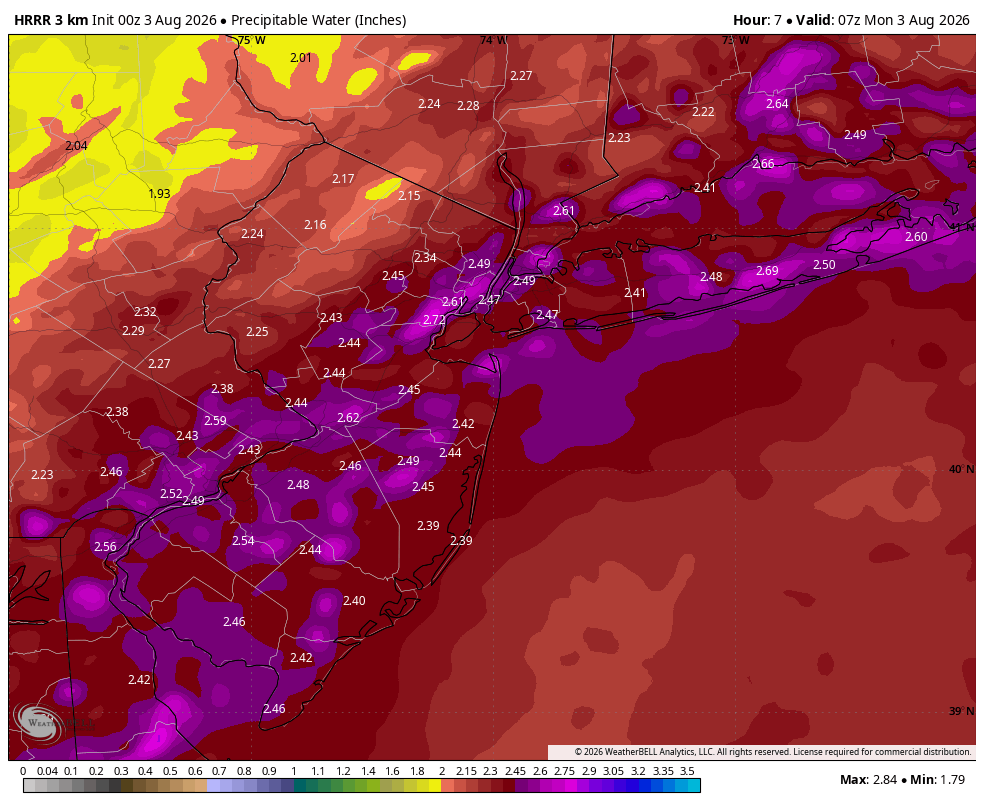
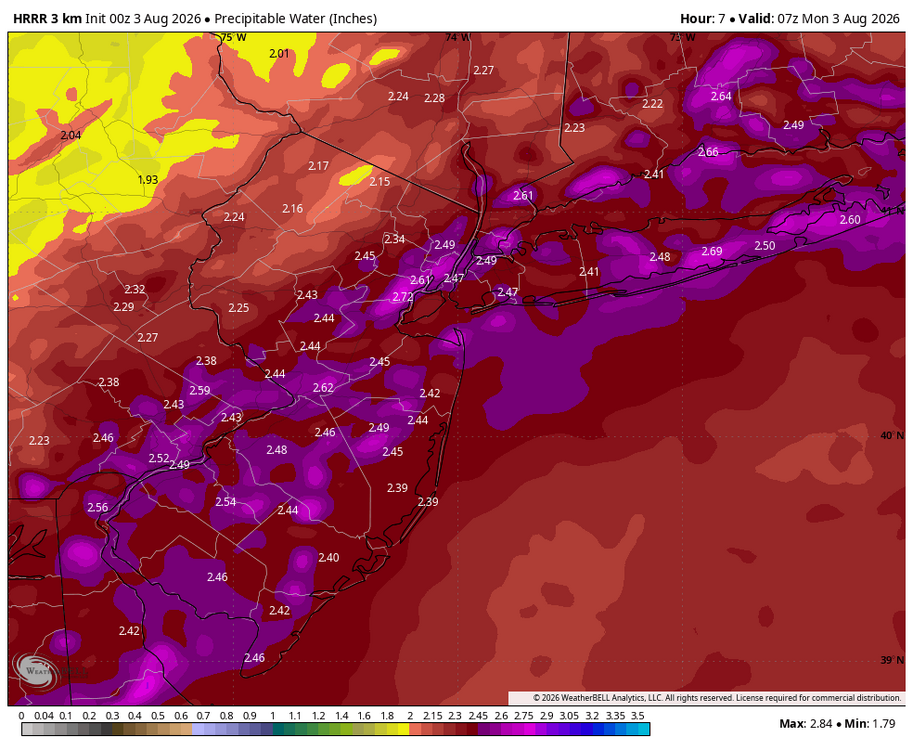
That is a pretty concerning look for flash flooding potential across most of the Metro tonight into tomorrow morning. I honestly have no idea why the flood watches have not been extended into the City and beyond. Guess we'll see if other guidance is on board for this look.
-
Something similar actually happened yesterday over Pennsylvania too, the fires sharpen the thermal gradient and can increase both the coverage and area and intensity of storms over a local swath. Yeah, models did not pick up on this at all, and it didn't become apparent until maybe midday Tuesday. I suppose if that was the case, it would've led to subsidence elsewhere, maybe farther north.
-
I think it's pretty clear that the wildfire smoke was the main culprit for thunderstorm activity not occurring over Maine as it suppressed instability to an extent and created and maintained a mid-level cap. Doesn't seem like modeling picked up on that at all. On the opposite end of the spectrum, the lack of storms in Maine also meant that the environment S and W was untapped and contributed to overperformance farther south in NY, VT, and NH. The forcing was clearly there and this was close to being a much more destructive event. I think we got pretty lucky all things considered but numerous severe reports in this region doesn't constitute a total "bust" IMO.
-
Certainly possible, it is one of the most desolate regions in the entire country and it's rare to get any kind of chaser traffic. Still, that's an impressive streak and more than double the previous. I guess you could say Maine is overdue.
-
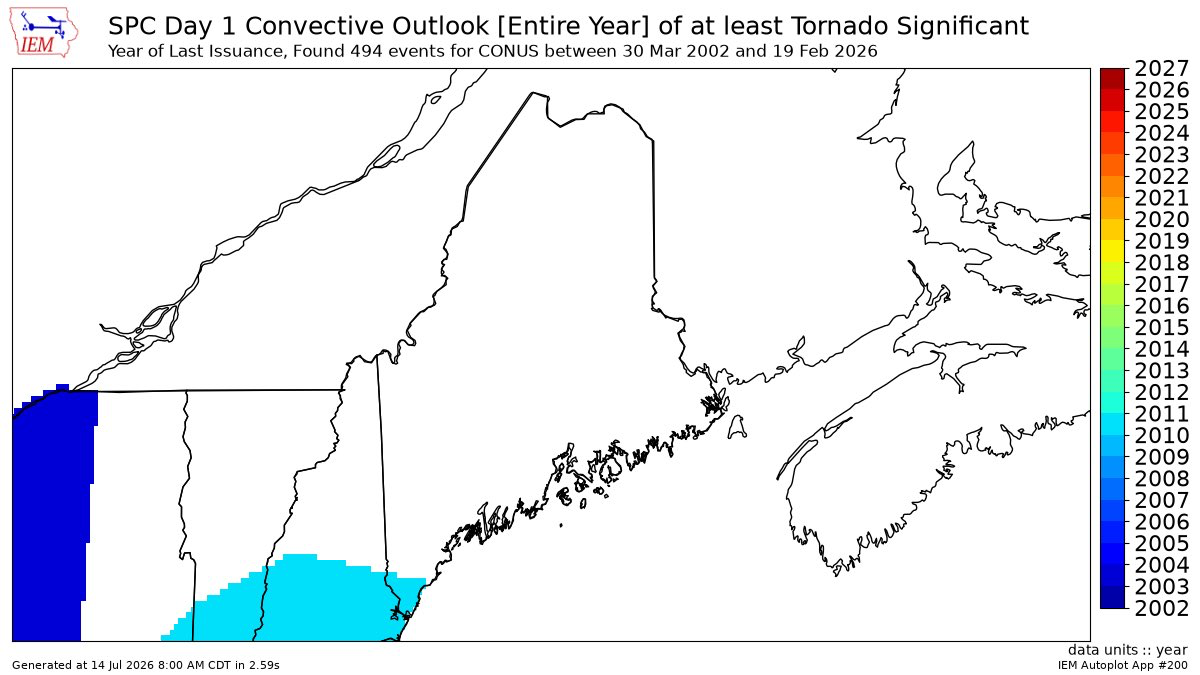
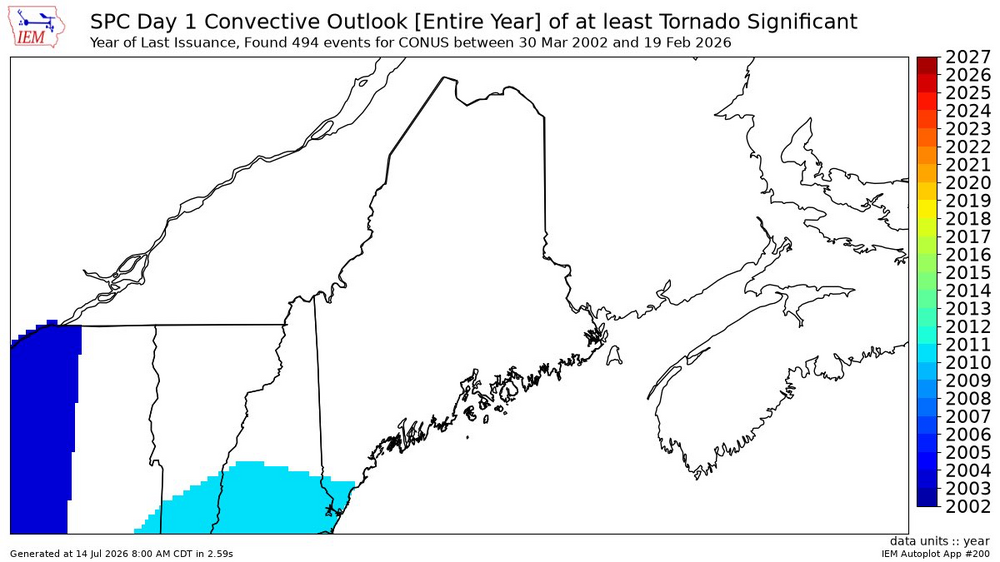
10% snuck into southern Maine on 6/6/10 and western Maine 6/23/24. But this is the first 10% risk in that area and by far the most widespread in the state. Also, there hasn't been a tornado in 6 years there.
-
Hopefully the moose are aware.
-
In theory, wildfire smoke could be a potential fly in the ointment since it reduces surface heating and limits instability to an extent. Though the question is how much would that mix down to the surface? In this case, it probably wouldn't and I think the surface dynamics are more than enough to overcome that.
-
The 10% hatching is not unprecedented in New England but has not occurred in that region before.
-
At long last, we finally have a NESIS rating. Category-4 and #5 all time (this is skewed since the methodology was changed around 2010)
-
80 Degrees to Ripping Snow: March 12th
Winter Wizard replied to SnowenOutThere's topic in Mid Atlantic
67 degrees on 11/11/95 -
80 Degrees to Ripping Snow: March 12th
Winter Wizard replied to SnowenOutThere's topic in Mid Atlantic
If you're curious, the highest temperature DCA ever recorded the day before accumulating snow prior to today was 74 degrees on 4/7/72. If DCA recorded more than a trace, it would obliterate the record. -
2026-2027 Record-breaking El Nino
Winter Wizard replied to Stormchaserchuck1's topic in Weather Forecasting and Discussion
It's a bit of a misconception that the PNA corresponds to a western US ridge/trough, the index actually corresponds to a much broader area per the CPC: PNA = Z*(15°N-25°N,180-140°W)-Z*(40°N-50°N,180-140°W) +Z*(45°N-60°N,125°W-105°W)-Z*(25°N-35°N,90°W-70°W) So in the case of December, the -PNA was mostly the result of strong troughing over western Canada, which in turn torched the Southwest US. Good reminder that the number isn't the be all, end all, you have to look at the bigger picture. -
All time worst bust for the Mid-Atlantic, imagine expecting 2-3 feet of snow from an all timer blizzard and instead getting at most a couple inches of slop. I was too young to remember this but I believe it was a case of a delayed transfer which shifted the heaviest snows way north into New England. I believe that trend was choreographed on some of the models, which makes me think that something of that magnitude *probably* won't happen again.
-
I am not sure when or why they decided to change the methodology but it really skews the rankings. I was surprised the 1/5-6/25 storm did not make the rankings considering it was a more impactful and wide reaching storm in the Ohio Valley and Mid-Atlantic than both early 2022 storms which snuck in as a Category-1. Or if those December 2022 storms could make it, why not 1/7/24 which brought a swath of 12"+ to the interior Northeast? Or 3/13/23? Anyway, the late January storm absolutely should make the rankings considering all of DC-BOS received over 6" of snow, and of course impacts spread well beyond that. My guess for that would be upper Category-3 or low end Category-4. For this blizzard, my guess is Category-3 in Boxing Day range.
-
I said this in the MA forum but figured I’d send it here too… I believe there is potential for 12"+ for coastal regions from Delaware to Mass, but I am honestly decently concerned about a potential rug pull I-95 N and W with this one. A storm as intense as this is likely to have a more consolidated precipitation shield which slams the coast, but can make it difficult for those bands to pivot farther inland. There is legitimate risk the phase does not occur until north of our latitude unless we see more digging upstream. The inverted trough is a wild card that could make up for it in spots though. Not to mention, surface temperatures are marginal with this one, and we could see a period of white rain cut down on totals. Hoping for the best, but I see clear warning signs and parallels to storms like January 2015, January 2018, January 2022, Boxing Day, etc.