Typhoon Tip
-
Posts
44,558 -
Joined
-
Last visited
Content Type
Profiles
Blogs
Forums
American Weather
Media Demo
Store
Gallery
Everything posted by Typhoon Tip
-
Dec (Edit: Jan1/..2 ) multi-faceted ptype mess potential...
Typhoon Tip replied to Typhoon Tip's topic in New England
I think the secondary is real.. It's in the Euro... It's in less than popular/conventional model types ...they're jumping into the ante, not away...and, it is theoretically sound - Just imho - But, it's not a like a 1978 Miller B extravaganza here ... we're talking about modest mid level support for it, and BL resistance just barely being enough ( hence the fine art) ...so, provided no industrial farts act like chaotic butterflies downstream of the Petro complex up there near Hamilton Canada ... etc etc.. -
Dec (Edit: Jan1/..2 ) multi-faceted ptype mess potential...
Typhoon Tip replied to Typhoon Tip's topic in New England
I'm not sure I would frankly ... 'course, I have the biggest ballz of all event posters because I have no where else to go but up in life...heh... No, it's not unusual for the models to "see" the BL resistance/inhibition to cyclonic/warm intrusion only nearing an event, with more coherency and as I just opined... even the Euro with -10C at BTV over to mid Maine at 850s a mere 24 to 30 hours prior to saturable isentropic lift ... ...is a lot of long words to suggest that a cold profile has precedence for materializing out of models when the cold is arriving, not rotting ... The nascence of this may have been and probably was because of BL resolution ... moved out too quickly - thing is... some of these late runs ... seemed to hint 12z yesterday, bust has been trending more pronounced, have inched the +PP position up N ... backward relative to the modeled total translation of the event. Subtle but crucially ... that adds more said BL resistance and plus with 850 mb turning ENE-E at your latitudes near Brian and up by you... that means it is moving parallel to an elevated topography and that will force that layers ascent and that's a positive feedback at keeping the lower levels critically colder... The Euro also shows now a better backside 850 mb temp collapse ( -2 to -3C ) on the backside of that escaping middling secondary, which means it may have snowed to ping to upsloping snow upon exit. It's a fine art ... yup. But, I could see this thing staying snow at least longer for somewhere between the PF-Brian-Dryslot-Phinny axis of evil -
Dec (Edit: Jan1/..2 ) multi-faceted ptype mess potential...
Typhoon Tip replied to Typhoon Tip's topic in New England
Probably also more of a symbolic thing ... but, I noticed growing up around this latitude of interior eastern SNE ...over the many, many ...many years ..that icing events between ct-vt/nh latitude seldom entry as ZR.. There is more typically 2 to 3 inches of matting then a switch ... while the shrubbery and wires and tree limbs slowly begin to 'glow' if by day, or prism urban lights by night, the surface of the snow may even accrete enough that you can walk on the lawn. We all have our moments that stick out along the time-lines of our lives. They're just curious little nuances along the way that ... you just don't really avail an opportunity to share, so they're kept along. I remember a calm dusk on an Xmas Eve a few years ago, up in Dunstable. My sis' in-laws own a huge spread of land. It was cold. 23 F calm wind, the steam vapors seemed to want to fall from the chin rather then rise. The trees were still moderately burdened from a glazing event some two days prior, and the pasture's 3" inches of snow sheened the fading light. I took the moment for a solo walk out there, and it really would have been a crime to Nature's handiwork in any other ambience than cryo ... Almost heartbreakingly beautiful ... and just then, 'goo-goo goo-goo' , excuse me if I don't know how to spell the sound of ice report from over a lake or pond surface ...but the field actually spoke to me in that same exact way. I had never experienced anything like that.. As a first it was sort of outre - but since, yeah it makes sense that can happen; the flat expanse of a field of Earth, lane over by a 3" of snow pack then 3/4" of ice cover, probably would exact the same phenomenon. I'm getting artsy and nostalgically ahead of my self here ..still, I also recall so many times, almost all ice events seem to be forecast by TWC and NWS and the local stations, as transitioning to 39 F rain, prior to my education and knowing exactly why they would eventually bust too anxious to erode the cold... Whenever I'd see that I grew to almost expect, ..even getting excited that ZR was prooobably going to last longer than those anticipations ... Until I grew up and started connecting ice with consequence of no life and no power and well..heh, icing lost much of its cache with me but that's another discussion - But this smacks as one of those sort of deals where the ice lingers a bit longer, particularly now that we are getting the better meso expression in these recent runs - -
Dec (Edit: Jan1/..2 ) multi-faceted ptype mess potential...
Typhoon Tip replied to Typhoon Tip's topic in New England
Yeah, that's what stuck out for me first thing this morning... the tendency for that secondary - so much for not having a meso low, huh. You know ...that did strike me a little dubious before. I mean a little voice in my mind was thinking it's almost impossible not to have one given the total synoptic structures in this. To lay in a -10C 850 mb air mass as far S as nearly the NH/MA border just a mere 24 hours prior to the warm front kissing NJ, yet the models were selling only a vague curved PP around the boundary like that...? mmm So..two cycles, boom boom and they go right thru the meso look into a higher latitude quasi Miller B ...interesting... The reason I did not mention that before is because I was too pre-occupied with the 500 mb going so far west. That's strange too frankly - the core of the vestigial S/stream wave that rides up the ridge is so far west, that it almost argues for sequencing through a new wave space to finally get it through our longitude... I just kept focusing on that facet ...wondering if/when the other shoe would fall and we'd just up and lose this whole thing and have it morph into something else entirely.. But, that's not happenin' either... As it were, this entire thing is ending up excessively sloped in the atmosphere... I think now this thread's merit/relevancy has been returned based on what I see... And, we shall see... I'm not like giddy 100% for a moderate ice "event" ..but, I think the light to mod impact mix mess (S-N) idea has been taken off the c-19 ventilator and is breathing under its own power again... -
Dec (Edit: Jan1/..2 ) multi-faceted ptype mess potential...
Typhoon Tip replied to Typhoon Tip's topic in New England
Heh looks like icing “event” tries another go at it .. this ICON run back situates the high up N just enough to impress this as running into a polar wall. This suggests within 50-70 S of the snow is mod IP/glazing -
Dec (Edit: Jan1/..2 ) multi-faceted ptype mess potential...
Typhoon Tip replied to Typhoon Tip's topic in New England
Acknowledge runs coming in a degree or two colder over last couple of cycles… But this was still never going to be about snow in Southern New England and probably not even up to Manchester New Hampshire just keep that in mind - mix/ice. But typically these things do start out with aggregates for at least a small while I’ve seen IP columns be 10,000 feet deep -
Jan 8th just needs a southern stream injection and look out! ... as is, starved but that's an intriguing n/stream mechanical presence/handling there on this v16 run
-
Where is this warming event being observed - what source. How is it being defined.
-
heh...devil's in the details on those ending Euro frames.. yuck -... It's raining in NF on a long shore easterly beach eroder flow, with a low pinned under that block, ... in January Meanwhile, late March 850 mb thermal tapestry for every S of 50 N everywhere...
-
That GGEM run actually has three distinct Pac impulse rippling along in succession right out to the end of the run. Any one of those could do it ... It's an interesting look by the Euro, GGEM .. .the flow is 'relaxed' in the sense of height gradient - so the velocity saturation is alleviating for a change! Yet, the wave spaces them selves remain in a rapid progression.. It's an odd behavior.. That Euro block looks dubious up there... It almost looks like a 'latent heat landfill' ... The whole region between NF and England is like the land the atmospheric patternization forgot... So, It's formulating a soft gradient NAO black out of western Atlantic cyclongen exhaust.. mm okay... think about that. you go 564 to 570 dm height node with only three standard isohypses surrounding it before we find any kind of nadir ...that's a little dubious for a core winter month. It just seems everything is 'what the f' these days - man
-
You know ... if you glide your mouse over the 20 some odd members of the GEFs ... you can ' kind of tell ' how they want to build the actual Z depth height structure...but for some reason, most ( but not all..) settle for 'COL' ( or absence of pattern at all ..) ... That gives the allusion if you will, of a 'placeholder' ? Kind of like on stand-by in case they need to build one lol... I don't know...this last 10 years of management up there over that surface area of the Globe is intriguingly ill-performed and problematic if you ask me. The Pacific should be where the research is focused... sure, as the primary cold and S/W ejecta loading pattern(s) obviously begin there... But, when the flow is fast between Hawai'i and California ..then slows nearing the OV at mid latitudes over N/A ...I have come to find that precedes the N. Atlantic ridging - not sure if that's also useful up in the NAO domain ( D. Str. and Greenland and so forth...) but I bet there's a larger wave mechanical/Rosby argument for that. hm ...and once it is there.. .that "backwardly" fold the flow ...blah blah. Anyway, the flow has been fast - gee ya tink... - along said axis so ...
-
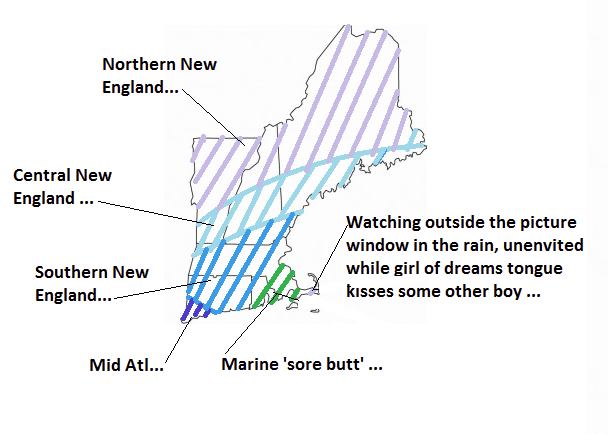
I understand what we are after with these layuts... but using these geodetic boundary -type maps to formulate some sort of weather-related idea of "central" verse "northeast" has always been annoying - For the purpose of what we do in here in the gawk-support group, ranging to professionally disciplined endeavors at NCEP... There is no way NW Middlesex is Northeast, when S of there is Central ? ya know ... We should create a map that's sort of climo around ptype tendencies, for snow enthusiasts... maybe have it overlaid with mean 32 F dashed line(s) where needed... It would probably be arced...
-
Dec (Edit: Jan1/..2 ) multi-faceted ptype mess potential...
Typhoon Tip replied to Typhoon Tip's topic in New England
Yeah... if no one minds... I'd like to swap the title to be Jan1/2 ...this has morphed in timing to be smeared in favor of NYD and over night into Saturday morning, so we should reflect that - -
Probably should be noted - or not ... that the Euro really had 'dynamic evacuation' as it's real only limitation to a NJ model low scenario for that Jan 4 ... we spoke about this in the other NYD coverage ... There are GEF memberships carrying on with that - just sayn' ... These are all 'tweener' system really ... None of them are really connected to a modality ... They like the "weather-life" version of John Lennon's famous aphorism, "...Life is what happens while you're busy making plans"
-
Maybe I'm too generalist ...but that really just looks cut and dry like +AO winters tend to suck - that's our canvas... Begs the question, do -AO winter unsuck ? I suspect if run the at or above snow years thru whatever algorithm/GUI provided ...expanded to include Chi- town and Denver back to Columbus OH and ROA -PHL-NYC-BOS-PWM... the whole circuit, prooooobably the layout looks polar to that rendition .. .if not diametrically so, still considerably -
-
You know... so long as this "pattern" ( ..mockery) is what it is, I hope that D 10 operational Euro depiction of COL atmosphere under ridging at +4 C at 850 goes ahead and verifies... ( as interesting aside, is a 'lack' of a pattern a pattern in itself ?? ...that extended Euro has 0 identifiable R-wave ownership - not sure I have ever seen a pure nebularity in January before... another curious little example of how GW doesn't appeal to anyone because it is like hypertension: silent stalker ) Yeah yeah...here comes the pettiness to remind of low sun-angle this, and short day length that... But, excluding those bargaining for 'avoidance' tactics for the moment, with no snow on the ground and a multi-day rotted or even absent polar air mass, that's prooooobably a pretty dam delicious 56 F high ... In light winds, even the tepid suns of January will be inspirational - for those of us not in fact saddled in life with -(S.A.D.) variant disorders ...hahaha... Just kidding but it is actually a real, recognized affliction ...it's just that it affects a smaller percentage of people... It's literally called "negative SAD" ...and those that have this feel a similar experience in spring and summer that the majority experiences in autumn and winter. Anyway, I can swap out my passions on a dime and just knowing how nice that weather is, it'll be nice .. What I really, reeeeeally pray to the remorseless god for ( that's code for 'good luck getting this prayer answered in kind') is that we don't sans winter in lieu of flurries on Memorial day.. .I think this last year was four consecutive stolen springs... I mean, yeah ...spring warm in New England is a fool's expectation anyway, of course.. But snowing in May like it's 'normalcy' is beyond the pail. Made horrifically worse when it's 70 + in February long enough to fatten buds
-
Dec (Edit: Jan1/..2 ) multi-faceted ptype mess potential...
Typhoon Tip replied to Typhoon Tip's topic in New England
This was always predicated on the idea of lower polar wedging and removing that, we'd be skunked - well... it's 2020 !! The 'never really did' - fine... The thread was 'light to moderate' ..others like to spin things up perhaps. I don't know who said what.. .but, these bolded pieces are completely fair to be honest. There were in fact better indications of those now missing features you mention - even in the early Euro runs, semblances of meso circulations.. better delays of the high. that's the way it looked like 4 days back... heh. Anyway, it was a worth journey .. It started evolving toward less after the fact. As it stands now ... no argument moving forward. -
Dec (Edit: Jan1/..2 ) multi-faceted ptype mess potential...
Typhoon Tip replied to Typhoon Tip's topic in New England
Yeah ... my take on this this morning is that the entire banded region of impact specifics have shifted some 100 mi N of when this thread began... But, there's probably going to be some subjective and/or imby-ism ... Most places will see a flake or two.. hear some pings... and may glaze. It'll be a matter of how long one spends in along that spectrum - less S, ...longer N.. I just have difficulty believing the Euro will be "that" wrong with the general layout ... not at this range, and the above is still satisfied in a Euro evolution. It can bust - sure... But, we have no crystal ball and the gamble of least regret, it is just too inconsistent with the Euro's verification to see that happening so we wait so that cacklers can claim the Euro is never as good as used to be in the off chance that it proves not to actually be a conduit for the thoughts of god - ... So, bearing that in mind - and in no small part ( for me ..), the 06z GFS took a pretty significant step toward the Euro's timing/placement re the high up up N of Maine ... I really see this as a quicker transition - save for the valleys ... which may hold out a bit longer for cold puddling. You folks up your way will concomitantly take longer to move through your rendition of this ultimately 'scrape-by' event to 'feel' like this winter isn't really fool's errand - lol -
Dec (Edit: Jan1/..2 ) multi-faceted ptype mess potential...
Typhoon Tip replied to Typhoon Tip's topic in New England
It’s technically still 2020 lol -
Dec (Edit: Jan1/..2 ) multi-faceted ptype mess potential...
Typhoon Tip replied to Typhoon Tip's topic in New England
Cold air always wins when tuck jets are draining off a latitude top heavy PP ... don’t forget that and modulate with that in mind. 00z GFS hesitates +PP departure around 84-96 hrs. Hard to say if that’s just modeling noise but this is a very sensitive situation and moving that high backward relative to the modeling progression even a little bit can have significant sensible impacts when we’re dealing with whether it’s a 35° cold rain or 31.4 glazing in the Interior Southern New England. In short .. new run does little to increase confidence in quicker warming onset Also it is true that the ballast of this event appears to be NYD presently but staying the title in the off chance the lead boundary situates and thus initiate modest isen. lift sooner. -
Dec (Edit: Jan1/..2 ) multi-faceted ptype mess potential...
Typhoon Tip replied to Typhoon Tip's topic in New England
And honestly ... as a more formal update to the progress of all this... It's changed since this thread started - very glad I left matters at 50% confidence/coverage for southern areas ... I'm not certain at this point either way, if the GFS isn't just attempting to move toward the Euro with the timing/placement of crucial +PP up N and moving E of Maine ...without that, we are sunk for substantive impact... And this will transition rather quickly in that correction. Getting into a ice/mix S and mix snow N was always predicated on that key factor, ...so of course, we then summarily fiddling with f'ing that part of it right up good and proper -par for the course. But we'll see... My experience tho is that once these polar highs start accelerating in the guidance they don't tend to move back west in future cycles ... The entire morphology aloft is differentiating toward something different too... The southern aspect has not gone so far west it is hard to figure what kind of cyclonic model it really fits into. It's almost nothing - or unique... It's merging over SD with something of new Pac arrival ( this fast flow is absolutely killing our winter ... miracle we had that snow storm a couple weeks back)... and if that continues to go that direction ...we could conceivable wash out the cyclone from the charts end up with a fropa while the Rockies build the cap depths. ... I don't think so but there are other visualization certainly plausible... Like to see the GFS back off the west track with S/stream... and see the Euro slow the exit of the lead polar wedging... -
I posted too long for anyone to read about the AO last hour or whenever that was ... but, in shorter I was dancing around the notion that a strong and deeply D(suppressing)/DT AO may lead the subordinate WPO-EPO and NAO responses... We'll see. But the CPC seems to have corrected the aspect I was bitching about the other day, and with curves seemingly back on line now as of last night... blah blah. But upon doing so, the concerted negative AO is whopper ... It's hard to believe that could verify that way and have the operational runs keep doing what they are doing - something has to give here because the AO is still a part of the Earth's total atmosphere and it shared domain space (geometrically) with those latter three.
-
Dec (Edit: Jan1/..2 ) multi-faceted ptype mess potential...
Typhoon Tip replied to Typhoon Tip's topic in New England
Ice ?