GaWx
-
Posts
18,246 -
Joined
Content Type
Profiles
Blogs
Forums
American Weather
Media Demo
Store
Gallery
Everything posted by GaWx
-
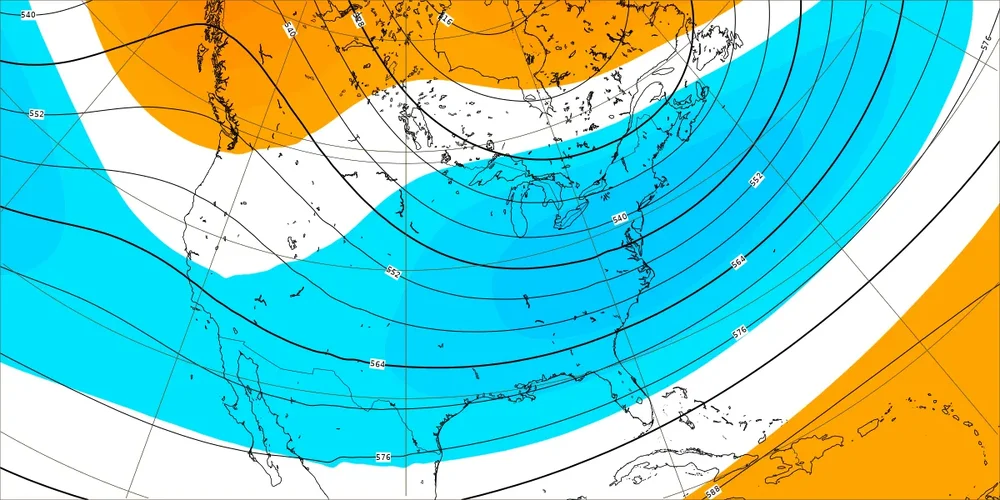
The new extended GEFS (0Z 1/21) is still another ensemble run that looks to me to be loaded with potential, especially for 2/15-23. There are many members with Arctic surface highs with centers that later cross near or just S of the Ohio Valley while sfc lows cross the GOM with plentiful moisture as can be seen here, all consistent with a split flow of +PNA/strong subtropical jet (thank you El Niño) accompanied by a solid -AO and developing -NAO: The Euro Weeklies, extended GEFS, and CFS ensemble keep on giving me lots of hope for the period 3-5 weeks from now. They’re not at all stopping as we slowly get closer. If these keep up, we’ll start seeing the start of this favorable period getting into the 15-16 day ensembles around this weekend. *Corrected for typo to 3-5 weeks from now
-
These Euro Weekly maps of today are subtly moving up the timeframe. The 3 main extended ensembles as a whole had been suggesting a little bit later in Feb as the start of the best shot but todays Euro is saying that near or just before Feb 15th could end up being the start of good opportunities.
-
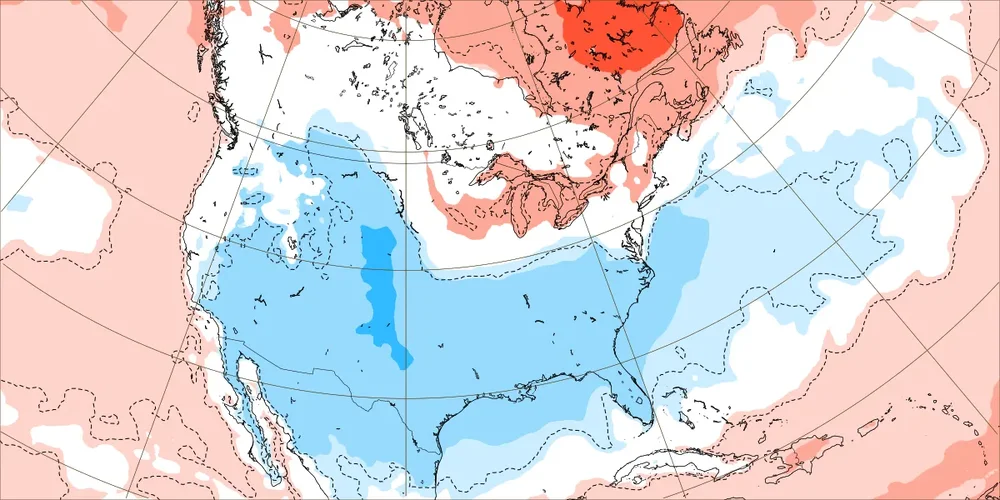
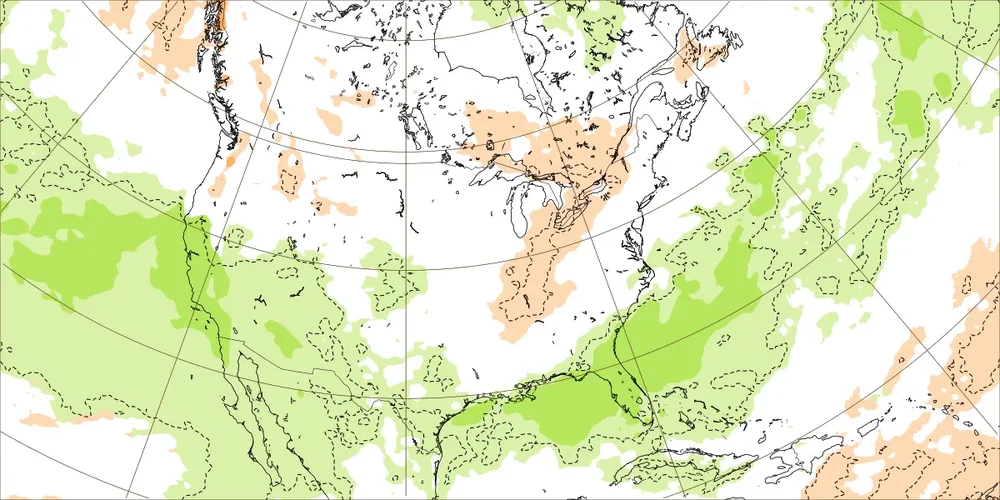
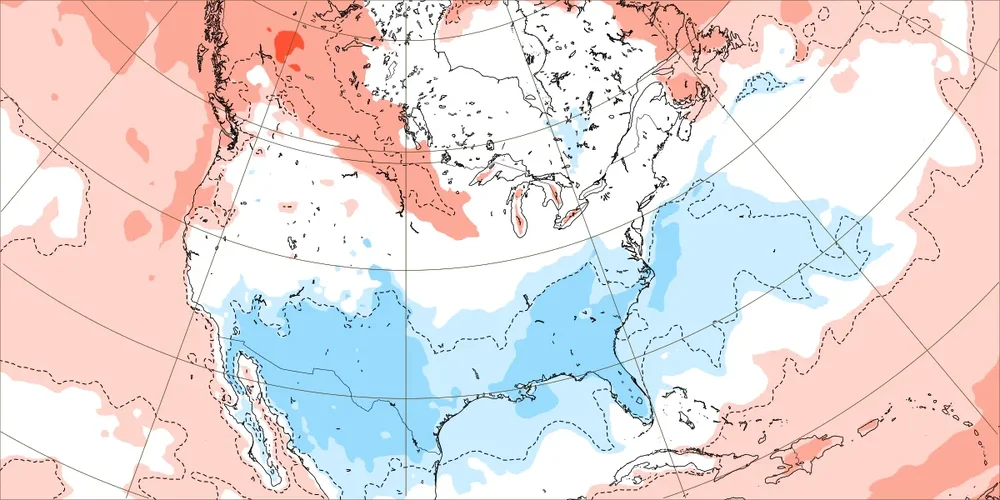
New Euro Weeklies for Feb 12-19: Does this look at all like winter is over in the SE? Not to me unless we’re playing the game of opposites. H5 hts are lowest of any run so far in SE and also suggests split flow with both a +PNA and BN hts from S CA/Baja eastward typically associated with moist subtropical jet: Easily both the strongest and also most widespread BN temperature signal yet by far and it has been getting progressively colder: Check out the wet subtropical flow from S CA/Baja into SW US/MX and then over N GOM/Gulf coast/S GA/S SC to NC coast and offshore SE US with all of the SE near to wetter than normal: This combo of maps is suggesting an El Niño induced GOM Miller A mixing with widespread cold that would be a near perfect setup for a widespread major SE winter storm near the most favorable climo for it (moderate or stronger Nino in mid Feb). I couldn’t have drawn week 4 maps any better than these to suggest such potential. Now whether or not these maps are matching anything likely even close to what will happen is probably something worth discussing as they are after all out at week 4. But I’d much rather see them than not! And the same ideas keep showing up starting around this period.
-
Only 41.3 at my place probably near the high of the day at 3:50PM. Highest at most likely no more than ~42. Easily the coldest high of the winter to date.
-
You’re welcome. If you mean snowiest in the US as a whole, I don’t know. How would that be determined? I imagine it would be subjective. Also, keep in mind the changing US boundaries. And if you wanted to go back before 1776, that would be interesting but of course there was no US yet and the account locations would be more limited the further back one goes. If I were you, I’d try to find and/or buy the two Ludlum books, which go back to 1604!
-
I don’t know about NYC, but I have seen accounts (as opposed to official records) of snowfall back that far and even much earlier (back into the 1700s) at both Savannah and Charleston. For example, the heaviest snow at Savannah by far, 18”, occurred late Jan 9 through early Jan 11, 1800! Charleston got 10” and even the GA/NE FL border near St. Mary’s got 5”! I’m almost sure that I didn’t learn about this incredible storm til after 2000. Without the internet, I might still not know about it.@donsutherland1posted about this truly amazing event before and he may have been how I first found out about it. It is in one of David Ludlum’s great US winter wx history books that Don cited. I don’t recall whether @SACRUShas posted about it. Edit: yes, @SACRUSdid in this post and very likely others: Edit: Look for David Ludlum’s two fantastic US winter history books at the library. I found them at my local public library. Here’s one you can buy, volume 2: https://www.amazon.com/American-Winters-1821-1870-History-Weather/dp/0933876246 Volume 1: https://www.google.com/books/edition/Early_American_Winters_1604_1820/6iNRAAAAMAAJ?hl=en
-
1. Yes, Jacksonville, FL, had a trace of SN the day before. Their low on 1/21/1985 was an incredible 7, which broke the previous coldest on record low of 10 (set 2/13/1899 during that historic Arctic outbreak and snowfall). 2. Savannah with NO snow had its all-time official record low of 3 on 1/21/1985. That smashed its previous official record of 8 set 2/13/1899, which was just after 2” of SN fell. However, before official records started, downtown hit 0 and downtown Charleston (not the well inland airport, where CHS records are kept) hit 2 during the amazing historic Arctic outbreak of Feb of 1835 on Feb 8th. Jacksonville dropped to 8. 3. Macon, GA, had a low of -6 on 1/21/1985, which followed a T of SN the day before. 4. Atlanta had a low of -8 on 1/21/1985 (which I experienced) after 0.2” of SN fell the day before. That just missed the alltime record of -9, which was set on 2/13/1899 just after ~6.5” of snow fell.
-
Jan/Early Feb Medium/Long Range Discussion Part 3
GaWx replied to WinterWxLuvr's topic in Mid Atlantic
After the shortlived +PNA near January 31, the transition back to a supposed longer lasting +PNA starts ~Feb 10-12 on the extended ensemble model means (EPS, GEFS, CFS). Crossing my fingers that that holds as it is still 3+ weeks out, a near eternity as regards the abilities of the models. These same extended ensemble means have then been maintaining a +PNA on most days through the end of their runs (though the 1/20 GEFS run’s mean did relax it somewhat late in Feb). -
My thermometer wasn’t out then, but the more inland KSAV (more often than not slightly colder than me) was 27 for Wednesday’s low. I was probably also in the upper 20s. Their Thursday low was 25. Today’s low there through 7 AM was 23, coldest day yet. See the edit for clarification in my prior post. As of 7:13AM, I have 25.0 at my house, which is likely at about my coldest of the winter so far. (I say “likely” since I have to look at it at the time because it doesn’t show the minimum unfortunately.) Update: I rechecked and it is 25.0 also as of 7:50AM.
-
But don’t forget that ERSST, what the official ONI calculations are based on, averaged 0.08 warmer than OISST Aug-Dec. That’s why I had been saying til recently that a super was still likely. Now it is probably near 50-50 because of the rapid drop over the last 8 days. Down to the wire! It won’t matter so much as far as the US wx is concerned. This is more about the contest, bragging rights, fun, etc.
-
Yep, being near the line is the big factor. The latest change is because the sharp drop of 0.37 over just the last 8 days has suddenly opened things up. I just report on this and other things as I see it regardless of any predictions I’ve made. My last “official” prediction was for a super made way back on 9/21/23 in the contest thread: So, my prediction of a super is in danger now. And I can forget about a +2.10. A super at all, though still a good chance, has probably dropped to near 50-50. Also my chance at being the closest and thus getting a free cruise to see the hallowed Nino 3.4 waters is rapidly slipping away. On a brighter note, you may be going there! I’m enjoying the drama as it’s like a close football game with twists and turns.@snowman19probably sweating this out now so much that he may no longer be a . Since he only likes to report news that supports what he wants to see, he’s been (not at all surprisingly) quieter the last couple of days on the SST front. Edit: because he just posted a “confused” reaction, I just checked and see that @snowman19 actually hasn’t made a Nino 3.4 SST post in over a week, which was at the time of the last OISST peak near +2.00.
-
OISST is still dropping meaning an ONI based super-strong El Niño is becoming less and less likely. I very roughly estimate that if the next 11 days end up averaging +1.65 or lower, there’s a good shot that there would not be a super peak based on the unrounded NDJ ONI.
-
Here at 12:35AM it is already below freezing with a 31.5. So, a hard freeze tonight likely heading down into the middle 20s. I’m pretty sure this is the coldest of the winter so far at this hour. Edit: Clarification: coldest of winter for any day at 12:35AM is what I meant. I didn’t state that clearly.
-
Jan/Early Feb Medium/Long Range Discussion Part 3
GaWx replied to WinterWxLuvr's topic in Mid Atlantic
Great observation about Dec NAO! I calculated the average of the dailies and got only +0.60 vs the monthly table’s +1.94. But this big discrepancy is not too surprising because I noticed a while back that the monthlies don’t jibe with the dailies in that the absolute value of each monthly often comes out 2+ times as high as the the absolute value of the average of the dailies. It is similar with the PNA, especially when it is positive. But not with the AO. I have no idea why the monthly vs average daily NAO/PNA are this way. But at least the relationship is pretty consistent from month to month allowing for halfway decent predictability of the monthlies from the average dailies. -
With the MJO being difficult for the models to predict 3-6 weeks out, it’s almost anyone’s guess/way out in noise range. Even just 2 weeks out is often a challenge. The bc CFS (not a good MJO model) and 1/19 Euro Weeklies mean are saying it gets stuck within the top of the circle. But that’s merely the mean of members being all over the place. Being that I like to see it inside, near, or just outside the circle (especially LEFT side), I hope their means happen to verify well though. Could they be mainly in 8-1-2? It’s certainly possible. I just prefer that they be low amp. *Corrected typo…left not right side
-
To go along with the post above, here are the 18 3”+ RDU snow and/or sleet storms during moderate or stronger El Niños since 1889 that cover Feb 10th+: 2/21/1889: 10.0” 2/10-11/1912: 6.5” 3/3-4/1912: 3.0” 3/6/1912: 3.0” *2/13/1914: 3.8” *2/26/1914: 7.0” *3/22/1914: 3.0” *3/30-1/1915: 3.7” *4/3/1915: 10.0” 3/13/1926: 4.2” 3/24/1940: 7.0” *2/26/1952: 3.5” 2/15/1958: 3.0” 3/1/1969: 9.1” 2/10/1973: 4.5” *3/24/1983: 7.3” 2/16-17/1987: 5.0” 2/27/1987: 5.2” * No Dec/Jan measurable SN Dates: 2/10, 2/10-1, 2/13, 2/15, 2/16-7, 2/21, 2/26, 2/26, 2/27, 3/1, 3/3-4, 3/6, 3/13, 3/22, 3/24, 3/24, 3/30-1, 4/3 -9 during 2/10 through 2/27 -8 during 3/1 through 3/30-1 -1 on 4/3
-
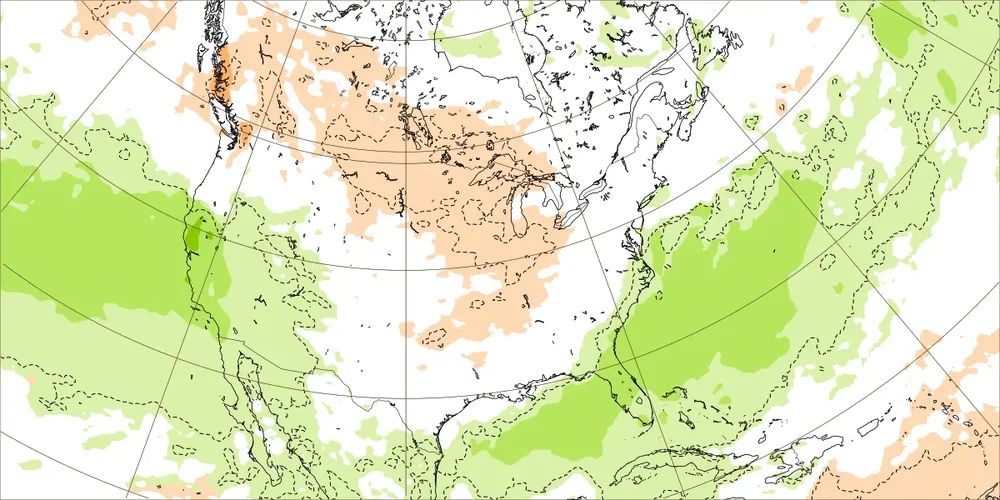
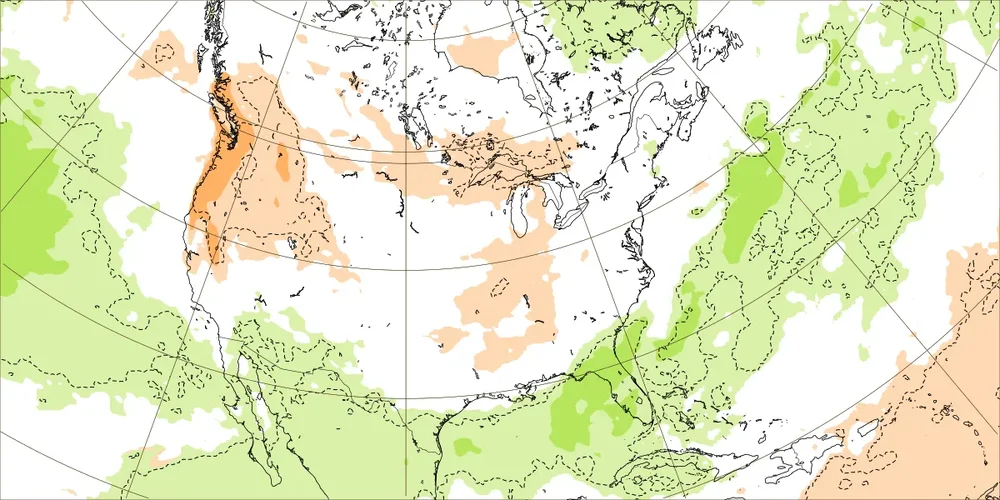
The brand new 12 run CFS ens, similar to the new Weeklies, looks absolutely beautiful for the 3 weeks Feb 10th-Mar 2, especially Feb 17th-Mar 2, prime time climo for moderate+ Nino’s! So, once again the 3 main extended ensembles are in agreement on calling for about as favorable a pattern as one would want to see looking so far out. They’re still subtly suggesting a good chance for at least one Miller A/GOM low thanks to a characteristic El Niño moist split flow at 500 mb. These models are far from crystal balls and thus could end up being way off, but we like to hunt down potential well ahead of time in these forecast threads and I’d much rather see them than not! Also, keep in mind the nature of ensemble runs (these are the equivalent of 48 member runs (12 runs x 4 members)) tends to reduce the intensity of anomalies. Here are some of the latest 12 run CFS ens maps for the 2nd and 3rd weeks of the aforementioned 3 week period. Feb 17-24: chilly along with wet most of SE Feb 24-Mar 2: similar
-
I can’t help but love what the new Weeklies are showing for especially 2/12-26, which is similar to recent runs but even colder and wetter. There’s a clear pattern change to a +PNA/-AO/-NAO induced chilly SE along with near to AN precip. This happens to be during a prime time period for Nino winter storm climo. I mean what more can one ask for looking 3-5 weeks out. Man I hope this ends up verifying closely because the SE would be facing the potential of a memorable mid to late Feb (possibly going into early Mar). Week of 2/12-19: hint of Deep South Miller A low: Week of 2/19-26: similar
-
Based on the timing of recent extended models (besides the likely cool to cold 1/30-2/1), I’m looking to see the +PNA ridge start to repump ~2/12-3 along with the possible return of the -AO. Hopefully that will hold up. That would start showing up at the end of the 16 day GEFS/GEPS on ~the 1/27-8 runs and on the 1/28-9 EPS. I found this elsewhere for way out on 3/4 on yesterday’s weeklies fwiw:
-
1. 1/30-2/1 will be interesting to follow as it is on the 6Z gfs quite cold (though not as cold as current), but it is colder than any other recent run and is an outlier vs GEFS. Also, it is mainly dry other than mtn upslope and far NE NC/E VA as the cold mainly follows the precip. Regardless, this period offers a good chance for a break in the middle of the mild pattern with a cooldown to at least normal. 2. 1/28 on GEFS shows what could be a +2 NAO, which would be the highest for any day in met winter in over 8 years.
-
I'll be quite surprised if there isn't at least one storm to track mid-Feb on. I have a feeling that the mid Feb MJO and beyond position will be pretty crucial though it is just one factor even if often a major one. Consider that for the 2nd winter in a row that intense SE cold is occurring during strong "warm" phases thanks to high latitude blocking.
-
Most indications suggest that the next ~3.5 weeks will be mainly burned. That’s what we have to work with as it looks now. So, I’ve accepted that as likely and have already moved on instead of dwelling on it. Thus, now the hope is for what happens afterward. Regardless of what will end up happening prior to ~Feb 12th, the potential from that point on remains as high as ever based on a combo of the extended models and analogs. Arguably, it is even higher for mid-Feb onward as snowless Dec/Jan analogs are hinting at. All it takes is one big snow and the season could easily be AN for most in the SE. Thus a mid-Feb pattern change could easily still be early enough to make it an AN snow winter in much of the SE.
-
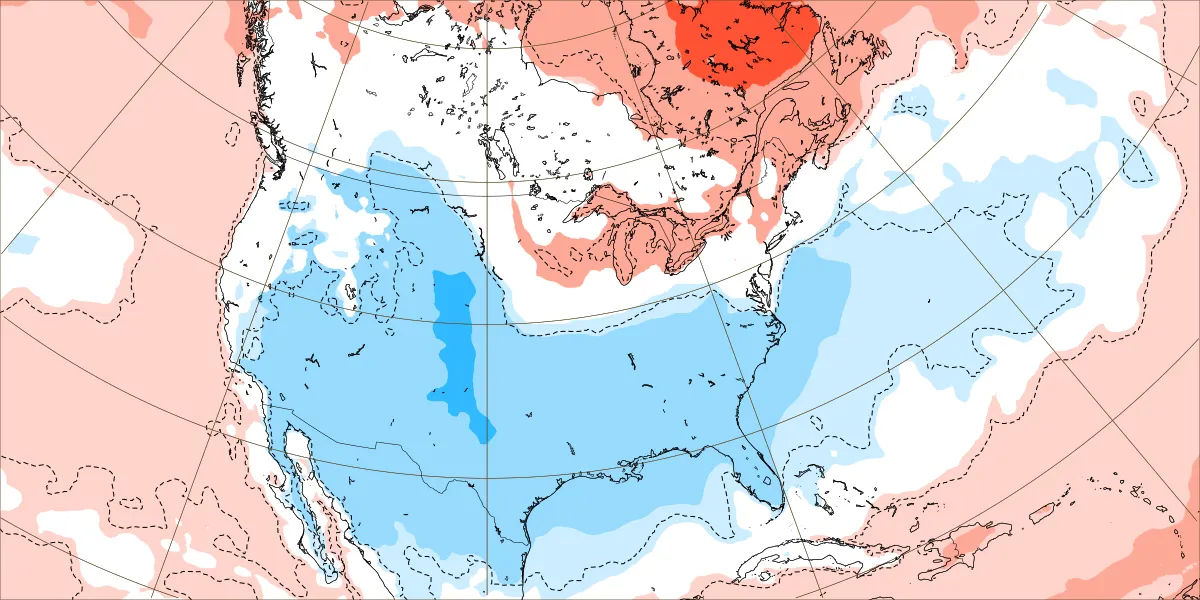
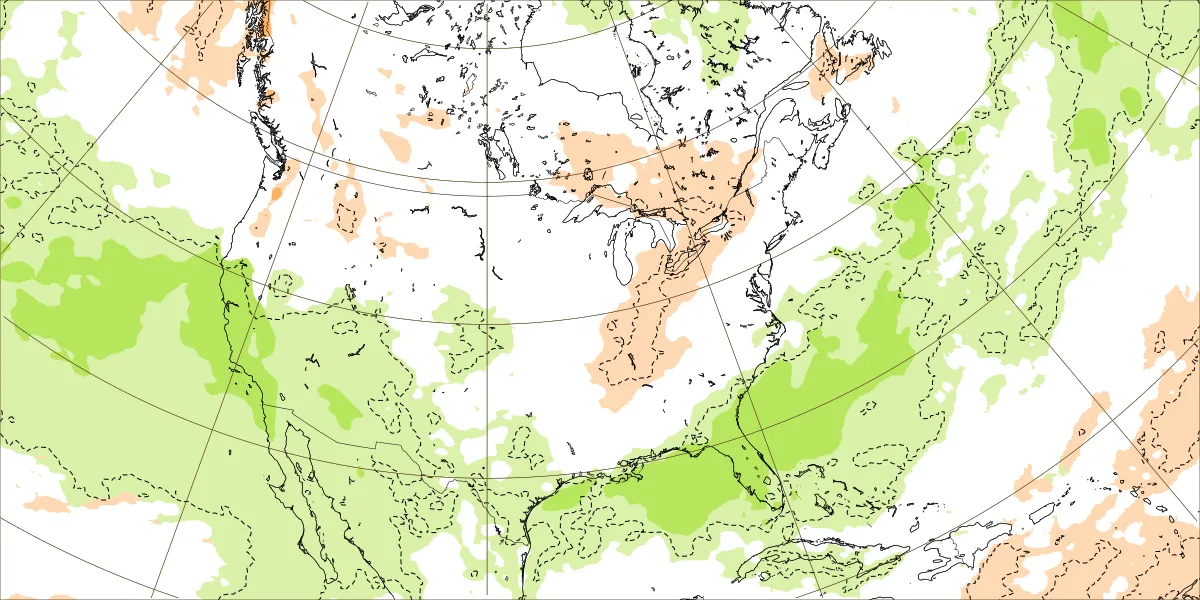
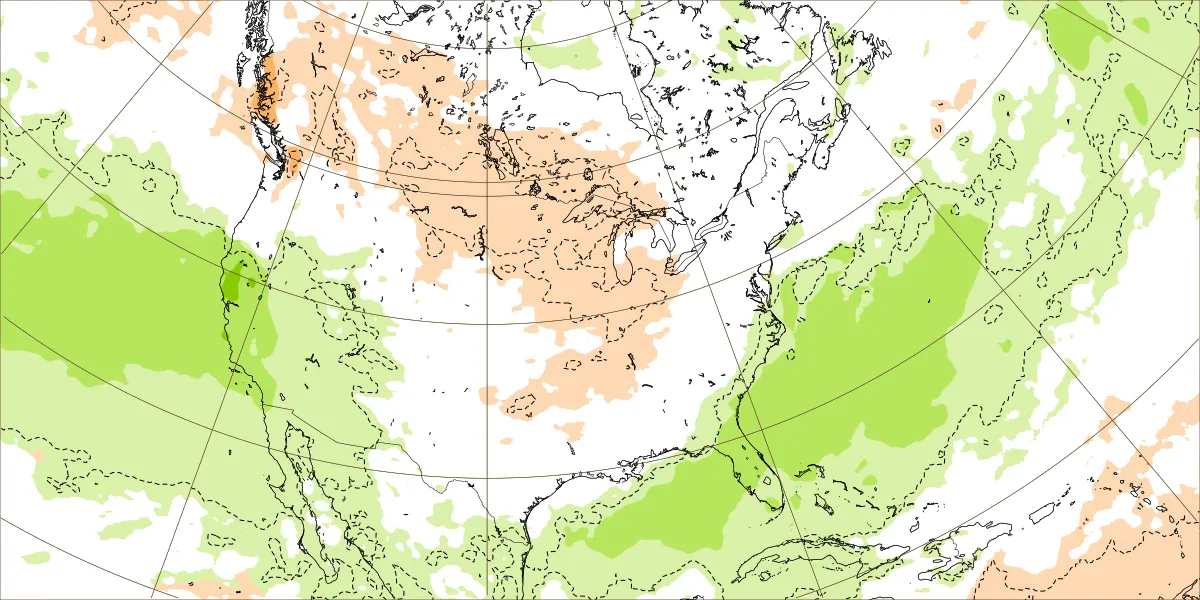
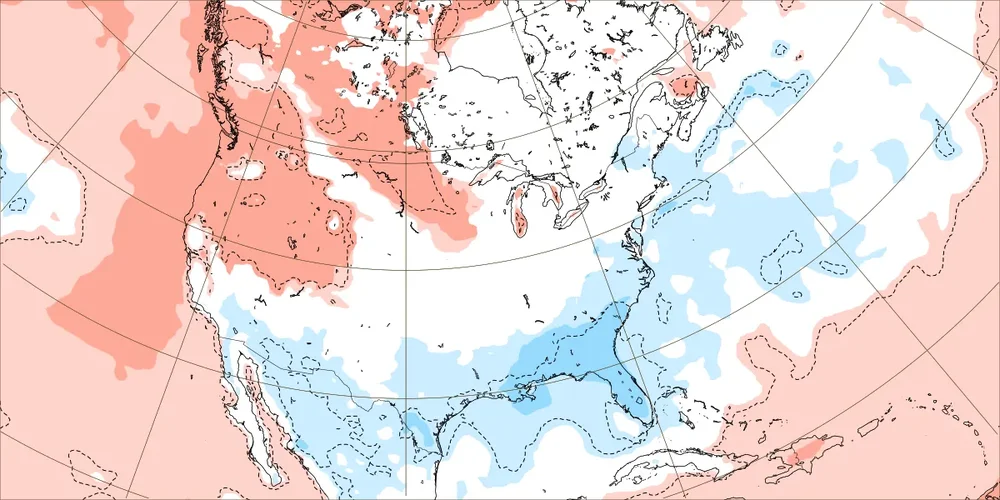
When I click on the link, it won’t let me see the actual tweet. It instead goes to a page asking me to sign-in. But I don’t have an account. I don’t get it because I normally can view a linked tweet despite not having an account. Are you able to embed this tweet in your post? The extended 1/18 GEFS fwiw agrees with the average of the last 12 CFS ensemble runs in having a pattern change to significantly colder in the SE that first occurs ~2/12-15 and extends through late Feb due to a combo of a solid +PNA/Aleutian low (SE 500 mb hts go BN) and -AO. SE precip anomalies hint at a mid or late Feb GOM low, with a nice ST jet/split flow likely helped by El Niño. Yesterday’s Euro Weeklies also agree. But before mid-Feb, all 3 agree on mild to warm dominating late Jan through early Feb. Thus the end of the two week models might continue to look ugly for another ~10 days. So, I’m hoping for and leaning toward an abrupt pattern change near mid-Feb that is similar to some other Nino winters that I showed yesterday (1914, 1919, 1924, 1952). We’ll see whether or not 2024 ends up to be similar. I’m optimistic but none of us have a crystal ball. And keep in mind that in the SE it often only takes one big storm to make it a snowy winter.
-
But with it being a strong El Niño, the equivalent of Tom Brady is fortunately in at QB!
-
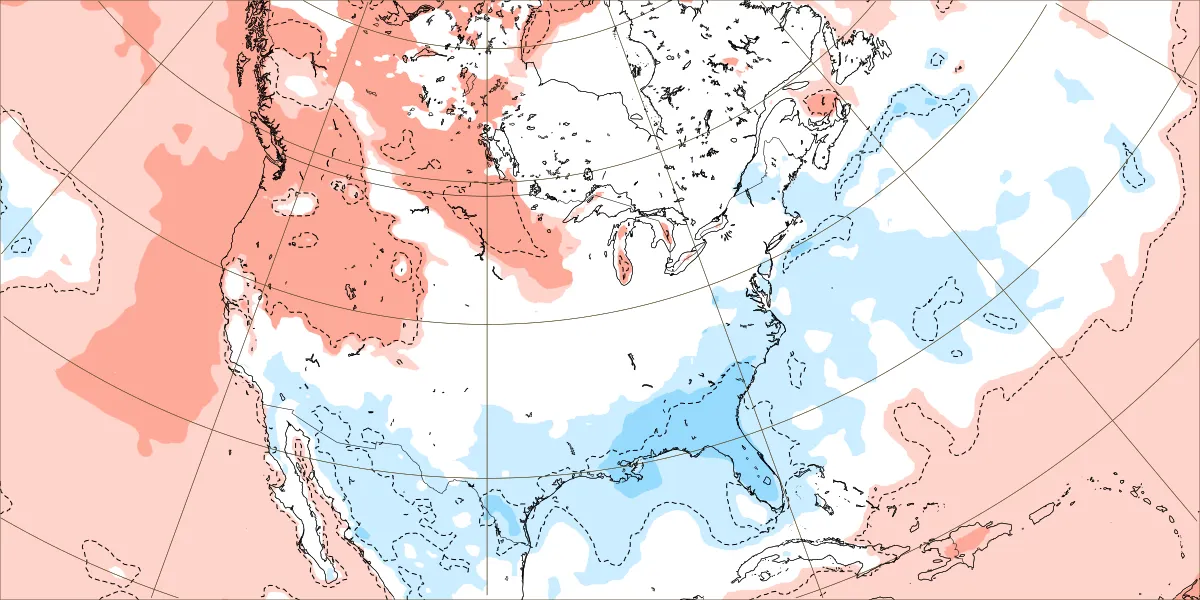
Fwiw hot off the press this is the average of the last 12 CFS 4 member ens runs for 2/22-2/29: this follows a mainly pretty mild first half of Feb; then sustained significantly colder first comes in near midmonth and intensifies; strong +PNA and -AO 2nd half of Feb; also a weak -NAO