

GaWx
-
Posts
18,793 -
Joined
Content Type
Profiles
Blogs
Forums
American Weather
Media Demo
Store
Gallery
Everything posted by GaWx
-
I’ll be watching. But despite what the 12Z GFS and 5 of the GEFS members show, I’m not worried about it at this point. The consensus of the 12Z GFS, Euro, UKMET (see below) has a TC somewhere along the SE coast late next week. History of TC landfalls from the E or SE to SE US May-June: - 1873 minimal TS GA/FL border 6/2 - 1909 low end TS Ft. Lauderdale 6/28 - 1972: minimal STS Alpha Brunswick 5/27 - 1984 TD 1 St. Augustine 6/13 https://en.m.wikipedia.org/w/index.php?title=1984_Atlantic_hurricane_season&diffonly=true#/media/File%3A1-L_1984_track.png - 2012 high end TS Beryl Jacksonville 5/28 - 2016: TD Bonnie Isle of Palms, SC 5/29 -2020 50 mph TS Bertha Isle of Palms, SC 5/27 *Edit I somehow missed this one: -2021: 40 mph TS Danny Pritchard’s Island 6/28 ———————————- 12Z UKMET has TD at 150 just off GA that moves NNE to Tybee/lower SC GLOBAL MODEL DATA TIME 1200UTC 15.06.2024 NEW TROPICAL CYCLONE FORECAST TO DEVELOP AFTER 150 HOURS FORECAST POSITION AT T+150 : 31.1N 81.1W LEAD CENTRAL MAXIMUM WIND VERIFYING TIME TIME POSITION PRESSURE (MB) SPEED (KNOTS) -------------- ---- -------- ------------- ------------- 0000UTC 22.06.2024 156 31.9N 80.9W 1012 24 1200UTC 22.06.2024 168 33.8N 80.3W 1014 25
-
12Z UKMET is similar with 90L and with nothing in the GOM TCGwise fwiw.
-
More on the accelerated SLR along the SE US: “The rate of sea level rise (SLR) along the Southeast Coast of the U.S. increased significantly after 2010. While anthropogenic radiative forcing causes an acceleration of global mean SLR, regional changes in the rate of SLR are strongly influenced by internal variability. Here we use observations and climate models to show that the rapid increase in the rate of SLR along the U.S. Southeast Coast after 2010 is due in part to multidecadal buoyancy-driven Atlantic meridional overturning circulation (AMOC) variations, along with heat transport convergence from wind-driven ocean circulation changes. We show that an initialized decadal prediction system can provide skillful regional SLR predictions induced by AMOC variations 5 years in advance, while wind-driven sea level variations are predictable 2 years in advance. Our results suggest that the rate of coastal SLR and its associated flooding risk along the U.S. southeastern seaboard are potentially predictable on multiyear timescales.” https://www.nature.com/articles/s41612-024-00670-w https://www.nature.com/articles/s41612-024-00670-w/figures/1
-
0Z UKMET has nothing (TCwise) in the Gulf but still has the one offshore the E coast though it is weaker than what the 12Z had: GLOBAL MODEL DATA TIME 0000UTC 14.06.2024 NEW TROPICAL CYCLONE FORECAST TO DEVELOP AFTER 30 HOURS FORECAST POSITION AT T+ 30 : 36.5N 70.5W LEAD CENTRAL MAXIMUM WIND VERIFYING TIME TIME POSITION PRESSURE (MB) SPEED (KNOTS) -------------- ---- -------- ------------- ------------- 1200UTC 15.06.2024 36 37.8N 68.9W 1007 38 0000UTC 16.06.2024 48 40.5N 63.0W 1005 39 1200UTC 16.06.2024 60 45.7N 54.6W 1003 34 0000UTC 17.06.2024 72 CEASED TRACKING
-
Extra interesting map from my perspective because only area E of Miss. River with >200% of mean snowfall is narrow strip from E FL Panhandle to Charleston, SC. That was entirely due to one very rare storm, the SE coastal storm of Jan of 2018, the biggest since Dec of 1989. Keep in mind that most winters in that area have no measurable snow/sleet.
-
For Bay of Campeche next week, 12Z UKMET: NEW TROPICAL CYCLONE FORECAST TO DEVELOP AFTER 162 HOURS FORECAST POSITION AT T+162 : 19.7N 93.0W LEAD CENTRAL MAXIMUM WIND VERIFYING TIME TIME POSITION PRESSURE (MB) SPEED (KNOTS) -------------- ---- -------- ------------- ------------- 1200UTC 20.06.2024 168 19.9N 93.1W 1002 34
-
For Invest 90L, 0Z had actually dropped it but 12Z UKMET got it back: TROPICAL DEPRESSION 90L ANALYSED POSITION : 30.2N 78.1W ATCF IDENTIFIER : AL902024 LEAD CENTRAL MAXIMUM WIND VERIFYING TIME TIME POSITION PRESSURE (MB) SPEED (KNOTS) -------------- ---- -------- ------------- ------------- 1200UTC 13.06.2024 0 30.2N 78.1W 1011 27 0000UTC 14.06.2024 12 31.9N 77.8W 1009 31 1200UTC 14.06.2024 24 32.2N 76.6W 1007 35 0000UTC 15.06.2024 36 36.6N 72.2W 1005 40 1200UTC 15.06.2024 48 39.1N 68.7W 1000 42 0000UTC 16.06.2024 60 45.2N 60.3W 998 37 1200UTC 16.06.2024 72 52.2N 53.2W 993 32 0000UTC 17.06.2024 84 POST-TROPICAL
-
The UKMET tends to be too low with winds. But OTOH as you mentioned, highest winds tend to be lower for same pressure due to spreading out as latitude increases.
-
12Z UKMET: big hit on Canada again TROPICAL DEPRESSION 90L ANALYSED POSITION : 28.0N 83.0W ATCF IDENTIFIER : AL902024 LEAD CENTRAL MAXIMUM WIND VERIFYING TIME TIME POSITION PRESSURE (MB) SPEED (KNOTS) -------------- ---- -------- ------------- ------------- 1200UTC 12.06.2024 0 28.0N 83.0W 1011 23 0000UTC 13.06.2024 12 29.4N 79.3W 1008 37 1200UTC 13.06.2024 24 30.9N 77.4W 1005 39 0000UTC 14.06.2024 36 31.5N 76.6W 1004 38 1200UTC 14.06.2024 48 33.3N 75.0W 1001 38 0000UTC 15.06.2024 60 35.6N 72.4W 995 42 1200UTC 15.06.2024 72 39.1N 68.2W 990 51 0000UTC 16.06.2024 84 43.7N 62.3W 983 49 1200UTC 16.06.2024 96 48.2N 55.8W 986 45 0000UTC 17.06.2024 108 54.2N 52.3W 986 41 1200UTC 17.06.2024 120 POST-TROPICAL
-
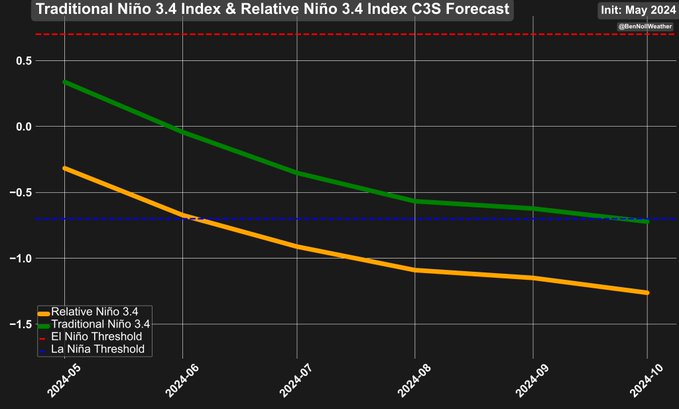
I’ve seen it only once, in the following Ben Noll tweet. This tweet was based on the May run of the valuable C3S ensemble of worldwide major models. Hopefully he’ll tweet the June update. I can’t find the direct link to C3S RONI. https://x.com/BenNollWeather/status/1793235394219434190 This is the image from that tweet. Is this from official C3S output or is this instead Ben improvising by taking the C3S ONI output (which the green line matches) and then assuming how much lower RONI would be vs ONI? Regardless, this is suggesting that RONI will be just over 0.5 C cooler than ONI through at least Oct, which seems reasonable. So, the prediction is for a -1.25ish RONI in Oct and still dropping slowly:
-
0Z UKMET: 990 mb Newfoundland Sunday: NEW TROPICAL CYCLONE FORECAST TO DEVELOP AFTER 30 HOURS FORECAST POSITION AT T+ 30 : 30.2N 77.7W LEAD CENTRAL MAXIMUM WIND VERIFYING TIME TIME POSITION PRESSURE (MB) SPEED (KNOTS) -------------- ---- -------- ------------- ------------- 1200UTC 13.06.2024 36 30.0N 77.4W 1009 39 0000UTC 14.06.2024 48 31.7N 75.9W 1008 33 1200UTC 14.06.2024 60 32.9N 73.8W 1007 36 0000UTC 15.06.2024 72 34.5N 71.8W 1005 32 1200UTC 15.06.2024 84 37.6N 67.7W 1001 41 0000UTC 16.06.2024 96 42.2N 61.6W 993 44 1200UTC 16.06.2024 108 47.8N 55.0W 990 37 0000UTC 17.06.2024 120 53.6N 51.5W 982 42 1200UTC 17.06.2024 132 POST-TROPICAL
-
More on potential -correlation between 11 yr moving avgs of SSN and Atlantic TC count: Note in the graph below of SSN that it was rather inactive 1875-1935 and active 1935-60. So, did TC count drop 1935-60 vs 1875-1935? Avg TC count 1875-1935 was 8 vs 11 of 1935-60. So, it did the opposite. Of course, some of this rise likely was due to better observation. Also, most of 1935-60 was during +AMO, which itself made it more active then. But, regardless, if there really is a -correlation, this sure didn’t show it back then. And I’d still like to know the scientific connection. TC count by year: https://www.nhc.noaa.gov/climo/images/AtlanticStormTotalsTable.pdf
-
1. I’ve never heard about this. Interesting. 2. Ronnie unfortunately didn’t post a link to the study from which the tweet’s figure 1 analysis of SSN vs TC count comes. Ronnie says that strength is affected, but figure 1 says nothing about strength. 3. The study cited by the tweet says no connection between annual TC count/SSN. But it does suggest -correlation between 11 yr moving avgs. It shows 1964-2021. From late 80s-2021 as 11 year moving avg of TC count has risen, the 11 year moving avg of SSN has been dropping. I’m wondering if this could really be correlation without causation. We know the 11 year moving avg of TC count has been rising the last few decades due to +AMO/rising SSTs. But also NHC seems to have been naming more weak systems. Did the weakening in the prior few sunspot cycles also contribute to those increased TC counts? If so, we should start to see a drop in 11 year moving avg TC count as we go through next few years due to last 2 yrs of very active sunspots causing a new rise in SSN 11 yr avg. If there really is a connection, what is the scientific reasoning? 4. Looking at individual years, highest TC counts vs nearby averages included 2020, 2005, 1995, 1969, 1954, 1950, 1949, 1936, 1933, 1916, and 1887. What was ASO SSN for those high TC count seasons? 2020: 8 2005: 37 1995: 22 1969: 135 1954: 8 1950: 93 1949: 189 1936: 140 1933: 5 1916: 73 1887: 20 AVG: 39 Longterm avg SSN is likely ~~75. Thus, the avg of 39 for high TC seasons is pretty low. So, out of these 11 seasons, 6 had well below avg SSNs in ASO. Only 3 of the 11 has well above avg SSNs. Thus, this data suggests there may be a modest correlation between high TC count years and low SSN years though nothing earth shattering, especially considering a fairly small sample size.
-
I forgot to mention this. Note that a good number of these extreme cold E US WB CFS maps have been showing near normal in/near N Lower Michigan/E Upper MI while many of the same ones also show the strongest cold anomalies just 200-250 miles to the S near Chicago. That’s obviously from a flaw.
-
Extended summer stormlover74 future snow hole banter thread 23
GaWx replied to BxEngine's topic in New York City Metro
Here we go again. Yesterday, JB posted an insanely cold WB CFS 2m map for Jan-Mar 2025 as if it were worthy enough to show. The crazy map is shown in this American Wx post below (thank you @FPizzfor letting the members know about this insanity): For those who haven't been following this, the WB versions of the CFS model have been way out in left field compared to both the Tropical Tidbits versions (yes the SAME model!) as well as other long ranged models. One thing the WB CFS maps have literally been showing are polar opposite SST anomalies to TT CFS for the same periods! JB is posting these likely due to a combo of his off the chart weenieness and for increased WB clients/clicks. He's sunk to a new low imho. This map is literally showing the coldest Jan-Mar 2025 in the E 2/3 of the US going back to the late 1800s and by a significant margin. He picks and chooses the coldest individual WB CFS 2m runs to post. And they're not even real! There obviously are serious flaws in the WB algos related to its CFS output. JB needs to be called out for this nonsense as often as he posts flawed/fake crapola like this. This is bottom of the barrel. Note that a good number of these extreme cold E US WB CFS maps have been showing near normal in/near N Lower Michigan/E Upper MI while many of the same ones also show the strongest cold anomalies just 200-250 miles to the S near Chicago. That’s obviously from a flaw. *Edit: I don’t think JB even realizes that WB CFS output is flawed. I’m confident he doesn’t compare it to TT CFS. @donsutherland1 -
LMAO! I assume you're posting this for the comedy aspect. For those who haven't been following this, the WB versions of the CFS model have been way out in left field compared to both the Tropical Tidbits versions (yes the SAME model!) as well as other long ranged models. One thing the WB CFS maps have literally been showing are polar opposite SST anomalies to TT CFS for the same periods! JB is posting these likely due to a combo of his off the chart weenieness and for increased WB clients/clicks. He's sunk to a new low imho. This map is literally showing the coldest Jan-Mar 2025 in the E 2/3 of the US going back to the late 1800s and by a significant margin. He picks and chooses the coldest individual WB CFS 2m runs to post. And they're not even real! There obviously are serious flaws in the WB algos related to its CFS output. JB needs to be called out for this nonsense as often as he posts flawed/fake crapola like this. This is bottom of the barrel. *Edit: I don’t think JB even realizes that WB CFS output is flawed. I’m confident he doesn’t compare it to TT CFS.
-
CSU updated 2024 forecast unchanged from April: https://tropical.colostate.edu/Forecast/2024-06.pdf
-
This is now the 1st Invest of the season, 90L.
-
0Z UKMET: 1. keeps streak going to 7 of runs with a TC off the SE US coast: NEW TROPICAL CYCLONE FORECAST TO DEVELOP AFTER 42 HOURS FORECAST POSITION AT T+ 42 : 30.3N 77.4W LEAD CENTRAL MAXIMUM WIND VERIFYING TIME TIME POSITION PRESSURE (MB) SPEED (KNOTS) -------------- ---- -------- ------------- ------------- 0000UTC 13.06.2024 48 30.6N 77.5W 1010 31 1200UTC 13.06.2024 60 32.4N 74.1W 1009 35 0000UTC 14.06.2024 72 33.3N 73.8W 1010 32 1200UTC 14.06.2024 84 34.9N 71.9W 1011 28 0000UTC 15.06.2024 96 38.6N 67.7W 1007 36 1200UTC 15.06.2024 108 42.4N 62.9W 1004 37 0000UTC 16.06.2024 120 CEASED TRACKING —————————————- 2. Again the UKMET doesn’t have a W GOM TCG.
-
Today’s 12Z run is the 6th UKMET run in a row with the TCG off the SE coast with this one stronger (TS) but back to moving NE safely off the E coast (0Z was moving N toward NC): NEW TROPICAL CYCLONE FORECAST TO DEVELOP AFTER 48 HOURS FORECAST POSITION AT T+ 48 : 28.6N 78.9W LEAD CENTRAL MAXIMUM WIND VERIFYING TIME TIME POSITION PRESSURE (MB) SPEED (KNOTS) -------------- ---- -------- ------------- ------------- 1200UTC 12.06.2024 48 28.6N 78.9W 1007 35 0000UTC 13.06.2024 60 29.0N 78.3W 1009 33 1200UTC 13.06.2024 72 30.8N 75.2W 1007 44 0000UTC 14.06.2024 84 31.7N 74.5W 1008 36 1200UTC 14.06.2024 96 31.6N 73.3W 1009 33 0000UTC 15.06.2024 108 33.6N 71.4W 1008 31 1200UTC 15.06.2024 120 CEASED TRACKING Meanwhile, the 12Z UKMET dropped the W Gulf TCG that it had on its prior 2 runs.
-
The latest daily WCS PDO update continues the rapid bounce back to -1.47 (implying NOAA PDO has probably bounced back up to ~~-2.5) after being ~-3 (NOAA ~~-4) just eight days earlier:
-
The UKMET and JMA did best last year. The updated JMA (June run) for autumn ONI is very similar to the May run with a very slightly warmer prog that is still borderline weak Nino/cold neutral for ONI near -0.5 (implying RONI near borderline weak/moderate La Niña)(no significant bc needed since did well last year and longterm bias fairly small):
-
Actually though, with a fairly predictable bias correction, it can still be useful for trend purposes. Like if the next run were to be, say, +0.5 or -0.5, that would tell me the true trend of the progged ONI/RONI is probably warmer or cooler.
-
June 8th BoM updated run: SON ONI +0.07. The prior run (2 weeks ago) had -0.10. So, it rose slightly. But keep in mind it was the worst last year with the 6/3/23 run having +2.7 for SON and the 6/17/23 run having +3.0 for SON. Actual SON ONI was only +1.8. So, these runs were +0.9 and +1.2 too warm, respectively. Thus, if we cool their +0.07 SON prog by 0.9 to 1.2, we get -0.8 to -1.1 for a bc ONI prog. And then this implied bc RONI prog would be -1.2 to -1.5 or cooler. Thus, the bc implied 6/8/24 BoM RONI prog for SON is for a moderate to strong La Niña.
-
The 0Z UKMET has a borderline TD/TS making landfall in W LA a week from now. This is the 2nd UKMET run in a row with this. The other run aimed for middle to upper TX but was still offshore at 168: NEW TROPICAL CYCLONE FORECAST TO DEVELOP AFTER 162 HOURS FORECAST POSITION AT T+162 : 28.6N 91.8W LEAD CENTRAL MAXIMUM WIND VERIFYING TIME TIME POSITION PRESSURE (MB) SPEED (KNOTS) -------------- ---- -------- ------------- ------------- 0000UTC 17.06.2024 168 29.5N 92.3W 1002 34


