

GaWx
-
Posts
18,793 -
Joined
Content Type
Profiles
Blogs
Forums
American Weather
Media Demo
Store
Gallery
Everything posted by GaWx
-
The following tweet’s image clearly illustrates the idea of RONI, which is already nearing the -0.5 threshold of La Niña (look at all of the blue along the equator in the E and C Pacific) vs the equivalent to ONI, which is still only down to ~+0.2 per OISST and CRW. https://x.com/BenNollWeather/status/1793981601132798393 “This map compares current sea surface temperature anomalies with the global average anomaly. Rather than using a 30-year normal to compute anomalies, this method more clearly reveals areas that are unusually warm or cool relative to the rest of the planet. This is important”
-
This GW over-exaggerated the strength of this last El Niño as it made it appear to peak at borderline strong/super (per ONI) vs it for all practical purposes really peaking at borderline moderate/strong (per RONI). In other words, the contrast with surrounding tropical waters wasn’t as large as the ONI suggested. The MEI suggested an even weaker Nino peak.
-
No, it doesn't change my analysis at all as that analysis wasn't predicting the upcoming La Nina strength. Nothing in this Noll tweet is surprising except that I had never seen a prog of RONI until now. Of course, this is just a multimodel avg prog and thus we'll obviously need to see if it verifies well. But this prog of a moderate RONI based La Nina in ASO (-1.15) doesn't surprise me at all as I had already been thinking good chance for RONI based moderate La Nina by ASO.
-
Check this tweet out from met. Ben Noll as it actually has a prog of RONI, the first I’ve ever seen: https://twitter.com/BenNollWeather/status/1793235394219434190 ”In a warming world, it's becoming increasingly difficult to disentangle El Niño events from the climate change signal. In other words, when the entire equatorial Pacific Ocean is anomalously warm -like it was in recent months- it can be hard to distinguish the signal from the noise! The Relative Niño 3.4 Index is calculated by subtracting the tropical mean sea surface temperature anomaly (20˚N-20˚S) from the Niño 3.4 Index and multiplying by a scaling factor. The relative index describes the onset of convection better, is not contaminated by global warming, and can be monitored and forecast in real-time. This suggests that La Niña-like atmospheric patterns may build in the months ahead, likely starting before an official La Niña event is classified by most international centers. This is of significance to hurricane season in the Atlantic Ocean and weather patterns across the planet. ————————————— This ONI/RONI prog is from the C3S, an average of most of the major models of the world (see image below). It’s showing RONI-ONI to be -0.67 in May (near what it was in FMA) and -0.55 in Oct. Based on this graph, it’s showing a prog of ASO ONI to be ~-0.60 (weak La Niña) but ASO RONI to be ~-1.15 (moderate La Niña), a truer reflection of the predicted strength of La Niña since it is negating the surrounding tropical waters’ warming: RONI retrospectively calculated back to 1950: https://www.cpc.ncep.noaa.gov/data/indices/RONI.ascii.txt
-
Check this tweet out from met. Ben Noll as it actually has a prog of RONI! https://twitter.com/BenNollWeather/status/1793235394219434190 ”In a warming world, it's becoming increasingly difficult to disentangle El Niño events from the climate change signal. In other words, when the entire equatorial Pacific Ocean is anomalously warm -like it was in recent months- it can be hard to distinguish the signal from the noise! The Relative Niño 3.4 Index is calculated by subtracting the tropical mean sea surface temperature anomaly (20˚N-20˚S) from the Niño 3.4 Index and multiplying by a scaling factor. The relative index describes the onset of convection better, is not contaminated by global warming, and can be monitored and forecast in real-time. This suggests that La Niña-like atmospheric patterns may build in the months ahead, likely starting before an official La Niña event is classified by most international centers. This is of significance to hurricane season in the Atlantic Ocean and weather patterns across the planet. ————————————— This is the first time I’ve ever seen a model prog for RONI! It is the C3S, an average of most of the major models of the world. (See image below) It’s showing RONI-ONI to be -0.67 in May (near what it was FMA) and -0.55 in Oct. Based on this graph, it’s showing a prog of ASO ONI to be ~-0.60 (weak La Niña) but ASO RONI to be ~-1.15 (moderate La Niña), a truer reflection of the predicted strength of La Niña since it is negating the surrounding tropical waters’ warming: RONI retrospectively calculated back to 1950: https://www.cpc.ncep.noaa.gov/data/indices/RONI.ascii.txt
-
Report: Another Year of Record Heat for the Oceans
GaWx replied to donsutherland1's topic in Climate Change
From met. Ben Noll, this is consistent with what I’ve been posting about S FL/Keys recently: A strong-to-severe marine heatwave has developed in South Florida's coastal waters amid the recent wave of noteworthy heat and humidity... The extremely warm water will likely form a positive feedback loop, with above average sea temperatures causing above average air temperatures and vice versa - a cycle that looks unlikely to be broken in the weeks ahead A pattern of persistent and strong high pressure over Mexico is driving the situation. When superimposed with the long-term warming trend, it creates some downright oppressive conditions. Simply put, such widespread and severe marine heatwaves are a sign of the warming climate. They are only expected to become stronger and last longer in the years and decades ahead. This event is a glimpse at what the future holds. It's not just Florida that's being affected: a category 5 "beyond extreme" marine heatwave is active near Port-au-Prince, Haiti, where it recently soared to 100˚F, a few degrees shy of the annual record. Santo Domingo, Dominican Republic, reached 101˚F this month, a degree shy of its annual record. The story has been similar for San Juan, Puerto Rico. Nighttime temperatures have been 5-10˚F above average in these areas, offering little or no reprieve from the heat. However, these locations can't hold a candle to Campeche, Mexico, which had a 26-day run of high temperatures exceeding 100˚F from April 23rd to May 18th. This included a ridiculous 113˚F reading on May 17th and a low of 83˚F that night, qualifying as 13˚F above average for the day as a whole. https://x.com/BenNollWeather/status/1792877963052261488?ref_src=twsrc^google|twcamp^serp|twgr^tweet -
I just did an analysis of CONUS landfalls for RONI ASO -0.50 to -1.00 vs sub -1.00. E = east coast and G = Gulf coast including FL Keys; if storm landfalled on both as a H, I counted it as 1/2 E and 1/2 G (1995’s Erin and 2022’s Ian) ASO RONI -0.50 to -1.00: every season at least 1 1954: 3 (3E) 1955: 2 (2E) 1964: 4 (2E, 2G) 1970: 1 (1G) 1983: 1 (1G) 1995: 2 (0.5E, 1.5G) 1999: 3 (1E, 2G) 2011: 1 (1E) 2017: 3 (3G) 2021: 2 (2G) AVG: 2.20 (0.95E, 1.25G) ASO RONI sub -1.00: less active avg despite 2020 1973: 0 1975: 1 (1G) 1988: 1 (1G) 1998: 3 (1E, 2G) 2007: 1 (1G) 2010: 0 2016: 2 (1E, 1G) 2020: 6 (1E, 5G) 2022: 2 (1.5E, 0.5G) AVG: 1.78 (0.50E, 1.28G) Analysis of ASO RONI wk vs mod+: -sig. more CONUS H landfalls (100%/70% had 1+/2+) -sig. more E coast landfalls (60%/30% had 1+/2+) -slightly fewer G coast landfalls due to 2020 being active -E being nearly as active as G for wk is relatively high for E -2020 ASO is mod+ per RONI but is only wk per ONI H tracks: https://www.nhc.noaa.gov/data/ RONI: https://www.cpc.ncep.noaa.gov/data/indices/RONI.ascii.txt
-
5 of the 16 LIV players (31%) MC per this: https://golfweek.usatoday.com/lists/2024-pga-championship-how-all-16-liv-golf-players-fared-valhalla/ The 31% is actually pretty good considering that 50% of all 156 players MC or WD.
-
Thanks for posting this. This shows a dynamic model average ONI low of ~-0.9C in OND/NDJ. I’d probably conservatively subtract ~0.5C to estimate RONI, which would mean ~-1.4C for the implied dynamic model avg RONI prog.
-
Though severe warned for potential 60 mph wind gusts and 1” hail, I fortunately never saw anything close to that unlike the 4 hour power outage causing prior severe warned storm of 10 days prior (5/9). Also the CTG lightning wasn’t bad. But the rain was very heavy for ~30 minutes producing the typical localized street flooding. Rain fell for ~2 hours total due to followup convection. I received a total of ~1.25” of beneficial rain.
-
Report: Another Year of Record Heat for the Oceans
GaWx replied to donsutherland1's topic in Climate Change
I’ve been following the Key West (KW) buoy data closely again recently to see how it is comparing to last year. Keep in mind that this buoy’s water temp is legit since it’s over deep water unlike the buoys over shallow FL Bay/just S of the S tip of FL. During 5/15-18/24, KW water averaged an insanely warm 30.5C! That was warmer than 5/15-17/23, which was “only” 29.1C. And then today (5/19), the KW avg rose to 31.0C! Last year around this date, KW started warming significantly and was up to 30.5C on 5/19/23. It didn’t fall back to that level til late August. The peak was on 8/10/23, when the avg was ~33.5C and one reading just touched 34.0C/93.2F!! There is a coral reef in this deep water near and I believe just S of the Keys chain. It suffered severe, extensive, and very longlasting bleaching much of last summer. I’ll be closely following this again this summer. If the most recent water temps are any indication, it isn’t looking encouraging. In addition to a significant increase in the warmth of the planet overall and more specifically in the N Atlantic Ocean in 2023 vs 2022, the Keys and nearby had a lengthy dry/sunny spell during July-early Aug, which exasperated the ocean heat. Will it be as bad there this summer? Key West latest buoy data: https://www.ndbc.noaa.gov/station_page.php?station=kywf1 2023 KW buoy data: https://www.ndbc.noaa.gov/view_text_file.php?filename=kywf1h2023.txt.gz&dir=data/historical/stdmet/ -
Strong thunderstorms approaching my area. Edit: Now severe warned.
-
Also, why is a solid -NAO like 2010-11 even being given serious consideration based on its rarity in winter since 1979-80? I’m not saying it can’t occur since just about anything is possible with wx, especially that far out. But that’s beside the point. I’m talking about serious consideration.
-
For starters, I think we can throw out 2010-11 as 2010-11 is not a valid analog because it had a very strong -NAO in Dec and Jan. Also, I agree we can throw out 2020-21 because it also had a -NAO. There’s no good reason based on what we know now as well as what long range models are showing to think that there will be anything even close to a strong -NAO next winter. Moreover, -NAO winters have been few and far between since 1979-80. Only 13% of them since then have had a -NAO averaged out over DJF: 1984-5, 1986-7, 1995-6, 2009-10, 2010-11, and 2020-1. All 6 were within two years of a sunspot cycle minimum and had avg sunspot numbers under 35. Next winter will be active with much higher than 35. Coincidence? I don’t know but I maintain that the chances of a solid -NAO next winter similar to DJ of 2010-11 are very low based on the last 45 winters.
-
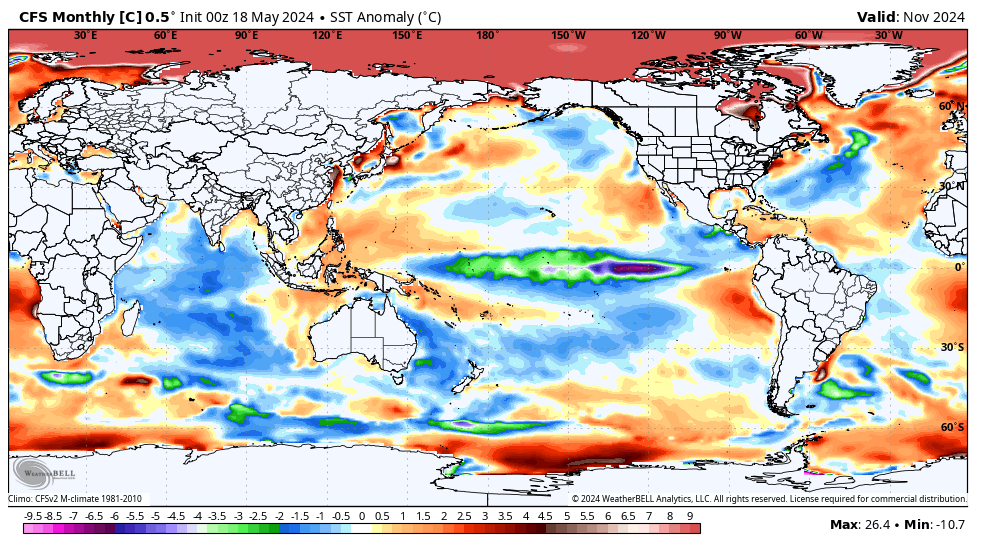
He’s been claiming that these (what I know are very flawed) WB CFS SSTa maps are showing a +PDO, not -PDO. This particular one is ironically showing closer to a neutral PDO (which he isn’t acknowledging and which is still way off from TT CFS, which continues to show solid -PDO). But many of the WB CFS runs have been showing a fake large area of BN in much of the W to CPAC from Hawaii W and NW (just like the fake IO BN) while also showing the warmest NPac anomalies to include a large area off Baja. TT CFS maps have been showing nothing of the sort. And now it looks like WB CFS may be finally starting to correct this BS.
-
He keeps showing individual runs of WB CFS SSTa prog maps for Nov+ that are way off from other companies’ versions of the same model. Most, if not all, of these WB CFS runs he shows are showing solid BN in the IO, including this one for Nov (he likes showing the cold IO on WB CFS maps to suggest a major drop in global temps is coming): https://x.com/BigJoeBastardi/status/1791842665056616545/photo/2 But TT CFS totally disagrees. Here’s the avg of the last 12 runs of the TT CFS for Nov showing the cold IO on WB CFS isn’t real: Also, here is TT CANSIPS: And TT NMME: Bottom line: WB CFS prog maps are badly flawed and thus should be dismissed due to inaccurately portraying the CFS.
-
Report: Another Year of Record Heat for the Oceans
GaWx replied to donsutherland1's topic in Climate Change
At 3 PM were these amazingly high HIs: Miami 112 WPB 114 Key Largo 117 These must be records for at least the day, if not the month! -
While FMA ONI was +1.15, FMA RONI was already down to +0.48. Weeklies don't exist for RONI. But based on this FMA difference and assuming the difference is currently similar, an equivalent current RONI weekly would likely already be down to -0.2 to -0.4 (cold neutral).
-
Report: Another Year of Record Heat for the Oceans
GaWx replied to donsutherland1's topic in Climate Change
Ft. Lauderdale has had a whopping 11 days in a row of a record high minimum and with another very likely coming today! Along with this, the last 9 days in a row have had a record high mean. This includes yesterday’s 89.5, the highest on record for May (records back to 1913). Also, only one other day has had a warmer mean, the 91.5 of 6/22/2009! -
Even just a -1.5 ONI could be enough for the strongest Niña on record on a RONI basis (records back to 1950). The strongest RONI is -1.94 of OND 1973 followed closely by -1.93 of NDJ 1988-9. Keep in mind that the latest RONI (FMA 2024) is a record breaking 0.67 lower than ONI (+0.48 vs +1.15). Here’s the list of strong RONI based La Niña: -1.94 OND 1973 -1.93 NDJ 1988-9 -1.70 OND 2010 -1.67 DJF 1999-00 -1.65 NDJ 1998-9 -1.62 OND 1955 -1.58 DJF 2007-8 -1.52 OND 2020 (corrected) 1995-6 went down only to -0.94. https://www.cpc.ncep.noaa.gov/data/indices/RONI.ascii.txt
-
@kdxken @Chrisrotary12 and anyone else who may be interested, the deadline to enter the AmericanWx PGA Championship pool with your five players and prediction of the winning 72 hole score to par is 7AM tomorrow. You can go to 2024 PGA Tour thread in Sports Zone forum to enter and see the scoring rules. No prizes/money. Just for fun. Three entered so far.
-
Yes. Yes I have. Fall, spring and summer have not had the same decline in NAOs. Summer has actually had a notable increase since 2007.
-
No, I actually normally don’t put too much weight into solar cycles for seasonal forecasting. But I discovered during my research of -NAO winters since 1980 (the period during which the frequency of -NAO winters has sharply declined) that they all were when sunspots averaged under 35. So, I have to wonder whether or not in recent decades being near a solar minimum has been a significant independent factor for a -NAO winter vs it just being a coincidence.
-
For those who don’t realize it, 2020-1, 2010-1, and 1995-6 were all near solar cycle minimums and they had -NAOs averaged out over DJF.
-
I’ll add to a likely robust Niña (especially on a RONI basis) a robust -PDO, SE ridge, and W PAC marine heatwave a -NAO being highly unlikely. Only 13% of winters since 1979-80 have had a -NAO and they were all when the avg DJF sunspot number was <35. All 6 -NAO winters occurred within a couple of years of a solar cycle minimum. Interestingly, all 4 cycle minimums had either 1 or 2 -NAO winters within two years. Coincidence?? Regardless, AGW/CC may be the main reason for a big drop in winter -NAO frequency though I’ve yet to see proof of that. I suppose that may be hard to actually prove. As often is the case, any possible major SSWs would be a wildcard with unpredictable consequences for a portion of winter. Also, someone like @roardog , who’s N of Detroit, or someone in, say, Chicago, would have better potential per climo in a robust Niña vs those of us on E coast. And my being near SE coast places me among the least favored by La Niña/SE ridge/-PDO etc. But regardless, I still enjoy winter the most of any season (obviously nothing to do with snow, which is usually nonexistent here in any one winter). A warm winter here is still cooler than a cool fall/spring and with lower dewpoints. La Niña climo:


