

GaWx
-
Posts
19,136 -
Joined
Content Type
Profiles
Blogs
Forums
American Weather
Media Demo
Store
Gallery
Everything posted by GaWx
-
These operationals were not predicting anywhere near 930. The lowest yest was 963 on 6Z GFS. But anyway, good for Gulf coast to not have 930. Being not far from the coast, I can empathize. Slop is good. And don’t be fooled by strength. Flooding rains can happen with a TS or even unnamed like was the case in NC recently. And even a cat 1 H can cause sig damage near center.
-
12Z Euro: 991 Pensacola Fri night 12Z UKMET: 1000 FL panhandle Fri night 12Z Icon: 999 E LA Fri night 12Z GFS: 998 Panama City Thu night 12Z CMC: 993 Mobile late Thu afternoon
-
0Z: Euro: E of 12Z, which had hit Mobile 9/29 at 989; 0Z hits Apalachicola 9/29 at 984 mb GFS: just SE of Panama City late 9/27 at 979 CMC: E LA 9/27 981 ICON: C Gulf moving N 965 9/28 UK: 200 miles SSE of LA/TX border 1000 mb moving NNW late 9/27
-
12Z UKMET: TCG is a little earlier than the prior two runs as it is Wednesday evening in NW Caribbean; it moves slowly N and then NW into south-central Gulf Fri morning (end of run) with it then at 997 mb and strengthening: NEW TROPICAL CYCLONE FORECAST TO DEVELOP AFTER 132 HOURS FORECAST POSITION AT T+132 : 19.7N 86.5W LEAD CENTRAL MAXIMUM WIND VERIFYING TIME TIME POSITION PRESSURE (MB) SPEED (KNOTS) -------------- ---- -------- ------------- ------------- 0000UTC 26.09.2024 132 19.7N 86.5W 1002 32 1200UTC 26.09.2024 144 21.1N 86.5W 1001 43 0000UTC 27.09.2024 156 21.7N 88.2W 1000 35 1200UTC 27.09.2024 168 23.4N 89.3W 997 40
-
Accuweather is looking at all Sept NW Caribbean storms to make this map. If a climo map is going to be used, I’d prefer to use the NHC image below, which is just climo for storms originating Sept 21-30, when NW Caribbean storms tend to recurve more sharply and threaten FL peninsula more often than is the case for Sept as a whole. Also, TX is hit even less than the 14% shown with only one landfall:
-
12Z ICON: major change in track vs prior runs! Instead of going into the W Gulf, it never goes W of 89W and landfalls (at ~997 mb) at Panama City, FL, at hour 159 on Thu night.
-
For comparison, this is the 6Z GFS IR simulation as of 9AM EDT:
-
Wow, I got an initial response within 10 minutes! Impressive! “Hi The data used for the NAO on this page is from the cpc file tele_index.nh https://ftp.cpc.ncep.noaa.gov/wd52dg/data/indices/tele_index.nh and not the link you list. It appears the 2 time series differ somewhat. I am not sure what the difference is in this case. The climo could be different (most likely) or definition could be slightly different. I'll try to look into it. But we don't create either of the 2. I hope this helps. Cathy Smith” —————— The climo being different would make sense because they all missed the tabular based values about the same to the negative side.
-
I just sent NOAA an email at the address provided at the graphing site about this graph vs tabular NAO value discrepancy.
-
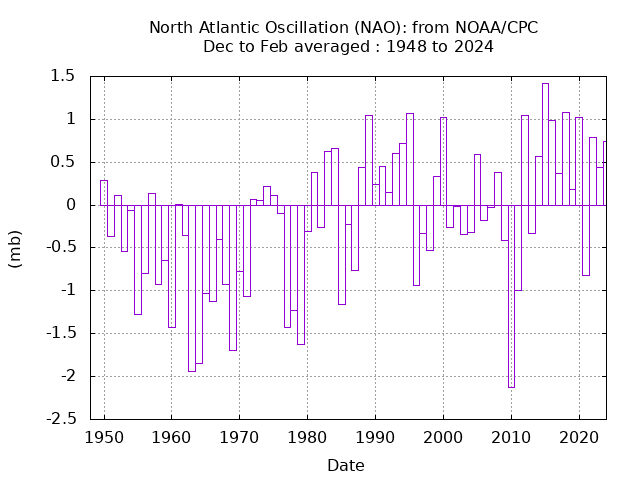
Chris, the winter NAO bar graph that you posted is off. I reposted it below. Did you produce this or did you copy it from somewhere? Every year on the graph is -0.25 to -0.5 more negative than the actual CPC monthly tabular values, which are here: https://www.cpc.ncep.noaa.gov/products/precip/CWlink/pna/norm.nao.monthly.b5001.current.ascii.table Example: your graph shows DJF 2009-10 at -2.1. But the table’s DJF averaged -1.7. So, the graph is 0.4 too negative. Another example: your graph shows 2014-5 to be ~+1.41. But the table calculates to +1.66. So, the graph is ~0.25 too negative. Another: your graph shows 1962-3 to be ~-1.95. But the table’s value is -1.47. So, the graph is ~0.48 too negative. Every winter is similar. I couldn’t even find one exception. Why is there this -0.25 to -0.5 discrepancy on the graph vs the table?
-
Change from run to run out that far is nothing unusual. The dartboard is getting closer but it is still pretty far away.
-
0Z EPS has an increase in members in the W GOM although a good number go earlier into the NE Gulf. Two camps.
-
0Z Euro: LLC forms eastern Bay of Campeche at 168 but moves and strengthens little through 240. At 240 it’s at 1002 mb with the entire Gulf having BN SLPs. Interestingly, a 2nd low (1004 mb) forms in the NE Gulf at the end.
-
0Z UKMET: TCG at 168 hours 75 miles SSW of W tip of Cuba (50 miles NE of 12Z’s hour 168 position, which is 12 hours earlier); already down to 1001 mb: NEW TROPICAL CYCLONE FORECAST TO DEVELOP AFTER 168 HOURS FORECAST POSITION AT T+168 : 20.8N 85.3W LEAD CENTRAL MAXIMUM WIND VERIFYING TIME TIME POSITION PRESSURE (MB) SPEED (KNOTS) -------------- ---- -------- ------------- ------------- 0000UTC 27.09.2024 168 20.8N 85.3W 1001 32
-
Indeed: Here are the DJF NAOs for the 8 Niña/W winters since 1948-9 in SS order high to low 1999-0 +1.3 (all 3 +)(SS 140) 2022-3 +0.7 (no -)(SS 120) 1971-2 +0.4 (all 3 +)(SS 110) 2010-1 -0.7 (DJ -)(SS 30) 2016-7 +0.7 (all 3 +)(SS 20) 2020-1 -0.4 (DJ -)(SS 14) 1975-6 +0.2 (J -)(SS 10) 2008-9 -0.1 (D -)(SS 1) Analysis: - The 3 highest SS winters of this group by far all had +NAO winters with not even one -NAO month - 4 of the 5 lowest SS winters had either 1 or 2 -NAO months of the 3 with all in D and/or J interestingly enough - Of these 8 winters, the only one out of sync was 2016-7 with its solid +NAO despite low SS Conclusion: - Kudos to Ray and @snowman19. Niña/W connection to -NAO or neutral NAO winters has been only during low sunspots with 80% (4 of 5) that way. - Niña/W/high SS seems to favor +NAO ———- **Edit: Aside: note there were no Niña/W winters 1948-9 through 1970-1 (vs 2 Nina/E). None of those 23 winters! A big reason was the much lower frequency of La Nina then. Then there were 2 of the next 5 that were Niña/W (1 of those was Niña/E). But then none of the subsequent 23 were Nina/W (vs 2 that were Niña/E). This was followed by 6 of the last 25 that were Niña/W (vs 6 being Niña/E) and 5 of the last 14 largely due to increased Niña frequency since the late 1990s.
-
12Z Euro: W Gulf at 240
-
Nothing is black and white. I’m just saying it may be one factor contributing to the tropics waking up.
-
The SSN mean for Sept to date has been much lower than the 215 of Aug. That is especially the case the last 10 days, which have averaged only ~128. There’s no way to know but perhaps this is one of the reasons the tropical Atlantic is waking up and likely soon headed toward normal to above average activity. Perhaps Atlantic tropical instability is increasing and, if so, the solar downturn may be contributing to that: 2024 09 01 2024.668 182 14.5 27 35 2024 09 02 2024.671 195 20.7 26 33 2024 09 03 2024.673 180 21.2 20 23 2024 09 04 2024.676 174 26.1 21 26 2024 09 05 2024.679 181 13.1 15 20 2024 09 06 2024.682 189 13.3 19 24 2024 09 07 2024.684 168 17.8 24 29 2024 09 08 2024.687 171 18.7 20 26 2024 09 09 2024.690 156 19.1 23 26 2024 09 10 2024.693 149 12.8 24 30 2024 09 11 2024.695 153 15.4 29 34 2024 09 12 2024.698 144 11.6 24 28 2024 09 13 2024.701 118 13.1 26 31 2024 09 14 2024.704 117 10.6 24 31 2024 09 15 2024.706 100 14.1 22 27 2024 09 16 2024.709 142 16.2 22 27 2024 09 17 2024.712 141 13.4 28 36 2024 09 18 2024.714 109 9.9 24 28 2024 09 19 2024.717 109 11.1 25 31
-
It is back on the UKMET (12Z) with it becoming a TC at 168 (12Z on 9/26) in NW Caribbean 150 miles SW of W tip of Cuba: NEW TROPICAL CYCLONE FORECAST TO DEVELOP AFTER 168 HOURS FORECAST POSITION AT T+168 : 20.1N 86.0W LEAD CENTRAL MAXIMUM WIND VERIFYING TIME TIME POSITION PRESSURE (MB) SPEED (KNOTS) -------------- ---- -------- ------------- ------------- 1200UTC 26.09.2024 168 20.1N 86.0W 1004 27
-
Looks like Euro will likely be W again with whatever forms on the run per early maps.
-
0Z GEFS says that the 0Z GFS is a major W outlier as just about all members recurve in the E Gulf. This is about the most threatening GEFS to W FL from Big Bend S of any run yet. 0Z UKMET has no TC through 168.
-
I storms have been extra damaging and/or deadly on the CONUS since Irene of 1999 and Isabel of 2003. Afterward, there was Ivan of 2004, Ike of 2008, Irene of 2011, Isaac of 2012, Irma of 2017, Isaias of 2020, Ida of 2021, Ian of 2022, and Idalia of 2023. Very damaging or deadly H storms for CONUS: Hazel of 1954, Hilda of 1964, Hugo of 1989, and Harvey of 2017. I storms overall have been the worst by a good margin of any letter for the CONUS the last 25 years.
-
Look out below! OISST just plunged 0.2 in 24 hours (because it’s playing catch-up) to -0.56 (weak La Niña territory) CRW: -0.55 CDAS: -1.00
-
12Z Euro: far NE TX 9/28 998 mb 12Z JMA: middle of Gulf 9/26 moving N 1004 mb 12Z Euro ens: quite active with main US threat E LA to Tampa


