GaWx
-
Posts
18,422 -
Joined
Content Type
Profiles
Blogs
Forums
American Weather
Media Demo
Store
Gallery
Everything posted by GaWx
-
1. I estimate that the January 2026 PNA will calculate to +0.5. 2. Jan NAO calculated to be negative. This combined with the Dec -NAO and the progged first half of Feb’s -NAO means the first sub -0.25 DJF NAO is just about assured for a winter without it being weak sunspotwise since 1978-9!
-
January 30th- Feb 1st ULL and coastal storm obs
GaWx replied to JoshM's topic in Southeastern States
It looks like the last band to affect the SAV area is coming in now from the NW to SE on the S side of the very strong upper low. This looks kind of juicy! I took more measurements in advance of this band on a table and measured 0.5”. -
January 30th- Feb 1st ULL and coastal storm obs
GaWx replied to JoshM's topic in Southeastern States
Heavy dusting here to this point with light snow still falling and a very windy 28. It’s so cool watching it blow around in the strong winds, especially coming off the roof, because of it being fluffy. Looking at the leaves/grass, some is as deep as 1/2”. But some is closer to 1/4”. So, taking the average gives me 3/8”. So, maybe call it 0.3-0.4”. The pavement is still just wet. Keep in mind that our average annual is only 0.2” and that we get no measurable snow in the vast majority of winters. This is the first time for SAV to have measurable snow in two straight calendar years since 1917-1918, which was actually only 3 days apart (0.1” on 12/30/1917 and 0.5” on 1/2/1918). I’ll add that SAV has since had consecutive winters with measurable snow, but the two snows were both in 1989 (Feb and Dec). Also, SAV has since had two measurable snows in the same winter twice. *Edited for correction and additions @donsutherland1since I think of him as a wx historian and want to make sure he sees my correction by adding 1917-18 -
According to @Stormchaserchuck1the lag is shorter later in winter. Should be within ~2 weeks I think. And lasts usually 2-3 weeks++. But it may already be cold then anyway independent of this likely reversal.
-
Today’s Euro Weeklies has it outrightly predicting a reversal 2/12-15: @40/70 Benchmarkthe guru on this!
-
Separate. But now I wonder if he meant to say E based Nino.
-
Do you mean the QBO will be west (+)? For the sub -20 December QBOs at 30 mb (i.e., very strong E QBO), what was the following Dec’s QBO? 1965: -21; 1966: +13 1974: -23; 1975: +11 2005: -25; 2006: +6 2014: -25; 2015: +11 2021: -22; 2022: +12 2023: -23; 2024: +13 2025: -27; 2026: ? So, for all 7 Decembers with a sub -20 QBO, all of the subsequent Decembers were +6 to +13, which is intuitive based on the normal cycle length. Thus, I see almost no way next winter will have anything near an east QBO. But, again, did you mean west (+) QBO? If you really meant E (-), on what are you basing that? Are you aware of the history that I’m posting here? https://psl.noaa.gov/data/correlation/qbo.data
-
NYC now up to 22” season to date vs 15” avg and the most as of this point since 2015-6! It’s been one heck of a season so far, based mainly on 3 significant snows. If they get avg the rest of the way, they’d have a total of 35”. Fwiw, my prediction for the season total, which was made after the 1st storm last month and is my only prediction made for this, is 40”.
-
The “I bring the mojo” Jan 30-Feb 1 potential winter storm
GaWx replied to lilj4425's topic in Southeastern States
I’m not saying I’m buying the gfs since it’s a poor model and has tended to overdo qpf and snow, but fwiw this shows FAY with one of their biggest snows on record with 12-15” in the area! Wow, that would be crippling. Also, in case this were to somehow verify closely: when was the last times the entire NC got 5”+ from one storm? Not to be forgotten, this gives me ~0.3”, a rare event down here! -
The “I bring the mojo” Jan 30-Feb 1 potential winter storm
GaWx replied to lilj4425's topic in Southeastern States
Icon heaviest snow in NC just N of Fayetteville and NE with big hits those locations. It also gives me a rare for this area 0.5” though I’ll believe that when I see it! -
I finally got to my analysis of Baltimore temp anomalies during Feb La Niña phase 1 since 1975 and I even added the results for the surrounding phases 8 and 2. Before I get to those, I also looked at La Niña Febs in general there, which averaged mild (intuitive). That shouldn’t be forgotten when looking at each phase. So, that’s going to make it hard for any Niña phase to be cold in Feb. There have been 20 La Niña Febs since 1975. The coldest anomaly was only -2 (2022) with next coldest of -1 (2021, 2006, and 1996). In contrast, the warmest was +8 (2023 and 2017) followed by +7 (1976) and +5 (2018, 2012, and 1984). The 20 complete Niña Febs averaged +2.3. So, any Feb Niña phase that’s NN would be relatively cold. ————— Here are the results for phases 8, 1, and 2 at Baltimore: Phase 8: 17 periods MB 0 B 6 N 4 A 3 MA 4 Avg: +44/61 days = +0.7 So, phase 8 was NN, which is 1.6 colder than the +2.3 average of all Feb Niña days. So phase 8 has been relatively cold. I suspect that this may come out as the coldest Niña Feb phase but I’d need a lot of time to go through the #s of the remaining phases to confirm that. The only phase with a decent chance to be colder than 8 is phase 3. So, that would be the next phase I’d calculate if I get time. ————— Phase 1: 16 periods MB 3 B 2 N 4 A 2 MA 5 Avg: +134 /52 days = +2.6 So, though it averaged a bit mild, that +2.6 was very close to the overall +2.3 avg for all Niña Feb days. ————— Phase 2: 18 periods MB 1 B 1 N 6 A 4 MA 6 Avg: +296/68 days = +4.4 —————— So, in summary for phases 8, 1, and 2: phase 2 is easily the true mild phase in all senses as its +4.4 is 2.1 warmer than even the +2.3 overall avg for all Niña Feb days. Phase 1 is in the middle with its +2.6 and phase 8 is the coldest with only +0.7.
-
It looks like the weekend winter storm is favoring a weak, possibly inside the circle phase 8 at this time based on the GEFS/EPS/JMA consensus.
-
The “I bring the mojo” Jan 30-Feb 1 potential winter storm
GaWx replied to lilj4425's topic in Southeastern States
Bet the NW trend and a lot of it while you’re at it. It did it for these last 2 storms and for many over the years. It’s already been doing it today at least on the EPS, and thus there’s no reason to think it won’t keep going NW. It’s an inherent problem with about all of the models. A pro met, Brad Harvey, told me he thinks the SE model bias is at least partially related to the W Pac warm pool. Hopefully it won’t trend too far NW and take ATL out of snow because I may visit there next weekend to see it and some of my ATL peeps while I’m there. Looking at how much it trended NW in just the last 18 hours, there’s plenty of time (6-7 days) for ATL to be taken out of snow potential. For example, check out the NW trend of the MOGREPS (UKMET ensemble) mean within just a 12 hour span. This will be way inland of the SE US if this speed of NW trend keeps up for just another couple of days. It will probably slow down and it may tick the other way temporarily, but this is not a good sign though it’s hardly surprising: -
1. It looks like after quite a negative start (~-0.9 for Jan 1-8), we’re most likely headed toward an ~+0.5 PNA for Jan, which will keep the long streak alive of -ENSO -PNA Decembers transitioning to +PNA Januaries that stretches all of the way back to 1983-4. I’ll revisit this when we get the final Jan #. 2. Well, the models did very well in predicting an obliteration of the old record long met. winter phase 6 MJO, which was 13 days (1/30-2/11/2011): the one this month was 17 days as it ran from Jan 5th through Jan 21st: @donsutherland1@40/70 Benchmark
-
That’s interesting about phase 1 during La Niña supposedly being relatively warm based on that source. If I get time (it’s a bit time consuming but I’m interested enough to possibly check it), I’d like to assess this based on actual temps for phase 1 in La Niña. I may check Baltimore. For all ENSO combined in Feb, it isn’t at all warm in the E US overall: @so_whats_happening
-
Yep, over a week of NW model trend tendencies to endure. The model bias too cold /too far SE vs reality has just occurred with these last 2 storms and is a never ending/common occurrence as most here should know by now.
-
This insane 6Z GFS would triple the modern day record (back to 1870s) of biggest snowfall in this area and would be the biggest since a similar one on March 3, 1837. Suffice it to say, the odds of this 10.3” day 8-9 snow (on ~1.1” qpf) coming even close to verifying are infinitesimally low. This is best treated this far out as one of those random GFS runs doing extreme things on the Gulf coast/coastal SE. Only 8-9 days of NW trend to deal with lol.
-
Today’s Euro Weeklies mean has an even weaker SPV centered on ~2/13. @40/70 Benchmark Yesterday’s run: Today’s run: Also, look at how much colder the week of 1/26-2/1 has gotten over the last 12 days: 1/10 run: 1/22 run:
-
Thanks for posting these. I’m really hoping the Euro freezing rain amounts will end up closer than the much wetter Icon and especially GFS. I’m extra concerned for loved ones in ATL and FAY. I’ve been giving them advice regarding preps for the worst case scenario just in case, but I’d of course love for nothing close to the worst case to happen. At 18Z ZR for ATL: GFS 1.6” (that’s actually down some but still would be worst since ‘73) Icon ~1.5” (also actually down some) Euro 0.6” (partially due to less qpf) UKMET nothing (not realistic unfortunately) So, even with GFS/Icon down some from 12Z, that’s still 2.5+ times as much as the Euro!
-
Pivotal UK clown maps count all wintry precip including ZR as snow for those who don’t know (10:1 for all wintry qpf).
-
The last 1+” of that in ATL area on the 18Z GFS is plain cold rain. If that verifies, it would accelerate the melting after a very bad ZR hit.
-
Are most of y’all also having major issues with accessing certain wx sites thanks to the extreme wx? I’m not just talking about NOAA sites, which I haven’t been able get to at all all day.
-
Of course they can be overdone as that’s pretty much always the case along with the chance they can be underdone.
-
Thanks, Don. 1. I think it’s a combo of that and some in here who post more frequently about E US warmth because they only enjoy posting about it. I’m not against posting about warmth as I do it frequently, myself. I post whatever I see, warm or cold. That includes when I post warm Euro Weeklies that cold lovers don’t like to see. I just think it’s best if there’s a better balance regardless of warm, cold or between. 2. I’m feeling good about the 40” NYC seasonal snow total prediction I made in Dec. based off of the snowy Dec in combo with the La Niña analogs Chris and you have talked about many times.
-
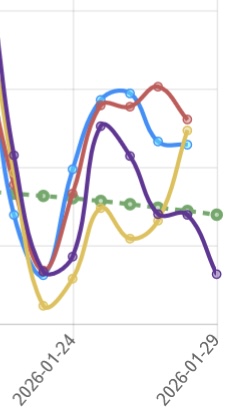
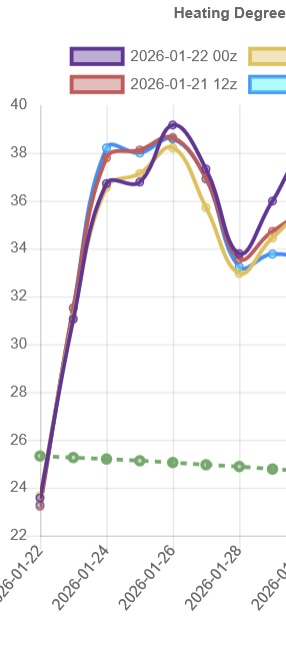
Yes, Chuck, I’ve been following NG make this historically sharp upward move this entire week. For those who don’t follow NG closely, why is this happening? It’s 100% related to something we closely follow ITT: E US temps. Look no further than this absolutely insane comparison of GEFS US pop weighted HDD for Jan 22-29th on the Jan 14th 12Z run vs the 0Z Jan 22nd run. I don’t know that I’ve ever seen anything more extreme than this amazing colder change over just a 7.5 day elapsed period: Jan 14th 12Z run (purple) 1/22-29 US pop wted HDD: 26+23+24+27+26+25+25+23=199 or 25/day (near the green line, which straddles the normal of 25/day): Jan 22nd 0Z run (purple) 1/22-29 US pop wted HDD: 24+31+37+37+39+37+34+36=275 or 34/day (MA normal)!