GaWx
-
Posts
17,544 -
Joined
Content Type
Profiles
Blogs
Forums
American Weather
Media Demo
Store
Gallery
Everything posted by GaWx
-
This end of the Jan 31 6Z GFS is close to a major SSW on the anniversary of the one of last winter, Feb 16:
-
I’ve also been wondering about that fly in the ointment the last few days despite a still good looking pattern at H5. Also, the CFS ensemble means have been trending warmer for March while trending colder for Feb. We’ll see!
- 750 replies
-
- 1
-

-
- snow elk
- wooly worm
- (and 1 more)
-
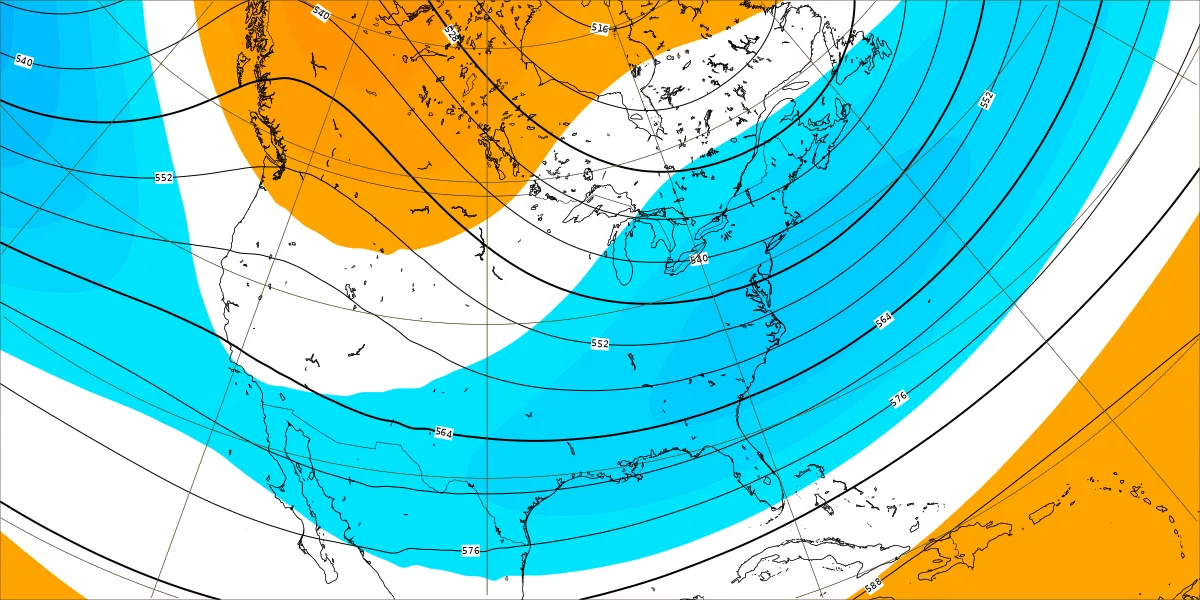
The long awaited (for ~3 weeks) and hoped for major pattern change of mid Feb seems to be more or less on track at the end of the regular ensemble runs now. Here’s the nice split flow at the end of the 12Z GEFS/El Nino says hello: The extended models have been hinting at Feb 18-19 as the first period for an enhanced chance for a SE Miller A/GOM winter storm. We’ll see. The end of the regular runs is still too far out to be considered anything close to trustworthy territory but it’s a nice baby step.
-
Look at how much the WCS daily PDO has risen recently. It was up to -0.20 as of Jan 27: Edit up to -0.17 on Jan 28
-
But this is already happening. It says this is a 2023 upgrade. The 100 ensemble members already run to day 46 every day on the 0Z run rather than the old twice per week runs.
-
-
During the extended period of the 0Z Jan 29 GEFS, it fwiw suggests two periods with a heightened vs climo chance for a Miller A GOM SE winter storm: ~Feb 18-9 and ~Feb 24-5. During these periods, the run has a number of members with GOM lows that cross the FL pen. while in some cases underneath a Canadian high to the north centered near the Ohio Valley providing a good cold air connection while allowing for moisture to overrun the low level cold air. There have been several runs with similar dates though of course still fwiw. The Euro Weeklies of today suggested to me the best shot to be during the week of Feb 19-26 like it has in other runs. In addition, the mean of the last 12 runs of the CFS ensemble has the wettest week in the SE/GOM also during Feb 19-26. So, these three extended ensembles are together suggesting to me a heightened chance for a widespread SE significant winter storm within Feb 17-26 fwiw. We’ll see what happens! It could end up mild for all I know due to the unreliability of the extended models and there appears to be a couple of days of delay in the pattern change ~Feb 14, but I still like the prospects as of now starting just after the hoped for pattern change.
-
At H5, the Euro Weeklies mean for Feb 12-19 actually looks surprisingly similar over the US for the two runs with a nice setup. So, it does appear to be just a short delay. However, the -NAO and -AO are slightly weaker. Perhaps that’s helping to reduce the degree of cold.
- 750 replies
-
- 3
-
-
- snow elk
- wooly worm
- (and 1 more)
-
There has been a significant weakening of the SPV on the Euro Weeklies for mid-Feb onward since the run of 3 days ago, especially for mid-Feb: Here was the Jan 26 run: very strong SPV mid-Feb with 10 mb winds +31 with only one (1%) wind reversal then: Today’s run’s mean has literally almost cut the Feb 19th wind in half to a BN +16 in just 3 runs and has ~12% with a reversal. Watch this period for possible future increases in probabilities. The CDN and FNMOC ensemble mean winds have also dropped somewhat for mid-Feb. Potential implications of a mid Feb reversal would be for early March in the E US:
-
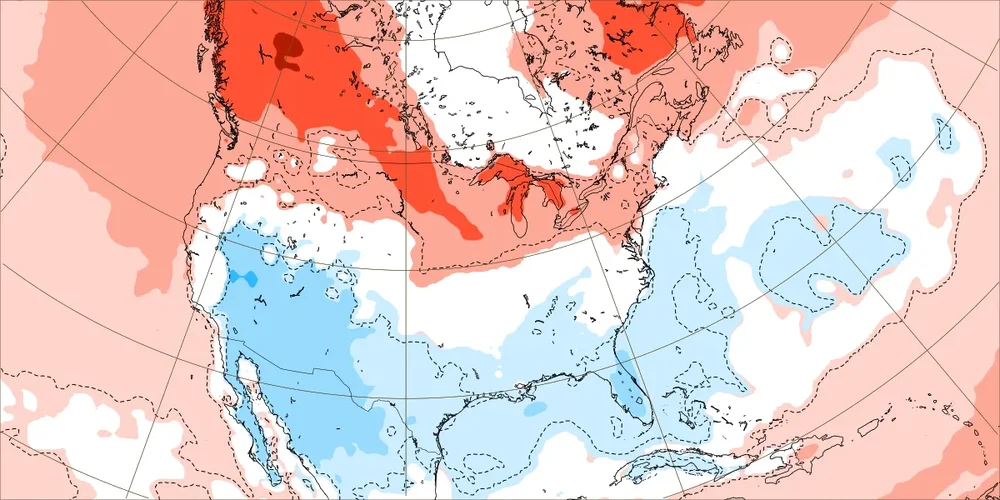
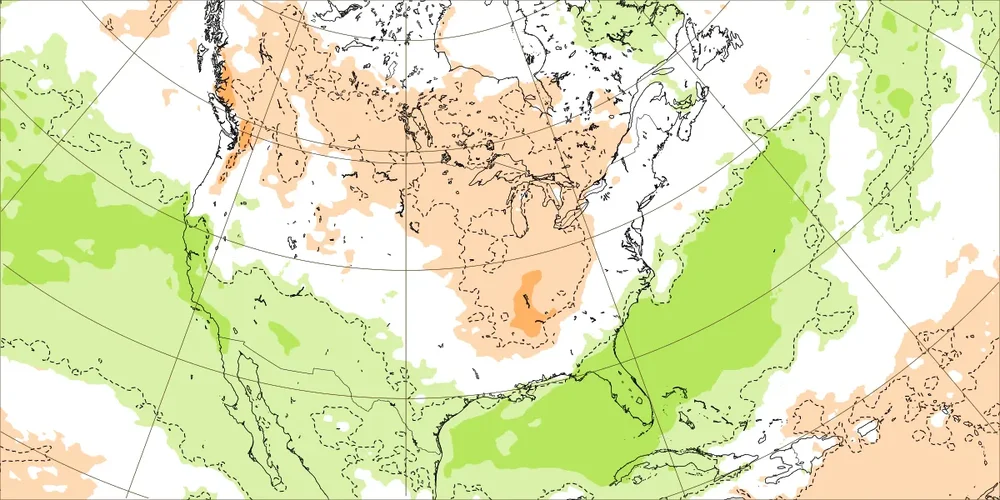
The Euro Weeklies are weaker with the SE cold for Feb 12-19 averaged out vs the run 3 days ago, which is due to a little can kicking/short delay in the start of the BN. One can see that delay by comparing the EPS daily maps for Feb 11-12 over the last couple of days. Fri’s Jan 26 run: pretty solid signal for BN SE Feb 12-19 Today’s (Jan 29) run: weaker BN signal in SE for Feb 12-19 due to delay Otherwise, the Euro Weeklies are about the same (Feb 19th+) calling for a pretty solid BN signal for 3 weeks into early March. The best opportunity for a Miller A GOM based SE winter storm in the Weeklies still appears to be during the subsequent week, Feb 19-26, though that leans more toward NC/SC/GA (more qpf).
- 750 replies
-
- 4
-
-
- snow elk
- wooly worm
- (and 1 more)
-
Trend of 12Z models overall continues with the idea of a much weaker cold press from the NE/lowered wintry threat for most of the SE without that strong cold air that was on yesterday’s models and today’s 0Z ICON. There’s still time for a reversal or the possibility of some wintry from the cold air upstairs associated with the upper low, but my overall interest from a wintry aspect has dropped significantly from where it was yesterday. It was too warm for wintry when it first showed up and has now gone back in that direction quite a bit though not entirely as of yet.
-
Far different from 0Z ICON. Cold press to the NE significantly weaker vs 0Z and further N track of storm.
-
The Weeklies clearly moderated over the weekend vs those with a stronger cold signal late last week. Also, there are some signs of can kicking of the start of the good pattern.
-
Here's the 0Z ICON clown, which I'd obviously love to verify with its 3" of snow imby (would be biggest snow since Dec of 1989) but am not at all buying now considering how much warmer are the GFS/Euro suites, the general inferiority of this model vs those, how much colder this run is vs yesterday's 12Z ICON, it still being out a week, and the extreme rarity of snows like this here:
-
The 6Z EPS continues the 0Z Euro suite trend toward a further NE trough/less cold air available for this storm.
-
OTOH I just saw that the 0Z ICON was much colder than its 12Z run along with some snow and similar to the cold 18Z and prior GFS runs. (For whatever reason, the extended portion didn’t come out until much later.) This is very much a fwiw and I‘m not buying it considering the trend of the 0Z Euro and 0Z/6Z GFS suites, which will need to reverse course to revive any significant non-mountain SE wintry prospects from this storm.
-
The idea of there being much less cold air to the north in advance of any storm on the 0Z GFS suite was also on the 0Z Euro suite vs its 12Z run as well as on the 6Z GFS suite. Not a good trend on these last two GFS suites or the 0Z Euro suite for SE wintry prospects as they’re too warm. They’re going to need to reverse course or else that would be all she wrote for SE wintry prospects from this system.
-
The further north track and warming from recent GEFS runs to the 0Z GEFS is similar to the 0Z op GFS. The source of cold to the north in advance is much warmer than in recent runs.
-
Feb is setting up to be quite an interesting month this year in the SE as it often is during El Niño. Some and possibly many will ultimately be disappointed but hopefully many will instead be pleased. Regardless, the forecasting discussion threads should be quite interesting and busy as we speculate on possibilities!
-
Now look how low the OHC is: ~+0.25
-
Fixed your post.
-
-23, -22
-
Take it with a grain/don’t trust it, but fwiw the new Euro Weeklies run is easily the coldest overall yet for mid Feb through early Mar. Once the BN temperatures set in Feb 12-19, they remain through the end of the run (Mar 4-11). The week of Feb 19-26 is by far the coldest for that week of any run yet and may, when also considering El Niño climo, have the most winter storm potential in the SE of any single week per this run with Miller A/GOM potential written all over it (combo of Aleutian Low/+PNA, -NAO, -AO, and moist subtropical flow/split flow):


-
Indeed, we may. I had thought these last 3 days were going to be more negative than they ended up being. It may be close.
-
Not in the least bit. This is purely for fun, bragging rights, and contest purposes. It will be in the record. Don’t forget that we have a contest in another thread. Edit: In light of the next post, I want to restate that this would make a difference between strong and super on an UNROUNDED basis, which I go by since we have the unrounded available. I call +1.50 to +1.99 strong and +2.00+ super-strong. For those going by rounded (i.e., what shows in the well-known table), it will be quite difficult for it not to end up at +2.0 unless the ERSST/OISST relationship were to be far different in Jan vs the Aug-Dec average.