ncforecaster89
-
Posts
1,224 -
Joined
-
Last visited
Content Type
Profiles
Blogs
Forums
American Weather
Media Demo
Store
Gallery
Everything posted by ncforecaster89
-

The “I bring the mojo” Jan 30-Feb 1 potential winter storm
ncforecaster89 replied to lilj4425's topic in Southeastern States
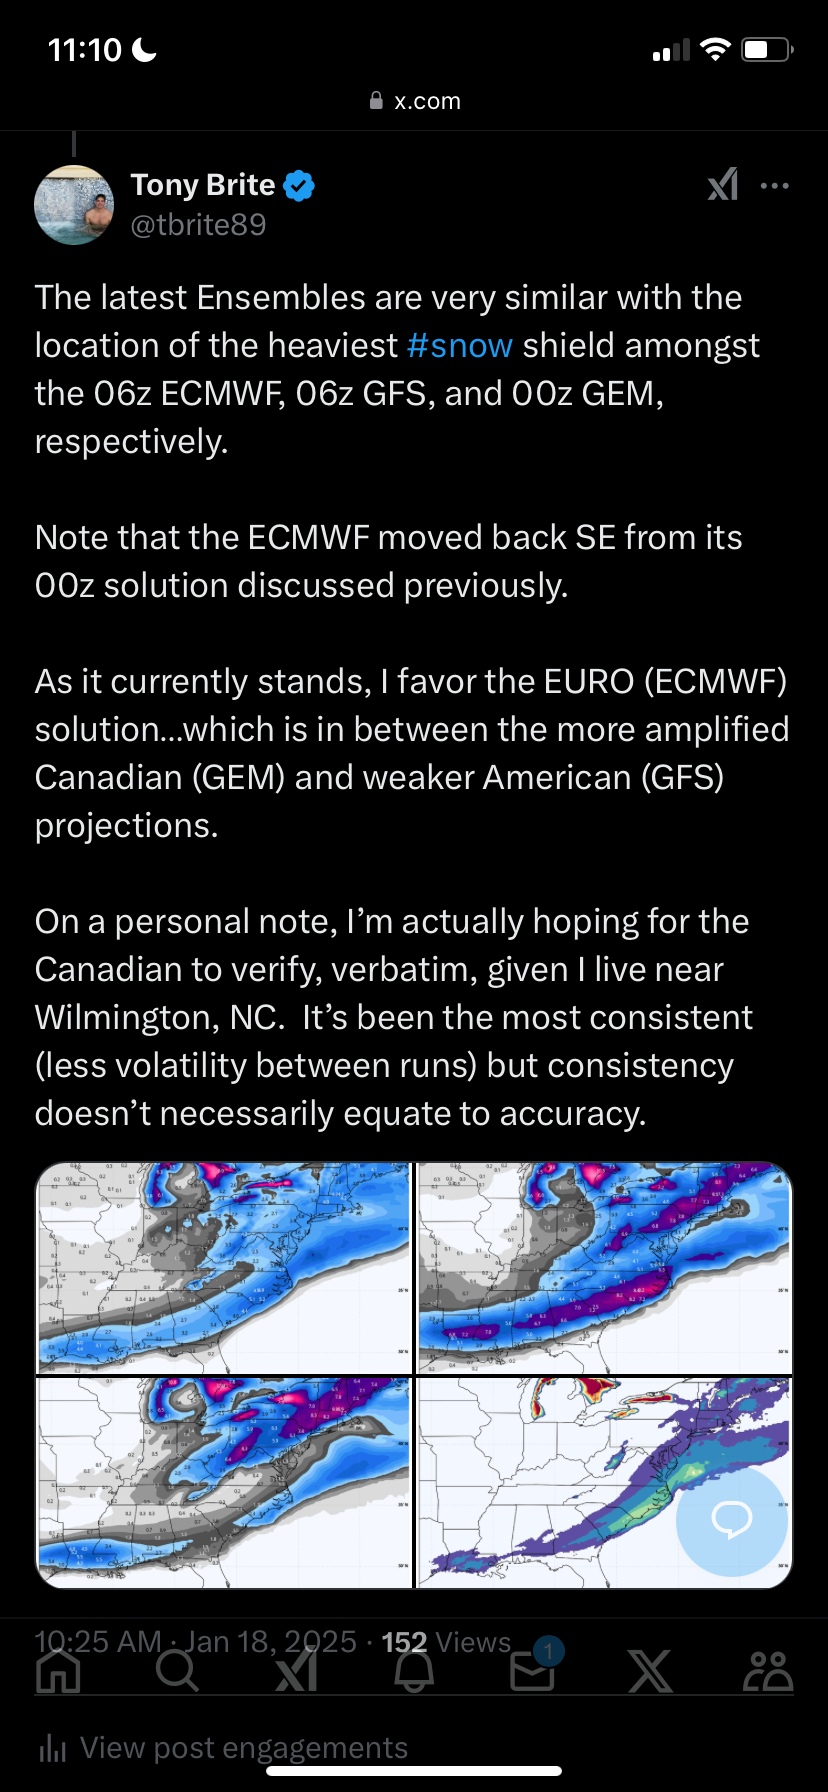
My latest thoughts: https://x.com/tbrite89/status/2016862389610668160 -
The “I bring the mojo” Jan 30-Feb 1 potential winter storm
ncforecaster89 replied to lilj4425's topic in Southeastern States
It’s most prudent to start conservative and make incremental changes (increasing totals) than potentially having to go the other way. -
The “I bring the mojo” Jan 30-Feb 1 potential winter storm
ncforecaster89 replied to lilj4425's topic in Southeastern States
I’m not telling anyone anything they don’t already know, but there’s still plenty of time for significant changes (good or bad). It’s for this reason that it’s important not to get too emotionally high, either way, from one model cycle to the next. For example, I’m naturally most concerned with what the SE coast of NC gets being that it’s where my family and I live. Although things currently look good for us, I’m well aware of just how quickly things can change with relatively minor adjustments synoptically. The peak of the storm would occur around midnight on Sunday (Saturday overnight), which is still about 66 hours out. Having literally been tracking and forecasting in eastern NC for more than 35 years, I know the importance of keeping one’s expectations in check and that it’s best to retain a more cautious approach with the snow accumulation projections until we get inside the 36-48 window from peak conditions (not simply the start of the event). All that said, I’m genuinely hoping for an event that’s most pleasing to the vast majority of this board/sub-forum! -
The “I bring the mojo” Jan 30-Feb 1 potential winter storm
ncforecaster89 replied to lilj4425's topic in Southeastern States
https://x.com/tbrite89/status/2016579926112010698 A football analogy to characterize how I view our current position on the field. -
The “I bring the mojo” Jan 30-Feb 1 potential winter storm
ncforecaster89 replied to lilj4425's topic in Southeastern States
Generally speaking, we need to get inside the 48 hour mark for its reliability. -
The “I bring the mojo” Jan 30-Feb 1 potential winter storm
ncforecaster89 replied to lilj4425's topic in Southeastern States
That’s a good first call map, IMO, and I like the more cautious (and responsible) approach. The only tweak I’d make would be a simple mention of “higher localized amounts possible” in your 6-10” zone. It’s obviously still a little early for such specifics, but I’ll be surprised if some areas don’t see a foot. -
Hi Roger! Hope all is well with you and yours. It’s great to see you continuing to keep this tradition alive and all the hard work you put into it is greatly appreciated. I didn’t provide a forecast this season for the contest, myself, as I missed the deadline to do so. That aside, it’s highly likely (85%) that Melissa will achieve major hurricane intensity and the probabilities are increasing (50%) that it might even become a Category 5 tempest. Consequently, the minimum seasonal totals are unlikely to be less than 14/5/4, imho. We may get an additional NS and/or hurricane added to those figures but I think 15/6/4 will be the ceiling, at this point. I’ll share that I had 17/8/4 as my definitive June projections for informational purposes. Thanks again for doing this work! Tony p.s. the probabilities listed above are simply my own best estimates at the time of this posting.
-
1/21-1/22 Winter Storm OBS Thread
ncforecaster89 replied to metalicwx367's topic in Southeastern States
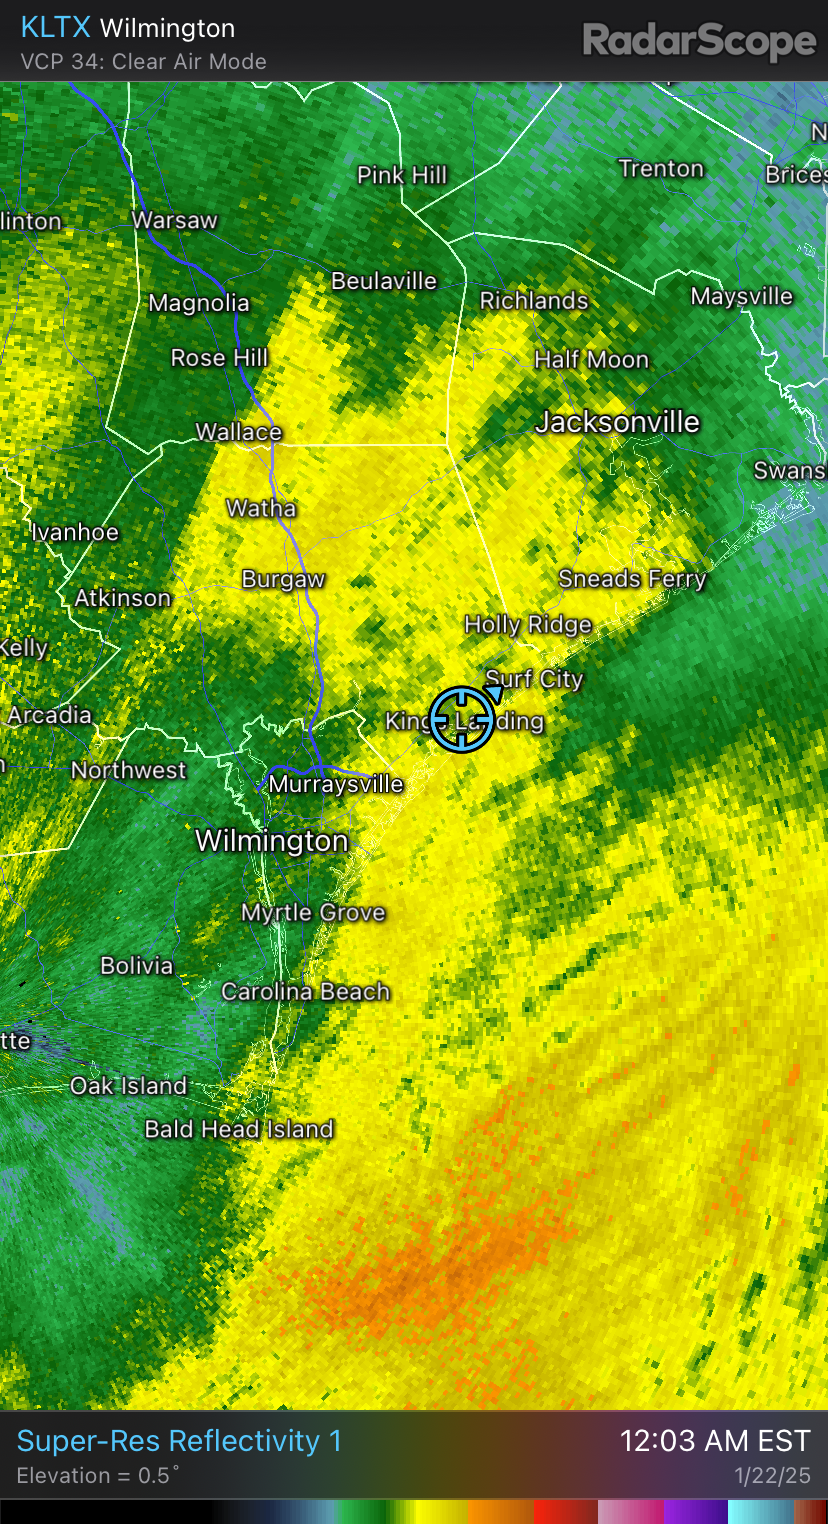
That’s what’s occurring just N of Wilmington, in Hampstead. Sleet coming down extremely hard; wasting serious snow amounts.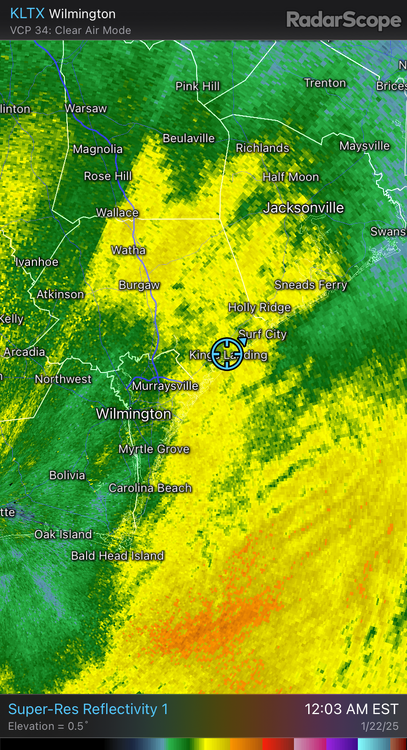
-
1/21-1/22 Winter Storm OBS Thread
ncforecaster89 replied to metalicwx367's topic in Southeastern States
It’ll take 6.5” at Wilmington to become a top 10 event. The record is 15.3” on 12/22-24/1989. -
To be fair, the advancement in computer processing power/modeling has dramatically improved our forecast accuracy, by an incalculable margin. The larger issues relate to both too much public accessibility to long range modeling (and the misuse, thereof) and poor messaging. In this social media age, too many content creators (or what I like to call socialmediarologists) are most interested in engagement farming and it hurts the integrity of the science and trust within the general public, at large. In addition, most don’t truly comprehend/appreciate the immense complexities involved with attempting to predict the weather, accurately, at even the short range. The truth of the matter is that it will always be an inexact science…yet it’s truly amazing how much progress has been made within just the past 30 years. I’ll conclude by stating that not a one of us meteorologists could consistently outperform the more reliable models…which is why we have them in the first place.
-
Bad sign to be honest and is likely a direct result of the aforementioned ingestion of actual in-situ data. It’s not too unusual to see such adjustments in the 60-84 hour range for that very reason. Hence, why I stated we’ve entered the critical 24 hour period for potential significant adjustments and usually a greater consensus amongst the deterministic guidance. Being that I live near Wilmington, NC, I’m going to take that “drink” @calculus1offered a few minutes ago!
-
Not necessary. But thanks anyway. I’ve been doing this for more than 30 years. As such, I know better than to put too much emphasis on any particular solution at these ranges. I was making an objective factual statement that we are just now entering the critical 24 hour period where the respective deterministic guidance typically builds a greater consensus because of the influx of actual in-situ data via sampling of the energy out W.
-
We’re still a relatively long ways out to be forecasting precise snowfall amounts. That said, I’d go with 2-4” for Wilmington, NC at this particular time. Should begin to see an ever-growing model consensus during the next 24 hours as the energy gets better sampled by the sondes.
-
Looking at the NAM beyond 48 hours is fools gold. The same applies to the Kuchera snow maps. If you want best accuracy, use 10:1 around here.
-
Suppression will cause depression
-

-
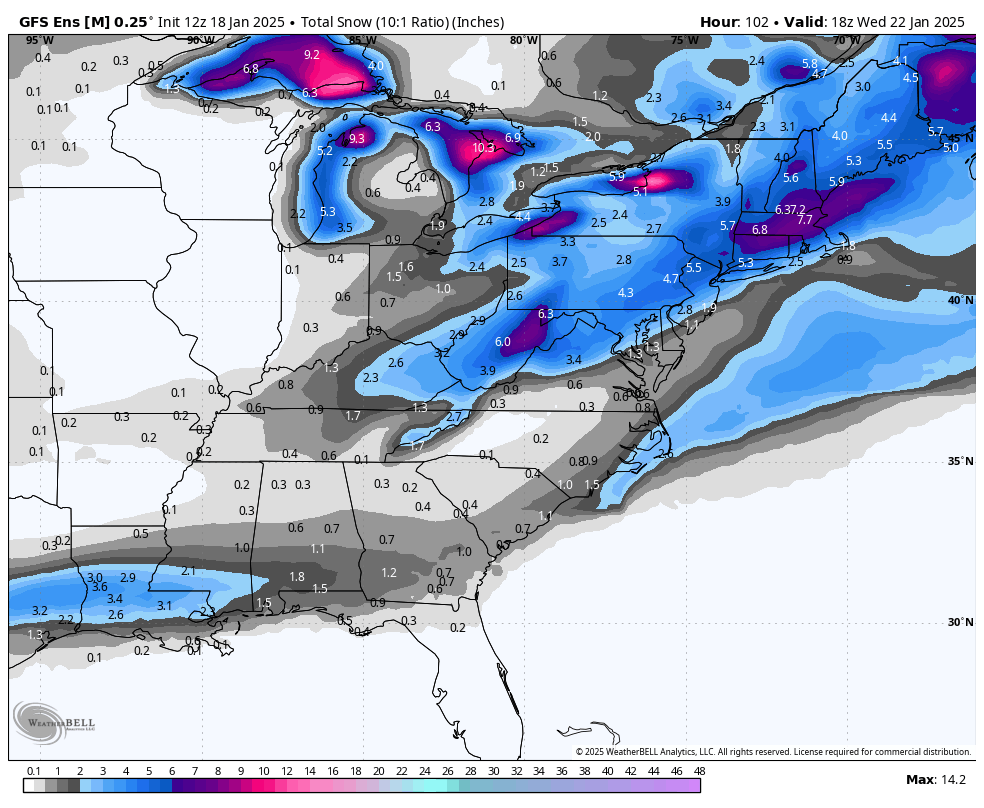
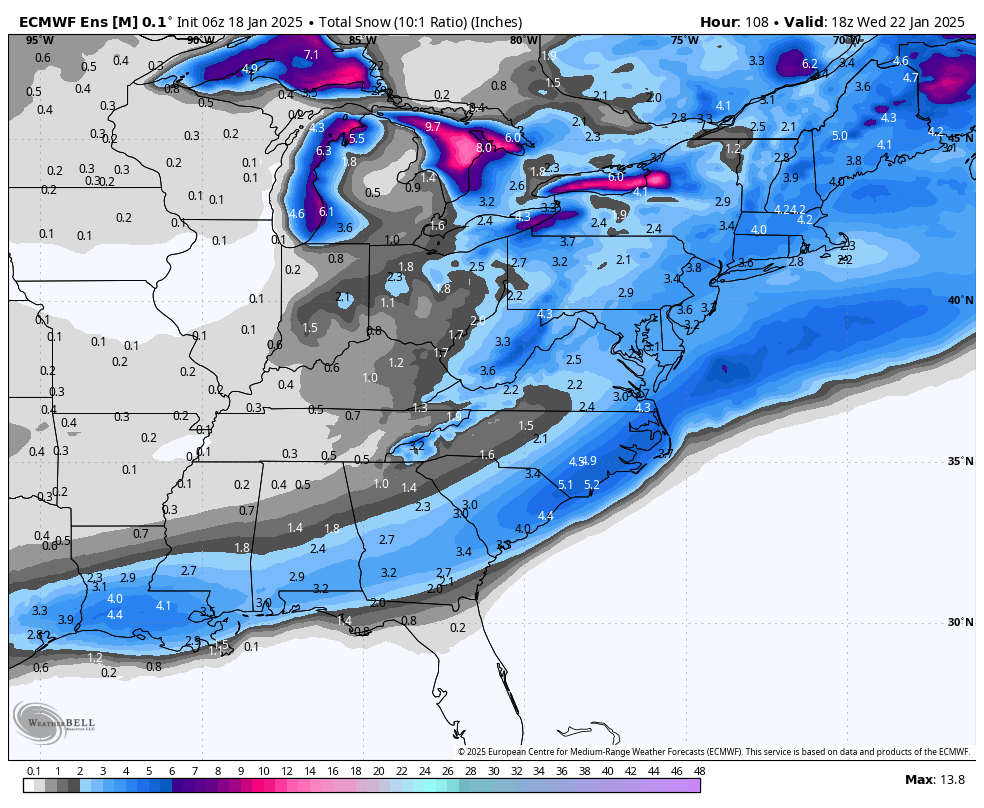
There is a pretty good consensus, currently, with regard to forecast track progression of the low and corresponding area of heaviest snow shield…as can be seen below. Still ample time to change, obviously.

-
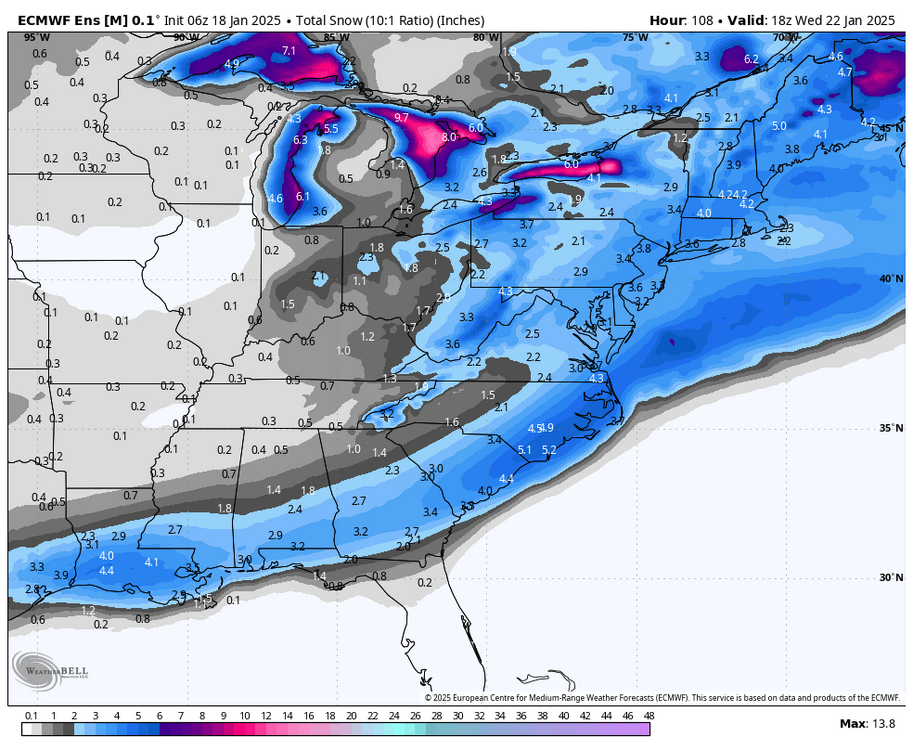
Here is the 10:1 snow mean.
-
I saw 8” on the Outer Banks in a middle January winter storm in 2018. Also, it was accompanied by thundersnow and 30 mph wind gusts at Kitty Hawk. Nothing like that since on the Outer Banks.
-
I respectfully disagree, the same synoptic pattern can still produce a 1989 redux. It’s a rare event for a reason, but it’s happened before and you can be certain it will happen again. Could be next week or 50 years from now, but the climate hasn’t changed that remarkably nor will it.
-
Quick off-topic question: Is WeatherBell that much better than Weather Models? I just purchased access to the latter this evening based on a few others preference for it. I really like the looks of these WxBell graphics you’re posting.
-
Me, too! But, I’m not looking at any deterministic runs until we’re inside 186 hours and even then, we need to be within 96 hours to really trust the signal. Still a long ways to go. That said, it’s better to see something at 200 hours than nothing at all. Just trying to keep things in their proper perspective.
-
Hi Ray! Nice to see you’re still doing it. I’ll add that If the pattern relaxation is delayed, then I also would adjust that period, accordingly.
-
As I’ve mentioned repeatedly on my Twitter account (since late December), I’ve always favored the forthcoming period of 1/19 to 2/3 for the greatest potential (enhanced probability) of getting a major east coast storm. This long range expectation has been, and continues to be, based on the premise that the majority of MECS’ have occurred during a period when a highly favorable background state begins to see a pattern relaxation. Does that mean there will definitely be a MECS at that time? Of course not. However, I do believe it provides an increased probability of its occurrence. For definitive purposes, I should note that I’m specifically taking about the prospects for a MECS somewhere between NC and SNE or actually encompassing both the Mid-Atlantic and NE regions. It'd be foolish to be more precise than that beyond a 7 day time frame, so I’ll just leave it at that that until we get closer in time.
-
Most certainly suspect they are thinking rain in the east. Of course, 8-15 days out is a virtual eternity for such prognostications…especially for specifics.