ncforecaster89
-
Posts
1,224 -
Joined
-
Last visited
Content Type
Profiles
Blogs
Forums
American Weather
Media Demo
Store
Gallery
Everything posted by ncforecaster89
-
I was right in the middle of that mess from 1030 am into 630 am this morning. Took me 20 hours to travel less than 50 miles from around mile marker 106 to 156 on I-95 N (between Ladysmith and Woodbridge, VA). The predominant issue was countless tractor-trailers getting stuck and/or being unable to get traction to move on the icy roads. The secondary issue was the typical impatient and reckless drivers causing unnecessary accidents when they inevitably got stuck. This doesn’t include the few plows we saw that closed one lane by unconsciously plowing snow into said lane making it impossible for tractor-trailers to move. The other things you noted obviously contributed to this disaster, but I’m simply sharing firsthand observations that made it 10x worse.
-

Central PA - Winter 2021/2022
ncforecaster89 replied to Bubbler86's topic in Upstate New York/Pennsylvania
Merry Christmas to you and everyone else, here. As always, I’m spending Christmas at my wife’s family home in Lancaster. -
2021 Atlantic Hurricane season
ncforecaster89 replied to StormchaserChuck!'s topic in Tropical Headquarters
It’s not a perfect science, so it’s unlikely we’ll ever truly know the exact intensity of storms such as Irma, Michael, and Dorian. It appears that the SFMR isn’t the most reliable tool/method in determining the strength of these high-end systems. Although imperfect, flight-level Recon wind obs and dropwindsounde data (especially WL-150 winds) are far more trustworthy for assessing intensity…as a result of long-term application and research. Given the aforementioned, and the fact the SFMR measurements are the only data supportive of an intensity greater than 145 kt…it’s likely the peak surface winds were closer to 150 kt for Dorian. The same applies for Irma, albeit it actually had higher 700 mb FLWs in support of a 150 kt intensity. As well-detailed in the TCR, Michael’s peak intensity was highly likely somewhere in the 140-145 kt range…or about 5-9 kt (6-10mph) below that of Irma and Dorian, respectively. Edit: I suspect the NHC will ultimately revise the respective intensities…as a compromise between the adjusted SFMR recalibration results and the Recon data…to arrive at the following: Dorian: 155 kt Irma: 150 kt Michael: 140 kt -
2021 North Atlantic hurricane forecast contest
ncforecaster89 replied to Roger Smith's topic in Tropical Headquarters
Hi Roger! Thanks for all the work you put into this effort. Just wanted to note that all of us below the 20/9/4 numbers should be listed a position higher (e.g. after BKViking, since they have the same forecast as WxWatcher007). By counting both, as equal, we get unfairly knocked down a place…due to our efforts to provide a distinct forecast from everyone else. Edit: This post isn’t meant to disparage BKVing and it’s not a big deal, necessarily. I’m just big on fairness in general. -
“Ida” is a prime example of why I wish the NHC would add the descriptive term of “Super” for major hurricanes with a MSW of 130 kt or greater…similar to the WPAC. Reasoning being there is a significant difference in the ferocity of the wind and its destructive ability at these velocities in comparison with those at the lower-end of the Cat 4 range.
-
To better understand (determine) how that 223 mph instantaneous wind gust corresponds to a one-minute sustained wind speed at standard height…one can use the power law to covert from that 30 meter height to 10 meters elevation. First, we need to convert the instantaneous gust to a 1-minute sustained wind speed. Extensive research https://www.yumpu.com/en/document/view/12031496/estimating-3-second-and-maximum-instantaneous-gusts-from-1-/3 has shown that an instantaneous wind gust can be converted to a 1-minute wind speed by a factor of 1.45. In this case, it would translate to 154 mph. Then, we’ll simply use the power law equation to extrapolate the aforementioned 154 mph wind at 30 m to a 10 m equivalent. To do so accurately, you need to utilize the appropriate surface roughness length. In this case, I’m using 0.10 for open ocean. This converts to a 139 mph (120 kt) one minute sustained wind value. That’s a very impressive in-situ measurement to be captured at landfall in Port Fourchon. Given its highly unlikely that any anemometer would be positioned perfectly to capture the highest wind speed in the eyewall, and taking into account that the strongest winds were likely found just to the E…this measurement provides excellent additional support for the operational intensity of 130 kt.
-
2021 Atlantic Hurricane season
ncforecaster89 replied to StormchaserChuck!'s topic in Tropical Headquarters
You’re correct, as I totally missed that particular season and the 2015 season. That’s what I get for relying on memory lol Thus, its actually only been 6 years (feels like so much longer) since there’s been a season without an October formation. Thanks for catching my aforementioned error. Interestingly, they (2006, 2015) were both El Niño years, as well. -
2021 Atlantic Hurricane season
ncforecaster89 replied to StormchaserChuck!'s topic in Tropical Headquarters
Very true, Amped! Not since the 1993 season has there been no TS or H formations after September 30. 1994 for last “October” without a NATL basin TC. I’d be very surprised if the season concludes without at least one additional TS. In contrast, I’ll be very surprised if the U.S. mainland experiences another hurricane landfall, however. -
2021 Atlantic Hurricane season
ncforecaster89 replied to StormchaserChuck!'s topic in Tropical Headquarters
Although 5 of the 6 U.S. hurricane landfalls were intensifying or steady-state at landfall…only two actually had well-defined eyewall structure (Hanna & Laura)…as you alluded to. Laura the best of those six: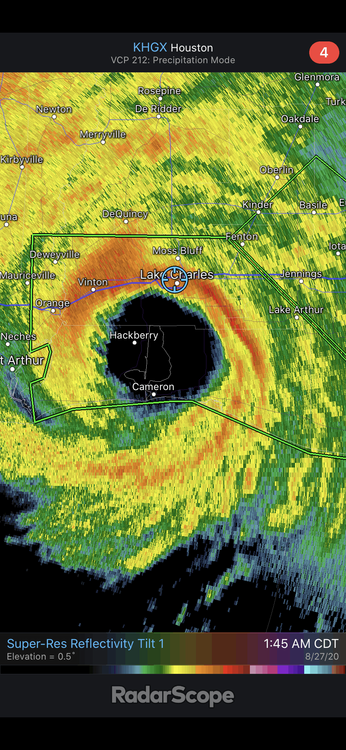
-
2021 Atlantic Hurricane season
ncforecaster89 replied to StormchaserChuck!'s topic in Tropical Headquarters
Personally, I’d rate them in the following order (2002-2021): (U.S. mainland only) 2005: (6 H strikes/4 MHs/Katrina) 2004: (6 H strikes/3 MHs/Charley) 2017: (3 H strikes/2 MHs/Harvey, Irma) 2020: (6 H strikes/3 MHs/Laura) 2018: (2 H strikes/1 MH/Michael) 2021: (2 H strikes/1 MH/Ida) 2008: (3 H strikes/0 MHs/Ike) 2012: (2 H strikes/0 MHs/Sandy) 2016: (2 H strikes/0 MHs/Matthew) 2003: (2 H strikes/0 MHs/Isabel) 2011: (1 H strike/0 MHs/Irene) 2014: (1 H strike/0 MHs/Arthur) 2002: (1 H strike/0 MHs/Lili) 2019: (2 H strikes/0 MHs/Dorian) 2007: (1 H strike/0 MHs/Humberto) 2006: (0 H strikes/0 MHs/Ernesto) 2010: (0 H strikes/0 MHs/Earl) 2015: (0 H strikes/0 MHs/Bill) 2009: (0 H strikes/0 MHs/Ida) 2013: (0 H strikes/0 MHs/Andrea) The list is naturally subjective. Speaking of subjective analysis, you’ll notice the inclusion of “Sally” as a MH (in the totals) for the 2020 season, as the data supports a 100 kt landfall intensity…in my personal opinion. It’s also important to note that “Ernesto” of 2006 may have actually achieved a 65 kt Cat 1 intensity, at landfall, as mentioned in its TCR. Also, H Earl of 2010 brought HF winds to the Outer Banks of NC even though it passed 90 nm offshore to the E. Gave 2015 the edge over the subsequent two seasons, shown on the aforementioned list, in deference to the historic flooding that occurred in SC…caused in part by MH Joaquin. Edit: Could possibly move 2002 above 2014 considering the significant impact of TS Isidore. -
Actually, there’s more evidential data to support 145 kt than 135 kt…much less 140 kt. SImply put, It was most certainly a Cat 5.
-
Yeah I get the suspect meso/microvortices directtional changes and the 700mb 10% reduction but there was plenty of redundant data to support 130-135 kts / 155 mph on the advisory package. Either way, still an impressively intense Category 4 Cape Verde hurricane. I’d set it at 130 kt/150 mph and threw out the P/W relationship in leu of having direct in-situ data (I.e, Recon). Very surprised to see “Stewart” going with the conservative estimate, being he’s typically the HWRF of NHC f’casters.
-
2021 Atlantic Hurricane season
ncforecaster89 replied to StormchaserChuck!'s topic in Tropical Headquarters
Ida is a relatively rare event that has generally only occurred about once every 15 years on average. The important caveats are that quite a few others were likely missed during the late 19th and early twentieth centuries, as well as other hurricanes that may have been stronger than currently analyzed in the historical record (1851-2021). All U.S. Hurricane Landfalls (=/> 130 kt) 8/10/1856, 8/20/1886, 9/10/1919, 8/14/1932, 9/02/1935*, 8/17/1969*, 8/26/1992*, 8/13/2004, 10/10/2018*, 8/27/2020, 8/29/2021 * Cat 5 All others 130 kt/150 mph Cat 4 When also taking into account the 125 kt/145 mph Cat 4’s (1926, 1928, 1960, 1961)…which could well be underestimated…it reduces to an average of 1 per 11 years, on avg. Essentially, it’s a once a decade event. Note, too, that there tends to be multiple occurrences within a very short time span, followed by a significant respite lasting a much longer period, relative to the mean. In short, one shouldn’t anticipate a hurricane of Ida’s extreme intensity to make landfall on the U.S. mainland more than once a decade, on average, and it’s possible it’ll be quite a bit longer than that. -
Completely concur with this assessment, unfortunately, as I’d like to see an East Coast landfall. Edit: But, there’s a reason I very rarely comment on a solution beyond 5-7 days. Specifically, there’s ample time for the synoptic pattern to change just enough to effect the eventual track. For those, like myself, who desire an EC strike, the current deepening trend is not welcome news and will likely mean a further N propagation of the track as it passes the Islands.
-
Just wait for the next strong El Niño or a redux of 2013. They will happen in your lifetime if you live at least another five years…which I certainly hope you do!
-
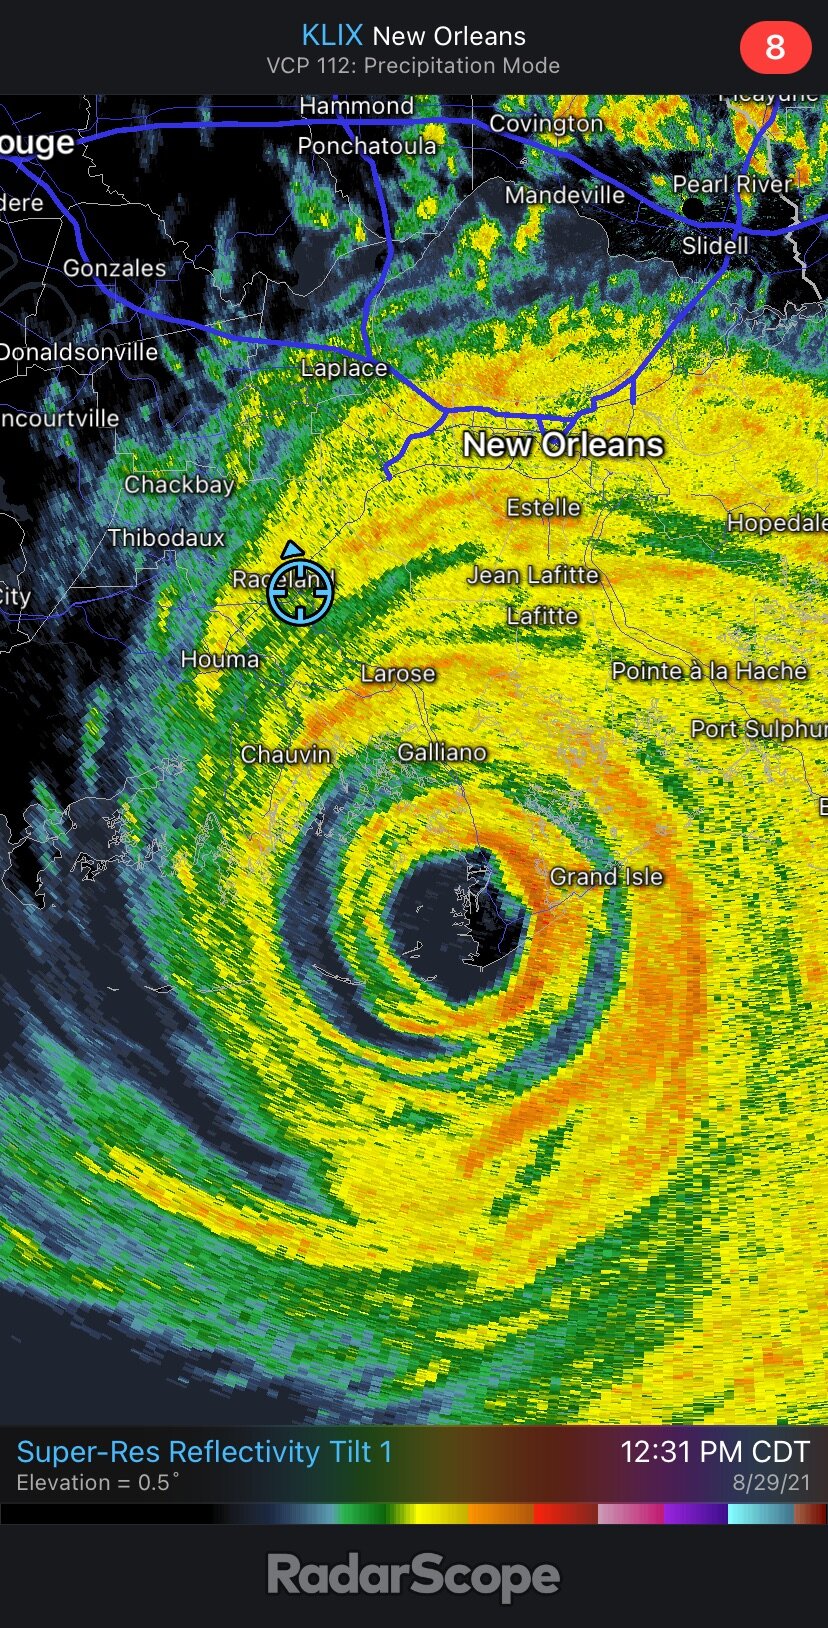
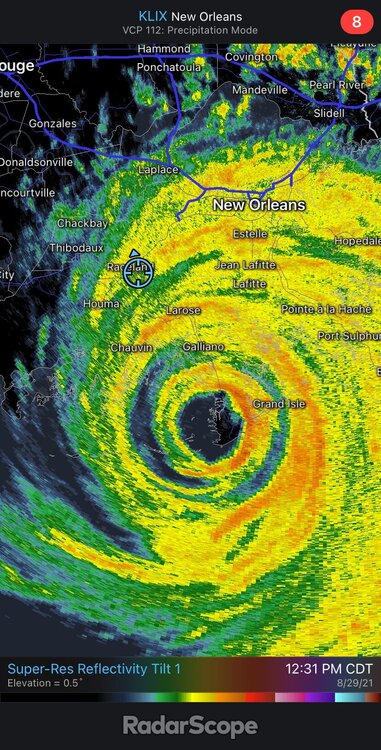
You’re absolutely correct. I’ll add that the strongest winds measured by Recon (located in the innermost portion of the E eyewall) actually moved in between the two aforementioned locations…with Grand Isle likely getting higher winds than Port Fourchon. See attached radar image, below. It’s important to remember that the most intense winds are generally located in the innermost portion of the NE eyewall…as the winds are not uniformly distributed throughout the eyewall, as some incorrectly assume.
-
Mods: please feel free to move both the post from Normandy and my own (as I wouldn’t have made mine without theirs) to banter…if you feel appropriate, as I don’t think either belong here. Thanks, Tony
-
First of all, I’m a meteorologist first and foremost…and a chaser/weather enthusiast, second. This means I’m far more concerned with the accuracy of scientific data than anything else. Your ignorant assumption that I give two cents about supposedly “angling to keep Michael greater than x” has zero merit! As for Dorian, I’ve already given my unbiased, wholly objective scientific opinion (has nothing whatsoever to do with me) as to why I still believe the winds in Michael (at the west end of MX Beach) were just a little stronger than what anyone experienced in Marsh Harbor. It’s not just simply the video evidence (as it’s virtually impossible to accurately compare wind speeds at such extreme velocities), but also the fact that the strongest winds of Dorian remained well N of that area, and offshore, thankfully. Despite your false presuppositions, I genuinely could care less if someone records stronger winds on video than myself. Why would I? I’m not that kind of narcissistic, immature, attention-seeking individual…but nice try to discredit my well-reasoned viewpoint. There will be many far more intense tropical cyclones in the WPAC, for example, that I’m sure one day someone will capture even stronger winds than I saw in Michael. It certainly won’t be me, because I have no interest whatsoever in chasing TCs outside the U.S. mainland. For me, I don’t chase hurricanes to bring attention to myself, but rather to share that experience with others. How many selfie’s have you ever seen of me? Furthermore, I stay behind at least 1-2 days following each intercept to help in the cleanup…not rushing to get out of the area to showcase the footage I captured. I bring these things up simply to highlight how misguided and ignorant your mischaracterization of me and my motives truly are…not to begrudge other chasers who may choose to do things differently. Back to Ida, “instantaneous” wind gusts are exactly that; they aren’t even of 1 second duration. As I stated in the post you found so objectionable, those wind gusts should be viewed in their proper context. Instead, I keep reading posts all over social media wrongly assuming these measurements correspond to a category-five MSW at 10 m. That aside, we can agree that it’s an impressive recorded value, regardless.
-
As I’ve been discussing on Twitter, it’s important to recognize that the Port Fourchon measurement was an instantaneous gust and not representative of the standard three-second value. It’s just not simply the fact that it was also measured above 30 m height. Moreover, we have no idea as to the capability of said anemometer to accurately record wind speeds at such high velocities. Some might recall the 212 mph observation during hurricane Andrew that was subsequently revised to 177 mph after tunnel testing of that particular model. These important points aren’t to minimize the fact hurricane Ida was most certainly a high-end Cat 4 at landfall, but rather to view these elevated and instantaneous wind gust measurements in their proper context. All the collective data is supportive of the operational landfall intensity of 130 kt. At its peak (roughly 3.5 hours preceding landfall), I’d argue for 135 kt…based mainly on the 148 kt 700 mb FLWs measured by Recon.
-
The most unfortunate part of Ida’s track is that it drove the highest storm surge into Grand Isle. It’s also important to note that the aborted ERC that made Ida a double-eyewall hurricane likely contributed to the devastation left in its wake.
-
Those images look way too familiar to what I observed in the aftermath of Hurricane Michael in Mexico Beach. The bare slabs and the shredded upper-levels of some homes are eerily similar! It was every bit of a high-end category four wind producer combined with a catastrophic storm surge. Goes to show that it doesn’t technically have to be a category-five hurricane to produce catastrophic damage! I like the way 130 kt is characterized as a super Typhoon in the WPAC as a TC of such intensity is truly a “super” destructive storm.
-
As a veteran storm chaser and one who was stranded in Mexico Beach (because I lost my car to the surge by placing myself within 400 yards of the GOM and in the RFQ of the inner-eyewall of hurricane Michael), I have very little sympathy for chasers who intentionally get too close and THEN, except others to risk their own lives to help/save them! When I made the aforementioned similar/foolish decision, I accepted responsibility for my actions and dealt with the consequences (which weren’t fun). I could be wrong, but there seems to be too many chasers trying to one-up the others and their corresponding attention-seeking, selfie-centered attitude has been leading to more of these situations. Unfortunately, I expect we’ll continue to see this occur on a more regular basis, as the years go by. To avoid any misinterpretations, I want to clarify that my issue isn’t that they chose to get that close, but rather, the expectation that someone should help them…that would require someone else to endanger their own lives in the process. P.S. Mods, please move this post to banter if you feel it belongs there, instead.
-
2021 Atlantic Hurricane season
ncforecaster89 replied to StormchaserChuck!'s topic in Tropical Headquarters
Me neither! Must be a new type of differential equation. After all, it was the least favorite course I took towards obtaining my meteorological degree...aside from Calc II. Then again, I’m not sure anyone could decipher it. -
2021 Atlantic Hurricane season
ncforecaster89 replied to StormchaserChuck!'s topic in Tropical Headquarters
It’s still a little early, relatively speaking, and we’re right on schedule for a typically active hurricane season. You’ll see...the ocean and atmosphere have steadily been building the right environment, and they’re going to come. -
2021 Atlantic Hurricane season
ncforecaster89 replied to StormchaserChuck!'s topic in Tropical Headquarters
I’m also in eastern NC (Wilmington) and share the same concerns. As a result of Florence in 2018, my house sustained more than $12,000 in damage from the wind providing entry through the roof for the torrential rains to damage the sheet rock. Don’t wish such hardship on anyone else. Interestingly, Wilmington has been struck directly by the eyewall of 10 separate hurricanes and an additional TC of borderline TS/H intensity during the past 25 years...far exceeding every other town/city in the U.S., during that time. Based on all the major oceanic and atmospheric teleconnections, there’s an increased risk that there will be multiple U.S hurricane landfalls for the 6th consecutive season. If, and more likely when, they occur, I fully intend to be in the eyewall to document the brunt of their fury.