donsutherland1
-
Posts
24,117 -
Joined
Content Type
Profiles
Blogs
Forums
American Weather
Media Demo
Store
Gallery
Everything posted by donsutherland1
-
Tomorrow will be fair and hot with highs in the upper 80s and lower 90s. Should Central Park reach 90°, 2026 would become the first year on record that New York City had a high of 80° or above in March and highs of 90° or above in April, May, and June. Some showers or thundershowers are possible early Sunday. Highs will still reach the lower and middle 80s. Somewhat cooler conditions early next week will give way to a return to above normal temperatures for the remainder of the week. The ENSO Region 1+2 anomaly was +2.2°C and the Region 3.4 anomaly was +1.0°C for the week centered around May 27. For the past six weeks, the ENSO Region 1+2 anomaly has averaged +1.80°C and the ENSO Region 3.4 anomaly has averaged +0.90°C. The ongoing El Niño will continue to strengthen through the summer. The SOI was -29.81 today. The preliminary Arctic Oscillation (AO) was +1.795 today.
-
2026-2027 Super El Nino
donsutherland1 replied to Stormchaserchuck1's topic in Weather Forecasting and Discussion
It might not be as east-based as either of those two ENSO events, but there's still a lot of time before the anomalies peak. It looks solidly east-based, perhaps evolving into a basinwide event as it weakens. -
2026-2027 Super El Nino
donsutherland1 replied to Stormchaserchuck1's topic in Weather Forecasting and Discussion
Yes. It's looking like a monster east-based El Niño event. -
Tomorrow and Saturday will be very warm days with highs in the upper 80s and lower 90s. Should Central Park reach 90°, 2026 would become the first year on record that New York City had a high of 80° or above in March and highs of 90° or above in April, May, and June. Saturday will remain warm before somewhat cooler air arrives to conclude the weekend. Some showers or thundershowers are possible early Sunday. Cooler conditions early next week will give way to a return to above normal temperatures for the remainder of the week. The ENSO Region 1+2 anomaly was +2.2°C and the Region 3.4 anomaly was +1.0°C for the week centered around May 27. For the past six weeks, the ENSO Region 1+2 anomaly has averaged +1.80°C and the ENSO Region 3.4 anomaly has averaged +0.90°C. The ongoing El Niño will continue to strengthen through the summer. The SOI was -35.29 today. The preliminary Arctic Oscillation (AO) was +1.920 today.
-
A warming trend is now underway. Tomorrow should see temperatures top out in lower 80s and perhaps middle 80s. Friday and Saturday will be very warm days with highs in the upper 80s and lower 90s. Should Central Park reach 90°, 2026 would become the first year on record that New York City had a high of 80° or above in March and highs of 90° or above in April, May, and June. Saturday will remain warm before somewhat cooler air arrives to conclude the weekend. The ENSO Region 1+2 anomaly was +2.2°C and the Region 3.4 anomaly was +1.0°C for the week centered around May 27. For the past six weeks, the ENSO Region 1+2 anomaly has averaged +1.80°C and the ENSO Region 3.4 anomaly has averaged +0.90°C. The ongoing El Niño will continue to strengthen through the summer. The SOI was -34.80 today. The preliminary Arctic Oscillation (AO) was +1.384 today.
-
2026-2027 Super El Nino
donsutherland1 replied to Stormchaserchuck1's topic in Weather Forecasting and Discussion
Yes. Precipitation wasn't the problem. The region was flooded with too much warmth. It will be interesting to see how things unfold with the upcoming super El Niño. -
2026-2027 Super El Nino
donsutherland1 replied to Stormchaserchuck1's topic in Weather Forecasting and Discussion
15.28" (8th highest). -
This morning was unseasonably cool. It may well go on to be the coolest morning of the summer. Lows included: Atlantic City: 45° Bridgeport: 48° Islip: 46° New York City-Central Park: 52° New York City-JFK Airport: 50° (old record: 51°, 1997, 2003, 2015) New York City-LaGuardia Airport: 55° Newark: 51° Philadelphia: 53° Poughkeepsie: 41° Westhampton: 35° (old record: 39°, 2020) White Plains: 46° (old record: 47°, 1971, 1984, 1988, 1993) A warming trend will commence tomorrow with highs in the upper 70s to perhaps lower 80s. Thursday should see temperatures top out in lower 80s. Friday and Saturday will be very warm days with highs in the upper 80s and lower 90s. Saturday will remain warm before somewhat cooler air arrives to conclude the weekend. The ENSO Region 1+2 anomaly was +2.2°C and the Region 3.4 anomaly was +1.0°C for the week centered around May 27. For the past six weeks, the ENSO Region 1+2 anomaly has averaged +1.80°C and the ENSO Region 3.4 anomaly has averaged +0.90°C. The ongoing El Niño will continue to strengthen through the summer. The SOI was -16.87 yesterday. The preliminary Arctic Oscillation (AO) was +0.714 today.
-
Cooler air will overspread the region tonight. New York City will see lows in the lower 50s in tomorrow morning. Many locations outside the City will experience lows in the 40s. Afterward, temperatures will top out in the lower and middle 70s. A warming trend will commence on Wednesday with highs in the upper 70s. Thursday should see temperatures top out in lower 80s. Friday and Saturday will be very warm days with highs in the upper 80s and lower 90s. Saturday will remain warm before somewhat cooler air arrives to conclude the weekend. The ENSO Region 1+2 anomaly was +2.2°C and the Region 3.4 anomaly was +1.0°C for the week centered around May 27. For the past six weeks, the ENSO Region 1+2 anomaly has averaged +1.80°C and the ENSO Region 3.4 anomaly has averaged +0.90°C. The ongoing El Niño will continue to strengthen through the summer. The SOI was -14.84 yesterday. The preliminary Arctic Oscillation (AO) was +0.407 today.
-
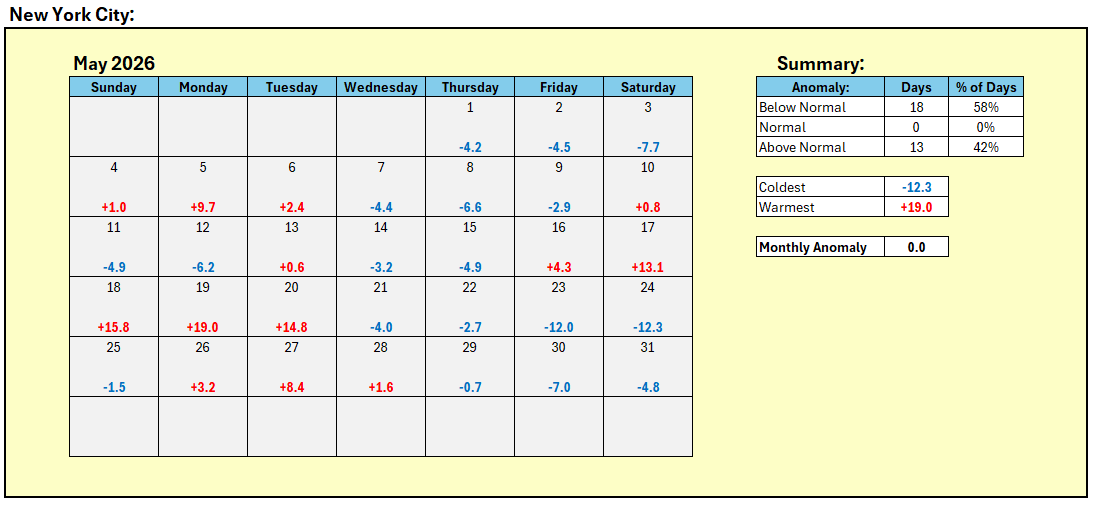
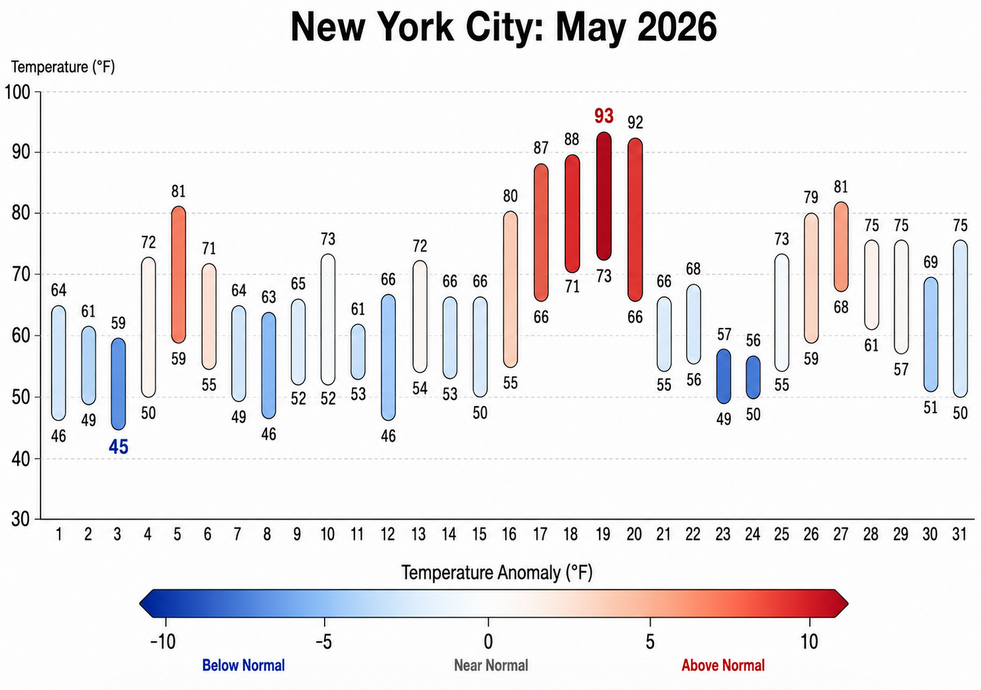
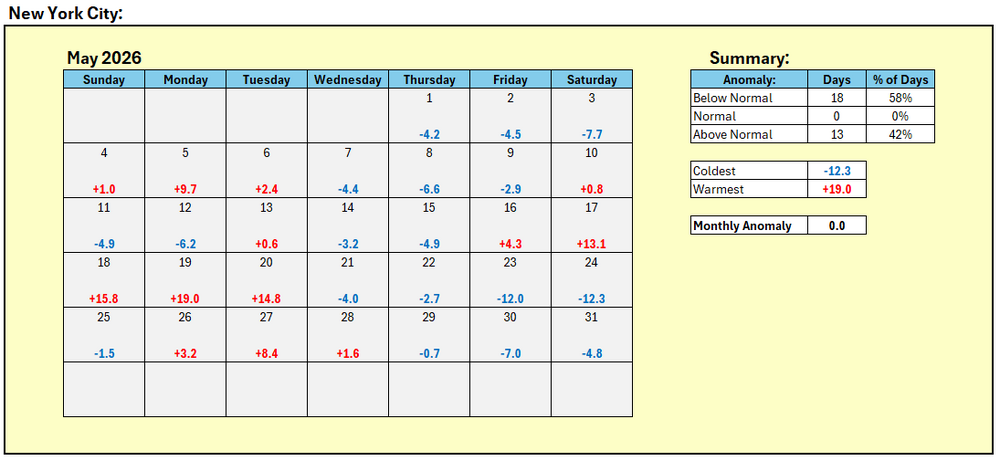
New York City finished May with a mean temperature of 63.2°. That is exactly normal.
-
The day started off with near record low temperatures and even some record lows in parts of the region. Lows included: Allentown: 41° Atlantic City: 43° Bridgeport: 45° Danbury: 37° Islip: 43° New Haven: 43° New York City-Central Park: 50° New York City-JFK Airport: 48° (tied record set in 1966 and tied in 1977 and 2023) New York City-LaGuardia Airport: 54° Newark: 46° Philadelphia: 52° Poughkeepsie: 37° Westhampton: 31° (old record: 34°, 2008) White Plains: 42° Overall, New York City finished May with a monthly mean temperature of 63.2°, which is the normal 1991-2020 value. That was 0.8° warmer than the earlier 1981-2010 baseline. The first week of June will likely see temperatures average somewhat below normal to near normal. However much warmer weather could arrive on Friday and then continue through the first weekend of June. The ENSO Region 1+2 anomaly was +2.1°C and the Region 3.4 anomaly was +1.0°C for the week centered around May 20. For the past six weeks, the ENSO Region 1+2 anomaly has averaged +1.72°C and the ENSO Region 3.4 anomaly has averaged +0.83°C. The ongoing El Niño will continue to strengthen through the summer. The SOI was -14.84 today. The preliminary Arctic Oscillation (AO) was +0.251 today.
-
The temperature surged into the lower 70s before clouds rolled in. Four photos from the New York Botanical Garden:


-
June DCA _ NYC _ BOS _ ORD _ ATL _ IAH _ DEN _ PHX _ SEA 1.5 1.3 1.3 2.2 0.5 0.1 2.4 2.2 1.5 103 99 99 100 98 105 100 117 94
-
That occurred before 1 am EDT, so it was counted as yesterday's low. Records are based on standard time.
-
JFK Airport reached 48° this morning. That tied the daily record set in 1966 and tied in 1977 and 2023.
-
It will turn warmer tomorrow after a chilly start where New York City will start with lows in the lower 50s and many outlying areas will start in the 40s. Temperatures will return to the middle 70s. The first week of June will likely see temperatures average somewhat below normal to near normal. However very warm weather could arrive on Friday and then continue into the first weekend of June. The ENSO Region 1+2 anomaly was +2.1°C and the Region 3.4 anomaly was +1.0°C for the week centered around May 20. For the past six weeks, the ENSO Region 1+2 anomaly has averaged +1.72°C and the ENSO Region 3.4 anomaly has averaged +0.83°C. The ongoing El Niño will continue to strengthen through the summer. The SOI was -26.33 today. The preliminary Arctic Oscillation (AO) was +0.174 today. Based on sensitivity analysis applied to the latest guidance, there is an implied near 63% probability that New York City will have a warmer than normal May (1991-2020 normal). May will likely finish with a mean temperature near 63.3° (0.1° above normal). Supplemental Information: The projected mean would be 0.9° above the 1981-2010 normal monthly value.
-
Tomorrow will be unseasonably cool with highs only in the middle and perhaps upper 60s. Temperatures will return to the middle 70s on Sunday. The first week of June could also see temperatures average somewhat below normal to near noraml. The ENSO Region 1+2 anomaly was +2.1°C and the Region 3.4 anomaly was +1.0°C for the week centered around May 20. For the past six weeks, the ENSO Region 1+2 anomaly has averaged +1.72°C and the ENSO Region 3.4 anomaly has averaged +0.83°C. The ongoing El Niño will continue to strengthen through the summer. The SOI was -33.46 today. The preliminary Arctic Oscillation (AO) was +0.130 today. Based on sensitivity analysis applied to the latest guidance, there is an implied near 52% probability that New York City will have a warmer than normal May (1991-2020 normal). May will likely finish with a mean temperature near 63.3° (0.1° above normal). Supplemental Information: The projected mean would be 0.9° above the 1981-2010 normal monthly value.
-
Tomorrow will be briefly warmer with highs in the middle and upper 70s. Saturday will be unseasonably cool with highs only in the middle and upper 60s. Temperatures will return to the middle 70s on Sunday. The first week of June could also see temperatures average somewhat below normal to near noraml. The ENSO Region 1+2 anomaly was +2.1°C and the Region 3.4 anomaly was +1.0°C for the week centered around May 20. For the past six weeks, the ENSO Region 1+2 anomaly has averaged +1.72°C and the ENSO Region 3.4 anomaly has averaged +0.83°C. The ongoing El Niño will continue to strengthen through the summer. The SOI was -23.11 today. The preliminary Arctic Oscillation (AO) was -0.041 today. Based on sensitivity analysis applied to the latest guidance, there is an implied near 65% probability that New York City will have a warmer than normal May (1991-2020 normal). May will likely finish with a mean temperature near 63.5° (0.3° above normal). Supplemental Information: The projected mean would be 1.1° above the 1981-2010 normal monthly value.
-
Occasional Thoughts on Climate Change
donsutherland1 replied to donsutherland1's topic in Climate Change
Today was another day of blazing heat in France.
-
Occasional Thoughts on Climate Change
donsutherland1 replied to donsutherland1's topic in Climate Change
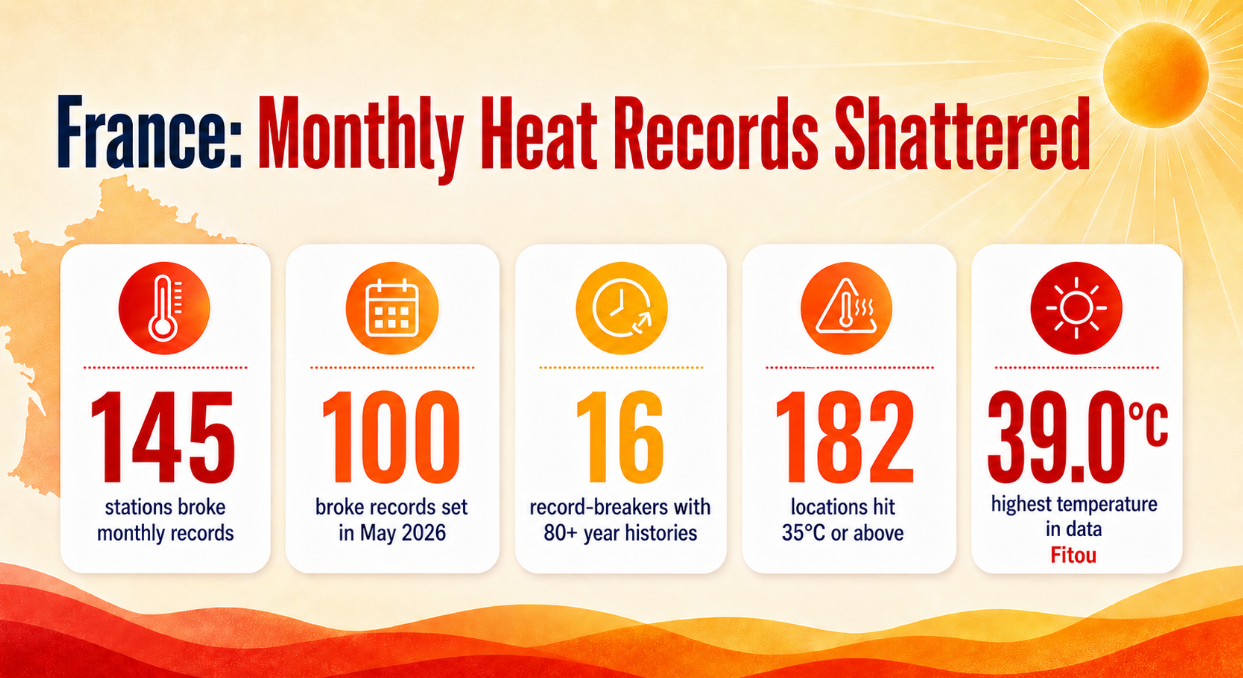
Some exceptional temperatures are being reached in parts of France today. National highs of 38.0°C or above in May: Villefranche: 40.0°C (104.0°F), May 29, 1947 Fitou: 38.4°C (101.1°F), May 28, 2026 (through 1 pm) Argeliers: 38.1°C (100.6°F), May 28, 2026 (through 1 pm) Lacanau: 38.0°C (100.4°F), May 19, 1958 Pissos: 38.0°C (100.4°F), May 27, 2005 Salindres: 38.0°C (100.4°F), May 29, 1947 -
It will then turn somewhat cooler for tomorrow through the weekend. The first week of June could also see temperatures average somewhat below normal to near noraml. The ENSO Region 1+2 anomaly was +2.1°C and the Region 3.4 anomaly was +1.0°C for the week centered around May 20. For the past six weeks, the ENSO Region 1+2 anomaly has averaged +1.72°C and the ENSO Region 3.4 anomaly has averaged +0.83°C. The ongoing El Niño will continue to strengthen through the summer. The SOI was -6.34 today. The preliminary Arctic Oscillation (AO) was +0.625 today. Based on sensitivity analysis applied to the latest guidance, there is an implied near 73% probability that New York City will have a warmer than normal May (1991-2020 normal). May will likely finish with a mean temperature near 63.6° (0.4° above normal). Supplemental Information: The projected mean would be 1.1° above the 1981-2010 normal monthly value.
-
Occasional Thoughts on Climate Change
donsutherland1 replied to donsutherland1's topic in Climate Change
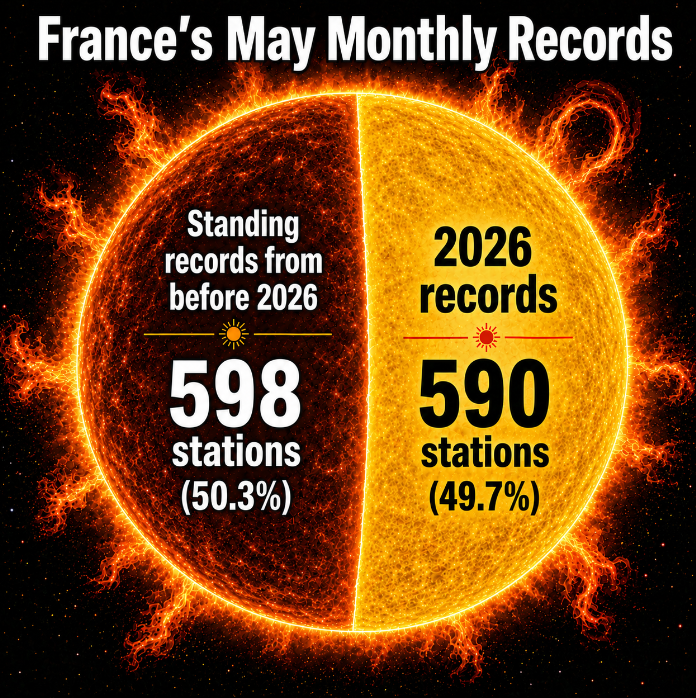
Today was another day of extraordinary heat in France. So far, almost half of all primary and secondary stations in France have set new May monthly record high temperatures during the ongoing heatwave.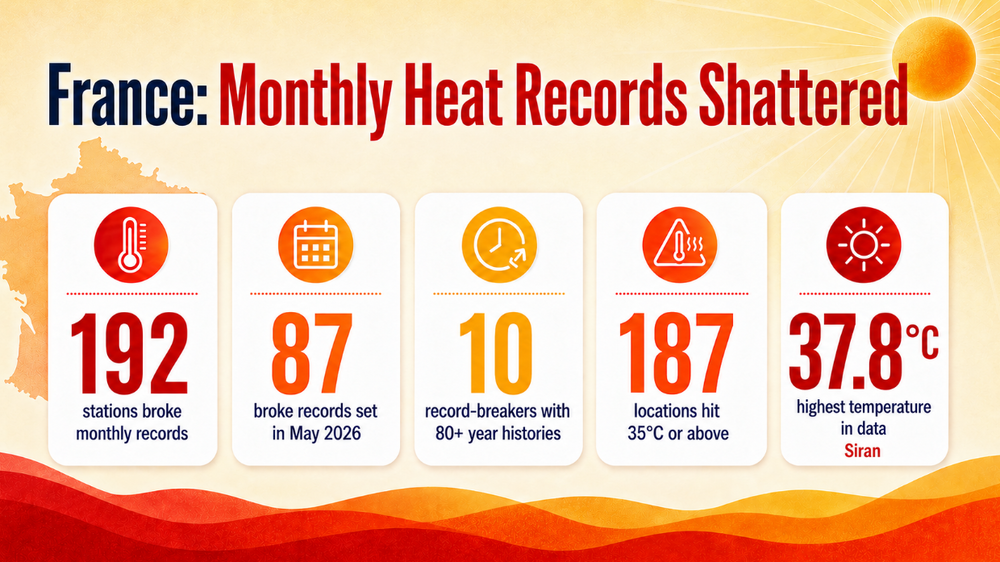
-
Tomorrow will see the temperature rise into the lower 80s across the region. It will then turn somewhat cooler for Thursday through the remainder of the week. The ENSO Region 1+2 anomaly was +2.1°C and the Region 3.4 anomaly was +1.0°C for the week centered around May 20. For the past six weeks, the ENSO Region 1+2 anomaly has averaged +1.72°C and the ENSO Region 3.4 anomaly has averaged +0.83°C. The ongoing El Niño will continue to strengthen through the summer. The SOI was -5.19 today. The preliminary Arctic Oscillation (AO) was +1.359 today. Based on sensitivity analysis applied to the latest guidance, there is an implied near 65% probability that New York City will have a warmer than normal May (1991-2020 normal). May will likely finish with a mean temperature near 63.6° (0.4° above normal). Supplemental Information: The projected mean would be 1.1° above the 1981-2010 normal monthly value.
-
Occasional Thoughts on Climate Change
donsutherland1 replied to donsutherland1's topic in Climate Change
Today was another day of insane climate change-driven heat in France. Nearly 400 monthly records were broken. 122 locations hit 35.0C (95.0F) or above while 27 reached 36C (96.8F) or above.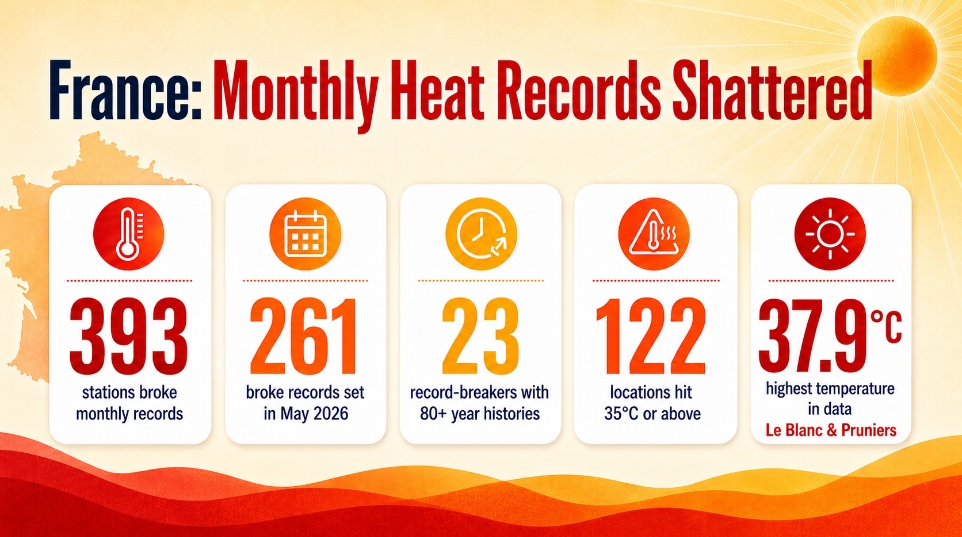
-
Occasional Thoughts on Climate Change
donsutherland1 replied to donsutherland1's topic in Climate Change
The models caught onto the European heatwave about five days before the event. The lead time wasn't great this time around.