donsutherland1
-
Posts
24,112 -
Joined
Content Type
Profiles
Blogs
Forums
American Weather
Media Demo
Store
Gallery
Everything posted by donsutherland1
-
Cooler weather has now returned to the region. Temperatures will likely top out in the middle to upper 70s tomorrow through Wednesday. It will then become somewhat warmer to conclude the week. No heat appears likely through at least June 25th. The ENSO Region 1+2 anomaly was +2.6°C and the Region 3.4 anomaly was +1.3°C for the week centered around June 3. For the past six weeks, the ENSO Region 1+2 anomaly has averaged +1.95°C and the ENSO Region 3.4 anomaly has averaged +0.98°C. The ongoing El Niño will continue to strengthen through the summer. The SOI was -12.93 today. The preliminary Arctic Oscillation (AO) was -0.321 today. Based on sensitivity analysis applied to the latest guidance, there is an implied near 78% probability that New York City will have a warmer than normal June (1991-2020 normal). June will likely finish with a mean temperature near 74.1 (2.1° above normal). Supplemental Information: The projected mean would be 2.7° above the 1981-2010 normal monthly value.
-
Yes. That's true. With the warming climate, this year's mark will probably fall in the not too distant future.
-
Showers and thundershowers are likely thie evening and tonight as a cold front moves across the region. Some of the thunderstorms could be strong or severe, bringing strong winds, small hail, and heavy downpours. Cooler weather will return for at least the first half of the week. Temperatures will likely top out in the middle to upper 70s tomorrow through Wednesday. It will then become somewhat warmer to conclude the week. The ENSO Region 1+2 anomaly was +2.6°C and the Region 3.4 anomaly was +1.3°C for the week centered around June 3. For the past six weeks, the ENSO Region 1+2 anomaly has averaged +1.95°C and the ENSO Region 3.4 anomaly has averaged +0.98°C. The ongoing El Niño will continue to strengthen through the summer. The SOI was -24.88 today. The preliminary Arctic Oscillation (AO) was -0.712 today. Based on sensitivity analysis applied to the latest guidance, there is an implied near 78% probability that New York City will have a warmer than normal June (1991-2020 normal). June will likely finish with a mean temperature near 74.3 (2.3° above normal). That would tie June 2026 the eighth warmest June on record with 1925, 1957, and 2021. Supplemental Information: The projected mean would be 2.9° above the 1981-2010 normal monthly value.
-
Newark has reached 90° for the 12th time this year. The old record through June 14th was 10 days. That record was set in 1930 and tied in 1986 and 1991. 1930 finished with 37 90° or above days; 1986 had just 22; 1991 had 41.
-
Very warm conditions will likely continue through tomorrow. Showers and thundershowers are possible tomorrow as a cold front moves across the region. Some of the thunderstorms could be strong or severe. Cooler weather will return for at least the first half of next week. The ENSO Region 1+2 anomaly was +2.6°C and the Region 3.4 anomaly was +1.3°C for the week centered around June 3. For the past six weeks, the ENSO Region 1+2 anomaly has averaged +1.95°C and the ENSO Region 3.4 anomaly has averaged +0.98°C. The ongoing El Niño will continue to strengthen through the summer. The SOI was -30.44 today. The preliminary Arctic Oscillation (AO) was -0.344 today. Based on sensitivity analysis applied to the latest guidance, there is an implied near 77% probability that New York City will have a warmer than normal June (1991-2020 normal). June will likely finish with a mean temperature near 74.4 (2.4° above normal). That would make June 2026 the eighth warmest June on record. Supplemental Information: The projected mean would be 3.0° above the 1981-2010 normal monthly value.
-
Four photos from the New York Botanical Garden during a warm June day.


-
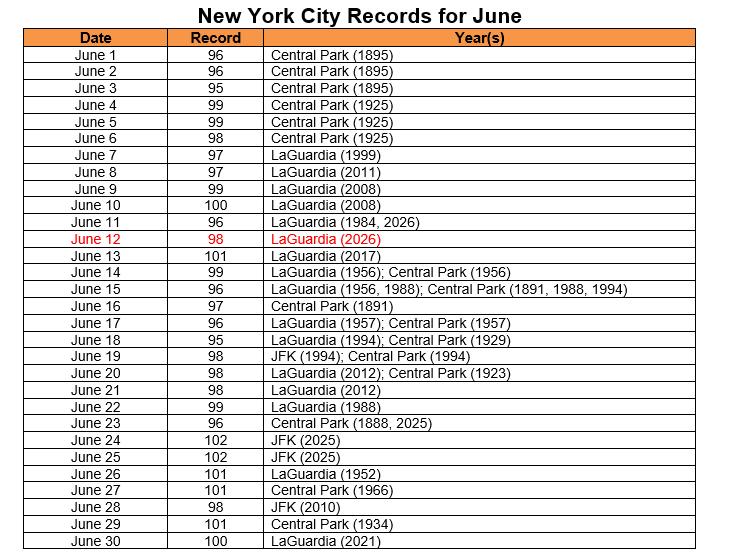
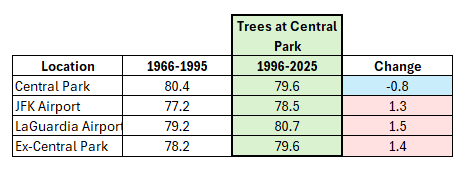
Yesterday saw record heat in New York City with LaGuardia Airport hitting 98° and JFK Airport coming in a close second at 96°. So far, there have been three days where Central Park has been New York City's coolest location: June 7: Central Park: 81°; JFK Airport: 86°; LaGuardia Airport: 83° June 11: Central Park: 91°; JFK Airport: 95°; LaGuardia Airport: 96° June 12: Central Park: 90°; JFK Airport: 96°; LaGuardia Airport: 98° The June 1-12, 2026 Average High Temperatures are below: Central Park: 82.4° (trees) JFK Airport: 82.7° (sea breeze prone) LaGuardia Airport: 84.4° Even as New York City has been warming over the most recent 30 years (1996-2025 vs. 1966-1995) during June, Central Park has seen its high temperatures cool on account of the increased tree cover. This outcome is not novel. This ongoing real-world experiment in allowing tree growth to proceed at Central Park's temperature station is producing results that are consistent with the outcomes documented in the empirical literature. One recent study concerning the cooling effect of trees can be found here.
-
Very warm conditions will likely continue through Sunday. Cooler weather will return for at least the first half of next week. Some rain is also likely early next week, but rainfall amounts could be fairly light. The ENSO Region 1+2 anomaly was +2.6°C and the Region 3.4 anomaly was +1.3°C for the week centered around June 3. For the past six weeks, the ENSO Region 1+2 anomaly has averaged +1.95°C and the ENSO Region 3.4 anomaly has averaged +0.98°C. The ongoing El Niño will continue to strengthen through the summer. The SOI was -15.11 yesterday. The preliminary Arctic Oscillation (AO) was +0.364 today. Based on sensitivity analysis applied to the latest guidance, there is an implied near 77% probability that New York City will have a warmer than normal June (1991-2020 normal). June will likely finish with a mean temperature near 74.5 (2.5° above normal). That would tie June 2026 the seventh warmest June on record with 1984. Supplemental Information: The projected mean would be 3.1° above the 1981-2010 normal monthly value.
-
The temperature soared to 91° in Central Park. As a result, 2026 became New York City's first year on record with a high of 80° or above in March and then 90° or above in April, May, and June. Aside from a potentially strong to severe thunderstorm tonight, tomorrow will be another hot day. The temperature will likely top out in the upper 80s to lower 90s. Very warm conditions will likely continue through Sunday. Parts of the region could experience a heatwave. Humidity levels could make the heat particularly uncomfortable. In addition, strong to severe thunderstorms could develop tomorrow. Cooler weather will return for at least the first half of next week. Some rain is also likely early next week, but rainfall amounts could be fairly light. The ENSO Region 1+2 anomaly was +2.6°C and the Region 3.4 anomaly was +1.3°C for the week centered around June 3. For the past six weeks, the ENSO Region 1+2 anomaly has averaged +1.95°C and the ENSO Region 3.4 anomaly has averaged +0.98°C. The ongoing El Niño will continue to strengthen through the summer. The SOI was -5.69 yesterday. The preliminary Arctic Oscillation (AO) was +0.779 today. Based on sensitivity analysis applied to the latest guidance, there is an implied near 78% probability that New York City will have a warmer than normal June (1991-2020 normal). June will likely finish with a mean temperature near 74.7 (2.7° above normal). That would tie June 2026 the fifth warmest June on record with 1899 and 2010. Supplemental Information: The projected mean would be 3.3° above the 1981-2010 normal monthly value.
-
A period of above normal temperatures is developing. The temperature will likely top out in the upper 80s to lower 90s tomorrow through Saturday. Parts of the region could experience a heatwave during the second half of the week. Humidity levels could make the heat particularly uncomfortable. In addition, strong to severe thunderstorms could develop tomorrow and again on Friday. Sunday will remain very warm with highs mainly in the upper 80s. Cooler weather will return for at least the first half of next week. Some rain is also likely early next week, but rainfall amounts could be fairly light. The ENSO Region 1+2 anomaly was +2.6°C and the Region 3.4 anomaly was +1.3°C for the week centered around June 3. For the past six weeks, the ENSO Region 1+2 anomaly has averaged +1.95°C and the ENSO Region 3.4 anomaly has averaged +0.98°C. The ongoing El Niño will continue to strengthen through the summer. The SOI was -5.69 today. The preliminary Arctic Oscillation (AO) was +0.630 today. Based on sensitivity analysis applied to the latest guidance, there is an implied near 80% probability that New York City will have a warmer than normal June (1991-2020 normal). June will likely finish with a mean temperature near 74.9 (2.9° above normal). That would make June 2026 the fifth warmest June on record. Supplemental Information: The projected mean would be 3.5° above the 1981-2010 normal monthly value.
-
That's probably a reference to the heat index.
-
Above normal temperatures will return for the remainder of the week by Thursday. Tomorrow will see highs in the upper 70s to lower 80s. The temperature will likely top out in the upper 80s to lower 90s on Thursday through Saturday. Parts of the region could experience a heatwave during the second half of the week. Humidity levels could make the heat particularly uncomfortable. The ENSO Region 1+2 anomaly was +2.6°C and the Region 3.4 anomaly was +1.3°C for the week centered around June 3. For the past six weeks, the ENSO Region 1+2 anomaly has averaged +1.95°C and the ENSO Region 3.4 anomaly has averaged +0.98°C. The ongoing El Niño will continue to strengthen through the summer. The SOI was -12.65 today. The preliminary Arctic Oscillation (AO) was +0.625 today. Based on sensitivity analysis applied to the latest guidance, there is an implied near 75% probability that New York City will have a warmer than normal June (1991-2020 normal). June will likely finish with a mean temperature near 74.6° (2.6° above normal). That would make June 2026 the seventh warmest June on record. Supplemental Information: The projected mean would be 3.2° above the 1981-2010 normal monthly value.
-
2026-2027 Super El Nino
donsutherland1 replied to Stormchaserchuck1's topic in Weather Forecasting and Discussion
It will be interesting to see how strong the ongoing and rapidly developing El Niño becomes. Only the 1997-98, 2015-16, and 2023-24 El Niño events saw the 6-week moving average for Region 3.4 reach or exceed +0.9°C in June or July. -
Above normal temperatures will return for the remainder of the week by Wednesday or Thursday. Tomorrow will see highs in the lower 80s. Wednesday should see highs in the lower to perhaps middle 80s. The temperature could approach or reach 90° to end the week. Parts of the region could experience a heatwave during the second half of the week. The ENSO Region 1+2 anomaly was +2.6°C and the Region 3.4 anomaly was +1.3°C for the week centered around June 3. For the past six weeks, the ENSO Region 1+2 anomaly has averaged +1.95°C and the ENSO Region 3.4 anomaly has averaged +0.98°C. The ongoing El Niño will continue to strengthen through the summer. The SOI was -25.52 today. The preliminary Arctic Oscillation (AO) was +0.597 today. Based on sensitivity analysis applied to the latest guidance, there is an implied near 76% probability that New York City will have a warmer than normal June (1991-2020 normal). June will likely finish with a mean temperature near 74.8° (2.8° above normal). That would make June 2026 the fifth warmest June on record. Supplemental Information: The projected mean would be 3.4° above the 1981-2010 normal monthly value.
-
Following an earlier shower, the afternoon featured abundant sunshine and a refreshing breeze. Three photos from the New York Botanical Garden:


-
Tomorrow will be the coolest day of the week with highs only reaching the upper 70s to near 80°. Afterward, above normal temperatures will return for the remainder of the week. The temperature could approach or reach 90° to end the week. Parts of the region could experience a heatwave during the second half of the week. The ENSO Region 1+2 anomaly was +2.2°C and the Region 3.4 anomaly was +1.0°C for the week centered around May 27. For the past six weeks, the ENSO Region 1+2 anomaly has averaged +1.80°C and the ENSO Region 3.4 anomaly has averaged +0.90°C. The ongoing El Niño will continue to strengthen through the summer. The SOI was -34.73 today. The preliminary Arctic Oscillation (AO) was +0.881 today. Based on sensitivity analysis applied to the latest guidance, there is an implied near 80% probability that New York City will have a warmer than normal June (1991-2020 normal). June will likely finish with a mean temperature near 75.0° (3.0° above normal). That would make June 2026 the fifth warmest June on record. Supplemental Information: The projected mean would be 3.6° above the 1981-2010 normal monthly value.
-
Bridgeport: 5 days, 1957, 1984 Islip: 6 days, 1987 New York City-Central Park: 10 days, 1925, 1991 New York City-JFK Airport: 5 days, 1962, 1984, 1988, 1991 New York City-LaGuardia Airport: 9 days, 1991 Newark: 13 days, 1991 White Plains: 5 days, 1957, 1984
-
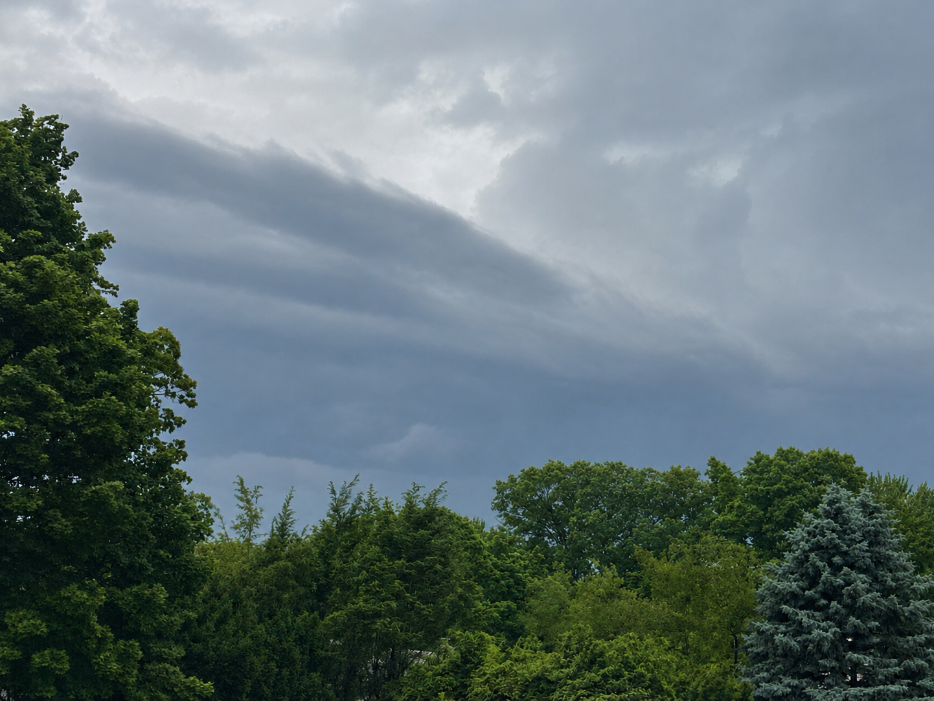
From earlier this evening. There was a brief period of gusty winds followed by a brief period of moderate rain.
-
Showers and thundershowers are possible tonight into early tomorrow. A few spots could experience strong to severe thunderstorms, gusty winds, hail, and heavy downpours. Tomorrow will be somewhat cooler with highs reaching the lower and middle 80s across the region. Monday will be the coolest day of next week with highs only reaching the upper 70s to near 80°. Afterward, above normal temperatures will return for the remainder of the week. The temperature could approach or reach 90° to end the week. The ENSO Region 1+2 anomaly was +2.2°C and the Region 3.4 anomaly was +1.0°C for the week centered around May 27. For the past six weeks, the ENSO Region 1+2 anomaly has averaged +1.80°C and the ENSO Region 3.4 anomaly has averaged +0.90°C. The ongoing El Niño will continue to strengthen through the summer. The SOI was -27.42 today. The preliminary Arctic Oscillation (AO) was +1.795 today.
-
2026-2027 Super El Nino
donsutherland1 replied to Stormchaserchuck1's topic in Weather Forecasting and Discussion
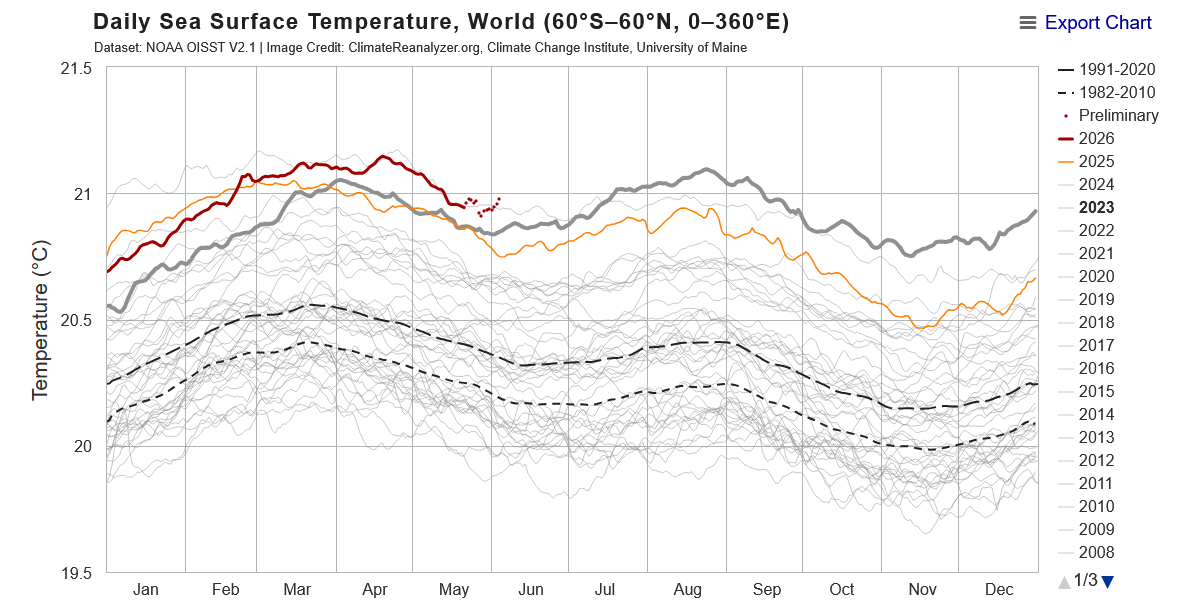
The ongoing and strengthening El Niño is already contributing to record warm ocean temperatures. Global sea surface temperatures are currently well ahead of those during the development of the 2023-24 El Niño.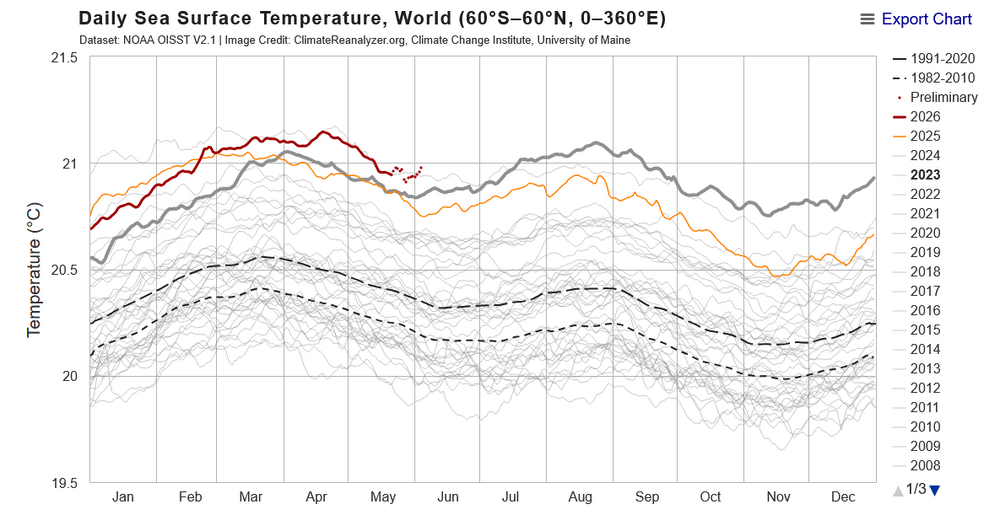
-
Tomorrow will be fair and hot with highs in the upper 80s and lower 90s. Should Central Park reach 90°, 2026 would become the first year on record that New York City had a high of 80° or above in March and highs of 90° or above in April, May, and June. Some showers or thundershowers are possible early Sunday. Highs will still reach the lower and middle 80s. Somewhat cooler conditions early next week will give way to a return to above normal temperatures for the remainder of the week. The ENSO Region 1+2 anomaly was +2.2°C and the Region 3.4 anomaly was +1.0°C for the week centered around May 27. For the past six weeks, the ENSO Region 1+2 anomaly has averaged +1.80°C and the ENSO Region 3.4 anomaly has averaged +0.90°C. The ongoing El Niño will continue to strengthen through the summer. The SOI was -29.81 today. The preliminary Arctic Oscillation (AO) was +1.795 today.
-
2026-2027 Super El Nino
donsutherland1 replied to Stormchaserchuck1's topic in Weather Forecasting and Discussion
It might not be as east-based as either of those two ENSO events, but there's still a lot of time before the anomalies peak. It looks solidly east-based, perhaps evolving into a basinwide event as it weakens. -
2026-2027 Super El Nino
donsutherland1 replied to Stormchaserchuck1's topic in Weather Forecasting and Discussion
Yes. It's looking like a monster east-based El Niño event. -
Tomorrow and Saturday will be very warm days with highs in the upper 80s and lower 90s. Should Central Park reach 90°, 2026 would become the first year on record that New York City had a high of 80° or above in March and highs of 90° or above in April, May, and June. Saturday will remain warm before somewhat cooler air arrives to conclude the weekend. Some showers or thundershowers are possible early Sunday. Cooler conditions early next week will give way to a return to above normal temperatures for the remainder of the week. The ENSO Region 1+2 anomaly was +2.2°C and the Region 3.4 anomaly was +1.0°C for the week centered around May 27. For the past six weeks, the ENSO Region 1+2 anomaly has averaged +1.80°C and the ENSO Region 3.4 anomaly has averaged +0.90°C. The ongoing El Niño will continue to strengthen through the summer. The SOI was -35.29 today. The preliminary Arctic Oscillation (AO) was +1.920 today.
-
A warming trend is now underway. Tomorrow should see temperatures top out in lower 80s and perhaps middle 80s. Friday and Saturday will be very warm days with highs in the upper 80s and lower 90s. Should Central Park reach 90°, 2026 would become the first year on record that New York City had a high of 80° or above in March and highs of 90° or above in April, May, and June. Saturday will remain warm before somewhat cooler air arrives to conclude the weekend. The ENSO Region 1+2 anomaly was +2.2°C and the Region 3.4 anomaly was +1.0°C for the week centered around May 27. For the past six weeks, the ENSO Region 1+2 anomaly has averaged +1.80°C and the ENSO Region 3.4 anomaly has averaged +0.90°C. The ongoing El Niño will continue to strengthen through the summer. The SOI was -34.80 today. The preliminary Arctic Oscillation (AO) was +1.384 today.