donsutherland1
-
Posts
24,117 -
Joined
Content Type
Profiles
Blogs
Forums
American Weather
Media Demo
Store
Gallery
Everything posted by donsutherland1
-
A rose at the New York Botanical Garden:

-
Warmer temperatures lie ahead. The temperature will rise to above normal levels for tomorrow through Thursday. Exceptional heat is unlikely. It will turn somewhat cooler to end the week. The ENSO Region 1+2 anomaly was +2.1°C and the Region 3.4 anomaly was +1.0°C for the week centered around May 20. For the past six weeks, the ENSO Region 1+2 anomaly has averaged +1.72°C and the ENSO Region 3.4 anomaly has averaged +0.83°C. The ongoing El Niño will continue to strengthen through the summer. The SOI was -25.41 today. The preliminary Arctic Oscillation (AO) was +1.581 today. Based on sensitivity analysis applied to the latest guidance, there is an implied near 70% probability that New York City will have a warmer than normal May (1991-2020 normal). May will likely finish with a mean temperature near 63.8° (0.6° above normal). Supplemental Information: The projected mean would be 1.3° above the 1981-2010 normal monthly value.
-
Occasional Thoughts on Climate Change
donsutherland1 replied to donsutherland1's topic in Climate Change
The final numbers from today's historic heat in France: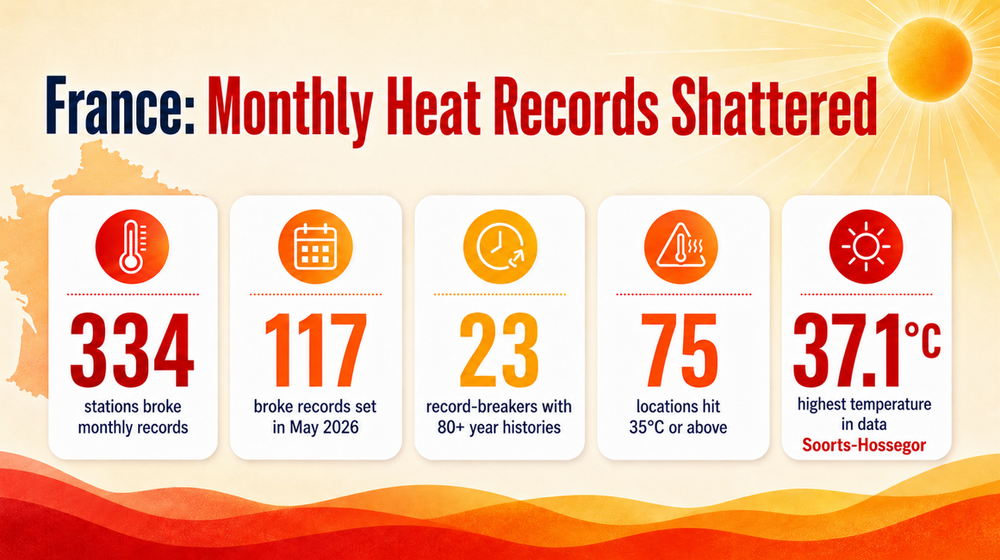
-
Occasional Thoughts on Climate Change
donsutherland1 replied to donsutherland1's topic in Climate Change
It took awhile, but by last Tuesday, the models started to present a strong heat signal.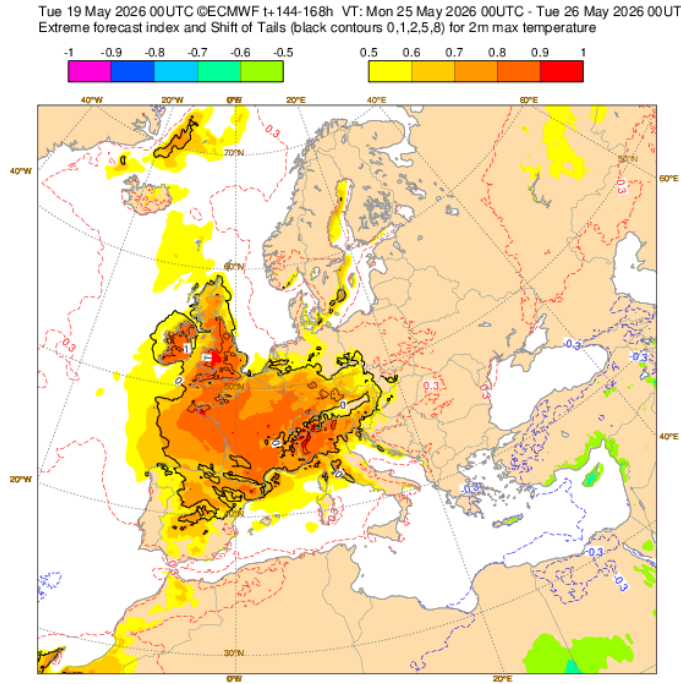
-
Occasional Thoughts on Climate Change
donsutherland1 replied to donsutherland1's topic in Climate Change
The Met Office has now published an account of today's historic May heat. That account can be found at: https://www.metoffice.gov.uk/about-us/news-and-media/media-centre/weather-and-climate-news/2026/provisional-spring-daily-temperature-record-as-heatwave-continues In terms of the impact of climate change, the Met Office explains: A climate attribution study published last summer by Met Office scientists found that the chances of surpassing the May temperature record have been increasing as our climate changes as a consequence of human greenhouse gas emissions. The study found that breaking the 32.8°C May record is around three times more likely now in our current climate than it would have been in a natural climate not impacted by greenhouse gas emissions. What was around a 1-in-100 year event is now around a 1-in-33 year event. -
Occasional Thoughts on Climate Change
donsutherland1 replied to donsutherland1's topic in Climate Change
Today, London's Kew Gardens saw the temperature soar to 34.8°C (95°F). That demolished the UK's national May record of 32.8°C (91F) that had stood since 1944. The ongoing extreme heat was made much more likely by anthropogenic climate change. Across the British Channel, France saw more than 300 May monthly records set with 62 locations having reaching 95°F (35.0°C) or above. Final numbers from France will be available in a few hours.
-
Occasional Thoughts on Climate Change
donsutherland1 replied to donsutherland1's topic in Climate Change
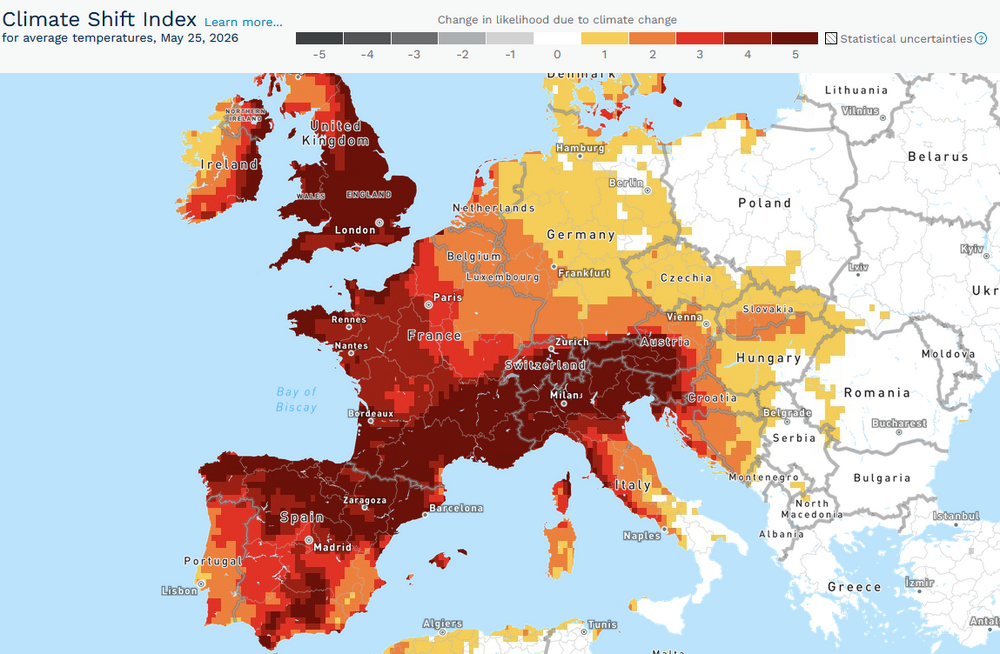
A historic May heatwave is scorching parts of Europe, including the UK, France, Germany, Italy, and Spain. Today, France saw 105 stations set new monthly records with 25 of those stations setting monthly records that had been set on Friday or yesterday. Tomorrow and Tuesday will likely be hotter. The UKs national May temperature record could be challenged or broken tomorrow and again on Tuesday. The extreme heat has been made more likely by climate change. Europe is currently experiencing a rate of warming that is twice the rate of the global average. From Climate Central's Climate Shift Index: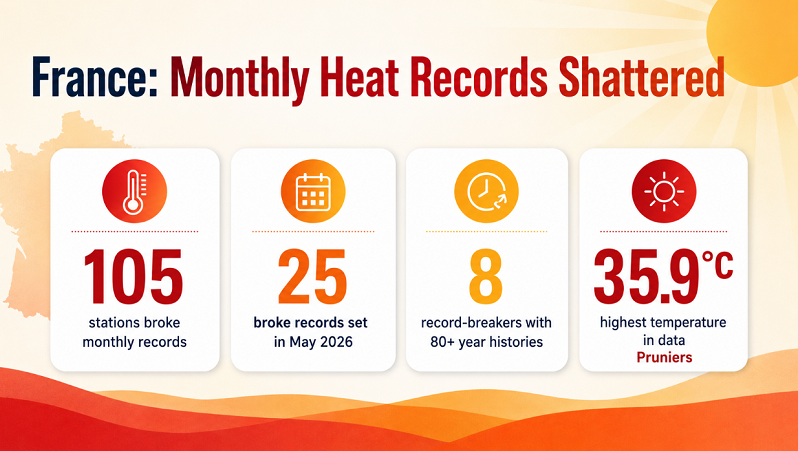
-
Yes. It is consistent with a rapidly strengthening El Niño. New weekly numbers come out tomorrow.
-
Through 4 pm, storm total rainfall totals across the region include: Atlantic City: 0.91" Binghamton: 0.86" Bridgeport: 1.44" Islip: 1.20" New Haven: 1.38" New York City-Central Park: 1.83" New York City-JFK Airport: 1.56" New York City-LaGuardia Airport: 1.65" Newark: 1.50" Philadelphia: 1.52" White Plains: 1.38" Clouds will break tomorrow. As a result, the temperature will likely return to the lower 70s. Temperatures could then rise to above normal levels for Tuesday through Thursday. It will turn somewhat cooler to end the week. The ENSO Region 1+2 anomaly was +1.8°C and the Region 3.4 anomaly was +0.9°C for the week centered around May 13. For the past six weeks, the ENSO Region 1+2 anomaly has averaged +1.63°C and the ENSO Region 3.4 anomaly has averaged +0.70°C. El Niño conditions are now in place. The ongoing El Niño will continue to strengthen through the summer. The SOI was -31.69 today. The preliminary Arctic Oscillation (AO) was +1.772 today. Based on sensitivity analysis applied to the latest guidance, there is an implied near 75% probability that New York City will have a warmer than normal May (1991-2020 normal). May will likely finish with a mean temperature near 64.0° (0.8° above normal). Supplemental Information: The projected mean would be 1.5° above the 1981-2010 normal monthly value.
-
That was a typo. The record low was 44 in 1963.
-
Through 4 pm, rainfall totals across the region include: Bridgeport: 0.24" Islip: 0.09" New Haven: 0.08" New York City-Central Park: 0.11" New York City-JFK Airport: 0.02" New York City-LaGuardia Airport: 0.12" Newark: 0.01" Philadelphia: 0.39" White Plains: 0.19" Rain will continue tonight into tomorrow at varying intensities. A storm total 0.50"-1.50" rainfall is likely in the New York City area (generally 1.00"-1.50" in New York City and its nearby suburbs) with some locally higher amounts near 2.00". Many parts of the region will see the temperature fall to 50° or even somewhat lower tonight. The temperature will then struggle to reach the lower 60s tomorrow. The mercury will likely return to the lower 70s on Monday. Temperatures could return to above normal levels for Tuesday through Thursday. The ENSO Region 1+2 anomaly was +1.8°C and the Region 3.4 anomaly was +0.9°C for the week centered around May 13. For the past six weeks, the ENSO Region 1+2 anomaly has averaged +1.63°C and the ENSO Region 3.4 anomaly has averaged +0.70°C. El Niño conditions are now in place. The ongoing El Niño will continue to strengthen through the summer. The SOI was -18.21 today. The preliminary Arctic Oscillation (AO) was +1.454 today. Based on sensitivity analysis applied to the latest guidance, there is an implied near 73% probability that New York City will have a warmer than normal May (1991-2020 normal). May will likely finish with a mean temperature near 63.9° (0.7° above normal). Supplemental Information: The projected mean would be 1.4° above the 1981-2010 normal monthly value.
-
I agree. This is a very challenging setup.
-
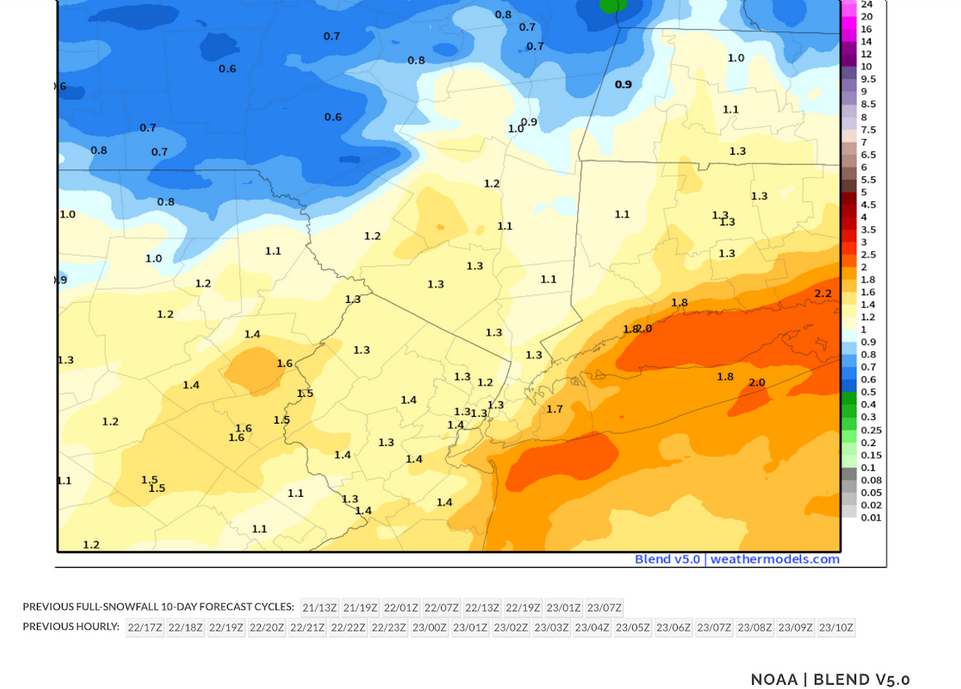
Latest NBE: My thinking is that most of the area will see a general 1.00"-1.50" with some locally higher amounts. The NBE has lowered the top amounts while raising the lower amounts. The 0.50" figure will be confined to locations farther from the NYC area than had been my thinking last evening. The 6z GFS, 0z GGEM and 0z AIFS are in good agreement. The 0z ECMWF became notably wetter. However, it is an outlier among the operational models. The key to achieving higher amounts, particularly those on the ECMWF, would be convective activity, possibly training thunderstorms. At present, most of the convective activity will likely take place south of the NYC region
-
I'm giving greater weight to the AIFS/ECMWF, as the 18z GFS reduced totals from the 12z run. I do think 2" amounts are most likely across eastern PA into western NJ. The City and nearby suburbs should generally be 1.00"-1.50" in my thinking, but parts of CT away from the coast will have lower amounts (0.50"-1.00"). That's why I used 0.50"-1.50" with some locally higher amounts for the general NYC area. On the other hand, the NBE has grown wetter with amounts near 1.70" in and around NYC.
-
Yes. I remember it well. The afternoon snow squall, even as it was short-lived, was quite impressive.
-
May 9, 2020 at JFK Airport (tied), LaGuardia Airport, and White Plains (tied). For Bridgeport: November 23, 2018 For Islip: June 1, 2009 For New York City-Central Park: August 29, 1986 (tied) For Newark: August 29, 1982
-
Clouds will increase tonight. Rain will develop tomorrow and continue into Sunday. A general 0.50"-1.50" rainfall is likely. Some locally higher amounts are possible. The temperature will likely remain in the 50s all day on Saturday and struggle to reach the lower 60s on Sunday. The mercury will likely return to the lower 70s on Monday. The ENSO Region 1+2 anomaly was +1.8°C and the Region 3.4 anomaly was +0.9°C for the week centered around May 13. For the past six weeks, the ENSO Region 1+2 anomaly has averaged +1.63°C and the ENSO Region 3.4 anomaly has averaged +0.70°C. El Niño conditions are now in place. The ongoing El Niño will continue to strengthen through the summer. The SOI was -19.74 today. The preliminary Arctic Oscillation (AO) was +0.868 today. Based on sensitivity analysis applied to the latest guidance, there is an implied near 66% probability that New York City will have a warmer than normal May (1991-2020 normal). May will likely finish with a mean temperature near 63.8° (0.6° above normal). Supplemental Information: The projected mean would be 1.3° above the 1981-2010 normal monthly value.
-
Cooler air has now returned to the region. Tomorrow will be variably cloudy and cool with highs topping out in the lower and middle 60s across the region. Rain will develop on Saturday and continue into Sunday. A general 0.50"-1.50" rainfall is likely. The temperature will likely remain in the 50s all day on Saturday and struggle to reach the lower 60s on Sunday. The mercury will likely return to the lower 70s on Monday. The ENSO Region 1+2 anomaly was +1.8°C and the Region 3.4 anomaly was +0.9°C for the week centered around May 13. For the past six weeks, the ENSO Region 1+2 anomaly has averaged +1.63°C and the ENSO Region 3.4 anomaly has averaged +0.70°C. El Niño conditions are now in place. The ongoing El Niño will continue to strengthen through the summer. The SOI was -15.07 yesterday. The preliminary Arctic Oscillation (AO) was +0.108 today. Based on sensitivity analysis applied to the latest guidance, there is an implied near 66% probability that New York City will have a warmer than normal May (1991-2020 normal). May will likely finish with a mean temperature near 63.8° (0.6° above normal). Supplemental Information: The projected mean would be 1.3° above the 1981-2010 normal monthly value.
-
92° was the final figure.
-
Today was another hot day. High temperatures included: Atlantic City: 97° (old record: 96°, 1996) Baltimore: 96° (old record: 95°, 1962) Bangor: 87° (old record: 86°, 1996 and 2003) Boston: 90° Bridgeport: 93° Hartford: 90° Islip: 93° Manchester: 89° (old record: 87°, 1887) New York City-Central Park: 92° New York City-JFK Airport: 93° New York City-LaGuardia Airport: 96° Newark: 96° Norfolk: 94° Philadelphia: 95° (old record: 94°, 1962 and 1996) Portland: 89° (old record: 86°, 1959) Poughkeepsie: 91° (tied record set in 1962 and tied in 1975) Providence: 93° Raleigh: 96° (tied record set in 2022) Richmond: 96° Washington, DC: 96° (tied record set in 1996) Wilmington, DE: 95° Thunderstorms will move through the region this evening and early tonight. In the wake of the frontal passage, tomorrow will see temperatures top out in the upper 60s and lower 70s. Afterward, it will turn much cooler with highs only in the 60s on Friday through the weekend. Saturday could be rainy and particularly chilly. The temperature may remain in the 50s all day. The ENSO Region 1+2 anomaly was +1.8°C and the Region 3.4 anomaly was +0.9°C for the week centered around May 13. For the past six weeks, the ENSO Region 1+2 anomaly has averaged +1.63°C and the ENSO Region 3.4 anomaly has averaged +0.70°C. El Niño conditions are now in place. The ongoing El Niño will continue to strengthen through the summer. The SOI was -5.73 yesterday. The preliminary Arctic Oscillation (AO) was -0.160 today. Based on sensitivity analysis applied to the latest guidance, there is an implied near 58% probability that New York City will have a warmer than normal May (1991-2020 normal). May will likely finish with a mean temperature near 63.6° (0.4° above normal). Supplemental Information: The projected mean would be 1.1° above the 1981-2010 normal monthly value.
-
Today was the hottest day so far this year. High temperatures included: Albany: 91° (tied record set in 1903, and tied in 1962, 1986, 1989) Boston: 96° (old record: 90°, 1949, 1986, 2017) Manchester, NH: 97° (old record: 89°, 1949) ***tied May monthly record*** New York City-Central Park: 93° New York City-LaGuardia Airport: 96° Newark: 99°, 1962 ***tied May monthly record*** Philadelphia: 98° (old record: 96°, 1962) ***New May monthly record*** Poughkeepsie: 96° (tied record set in 1962) Providence: 92° (old record: 91°, 2017) Westfield: 96° (old record: 90°, 2017) 2026 became only Central Park's second year on record that saw a monthly maximum temperature of 80° or above in March, and 90° or above in both April and May. Tomorrow will be another hot day. Records could again be challenged or broken in places. Records for May 20th: Albany: 91°, 1962 Allentown: 92°, 1962, 1996 Atlantic City: 96°, 1996 Baltimore: 95°, 1962 Boston: 91°, 1996 Bridgeport: 97°, 1996 Hartford: 99°, 1996 Islip: 98°, 1996 New York City-Central Park: 96°, 1996 New York City-JFK Airport: 95°, 1996 New York City-LaGuardia Airport: 97°, 1996 Newark: 99°, 1996 Norfolk: 98°, 1996 Philadelphia: 94°, 1962, 1996 Poughkeepsie: 91°, 1962, 1975 Providence: 95°, 1996 Richmond: 97°, 2022 Sterling: 93°, 1996 Trenton: 94°, 1996 Washington, DC: 96°, 1996 Westfield: 86°, 2012 White Plains: 95°, 1996 Worcester: 91°, 1903 Thursday will see temperatures top out in the lower 70s. Afterward, it will turn much cooler with highs only in the 60s on Friday through the weekend. Saturday could be rainy and particularly chilly. The ENSO Region 1+2 anomaly was +1.8°C and the Region 3.4 anomaly was +0.9°C for the week centered around May 13. For the past six weeks, the ENSO Region 1+2 anomaly has averaged +1.63°C and the ENSO Region 3.4 anomaly has averaged +0.70°C. El Niño conditions are now in place. The ongoing El Niño will continue to strenthen through the summer. The SOI was -6.11 today. The preliminary Arctic Oscillation (AO) was +0.086 today. Based on sensitivity analysis applied to the latest guidance, there is an implied near 59% probability that New York City will have a warmer than normal May (1991-2020 normal). May will likely finish with a mean temperature near 63.7° (0.5° above normal). Supplemental Information: The projected mean would be 1.2° above the 1981-2010 normal monthly value.
-
E PA/NJ/DE Spring 2026 Obs/Discussion
donsutherland1 replied to PhiEaglesfan712's topic in Philadelphia Region
Philadelphia has hit 98°. That sets a new May monthly record. -
As of 1 pm, records in the East include: Atlantic City: 93° Boston: 95° (nearing the May monthly record of 97°) Hartford: 96° Manchester: 92° Sterling: 93°
-
The temperature reached 88° in Central Park and 90° in Newark. Reading, PA had a high of 96°, which was 1° short of its May monthly record. Even hotter temperatures are likely tomorrow in the East. Temperatures will then rocket well into the 90s tomorrow. Wednesday will be another hot day with highs in the 90s. Even as tomorrow and Wednesday coincide with historic 1962 and 1996 May outbreaks of extreme heat in the Northeast, parts of the region could still approach or reach record values. Records for May 19th: Albany: 91°, 1903, 1962, 1986, 1989 Allentown: 97°, 1962 Atlantic City: 91°, 2017 Baltimore: 98°, 1962 Boston: 90°, 1949, 1986, 2017 Bridgeport: 89°, 2017 Hartford: 94°, 1962 Islip: 89°, 2017 New York City-Central Park: 99°, 1962 New York City-JFK Airport: 92°, 2017 New York City-LaGuardia Airport: 96°, 2017 Newark: 98°, 1962 Norfolk: 96°, 1880 Philadelphia: 96°, 1962 Poughkeepsie: 96°, 1962 Providence: 91°, 2017 Richmond: 97°, 1962 Sterling: 92°, 1996, 1997 Trenton: 96°, 1962 Washington, DC: 96°, 1911, 1997 Westfield: 90°, 2017 White Plains: 95°, 1962 Worcester: 92°, 1962 Records for May 20th: Albany: 91°, 1962 Allentown: 92°, 1962, 1996 Atlantic City: 96°, 1996 Baltimore: 95°, 1962 Boston: 91°, 1996 Bridgeport: 97°, 1996 Hartford: 99°, 1996 Islip: 98°, 1996 New York City-Central Park: 96°, 1996 New York City-JFK Airport: 95°, 1996 New York City-LaGuardia Airport: 97°, 1996 Newark: 99°, 1996 Norfolk: 98°, 1996 Philadelphia: 94°, 1962, 1996 Poughkeepsie: 91°, 1962, 1975 Providence: 95°, 1996 Richmond: 97°, 2022 Sterling: 93°, 1996 Trenton: 94°, 1996 Washington, DC: 96°, 1996 Westfield: 86°, 2012 White Plains: 95°, 1996 Worcester: 91°, 1903 In addition, 2026 will become Central Park's second year on record that saw a monthly maximum temperature of 80° or above in March, and 90° or above in both April and May. Currently, 1977 with a March high of 81°, April high of 90°, and May high of 92° is the only such year. 2026 has seen a March high of 81° and April high of 90°. Thursday will see temperatures top out in the lower 70s. Afterward, it will turn much cooler with highs only in the 60s on Friday and Saturday. The ENSO Region 1+2 anomaly was +1.8°C and the Region 3.4 anomaly was +0.9°C for the week centered around May 13. For the past six weeks, the ENSO Region 1+2 anomaly has averaged +1.63°C and the ENSO Region 3.4 anomaly has averaged +0.70°C. El Niño conditions are now in place. The ongoing El Niño will continue to strenthen through the summer. The SOI was -6.11 today. The preliminary Arctic Oscillation (AO) was +0.583 today. Based on sensitivity analysis applied to the latest guidance, there is an implied near 57% probability that New York City will have a warmer than normal May (1991-2020 normal). May will likely finish with a mean temperature near 63.6° (0.4° above normal). Supplemental Information: The projected mean would be 1.1° above the 1981-2010 normal monthly value.
-
The temperature surged into the upper 80s to around 90° in the region. Boston also reached 90° today. Tomorrow will be a bit cooler than today. However, temperatures will then rocket into the 90s for Tuesday and Wednesday. Tuesday and Wednesday coincide with 1962 and 1996 outbreaks of extreme heat in the Northeast during which May monthly records were set in many locations. Nevertheless, parts of the region could still approach or reach record values on Tuesday and Wednesday. Records for May 19th: Albany: 91°, 1903, 1962, 1986, 1989 Allentown: 97°, 1962 Atlantic City: 91°, 2017 Baltimore: 98°, 1962 Boston: 90°, 1949, 1986, 2017 Bridgeport: 89°, 2017 Hartford: 94°, 1962 Islip: 89°, 2017 New York City-Central Park: 99°, 1962 New York City-JFK Airport: 92°, 2017 New York City-LaGuardia Airport: 96°, 2017 Newark: 98°, 1962 Norfolk: 96°, 1880 Philadelphia: 96°, 1962 Poughkeepsie: 96°, 1962 Providence: 91°, 2017 Richmond: 97°, 1962 Sterling: 92°, 1996, 1997 Trenton: 96°, 1962 Washington, DC: 96°, 1911, 1997 Westfield: 90°, 2017 White Plains: 95°, 1962 Worcester: 92°, 1962 Records for May 20th: Albany: 91°, 1962 Allentown: 92°, 1962, 1996 Atlantic City: 96°, 1996 Baltimore: 95°, 1962 Boston: 91°, 1996 Bridgeport: 97°, 1996 Hartford: 99°, 1996 Islip: 98°, 1996 New York City-Central Park: 96°, 1996 New York City-JFK Airport: 95°, 1996 New York City-LaGuardia Airport: 97°, 1996 Newark: 99°, 1996 Norfolk: 98°, 1996 Philadelphia: 94°, 1962, 1996 Poughkeepsie: 91°, 1962, 1975 Providence: 95°, 1996 Richmond: 97°, 2022 Sterling: 93°, 1996 Trenton: 94°, 1996 Washington, DC: 96°, 1996 Westfield: 86°, 2012 White Plains: 95°, 1996 Worcester: 91°, 1903 In addition, 2026 will become Central Park's second year on record that saw a monthly maximum temperature of 80° or above in March, and 90° or above in both April and May. Currently, 1977 with a March high of 81°, April high of 90°, and May high of 92° is the only such year. 2026 has seen a March high of 81° and April high of 90°. Thursday will see temperatures top out in the lower 70s. Afterward, it will turn much cooler with highs only in the 60s on Friday and Saturday. The ENSO Region 1+2 anomaly was +1.6°C and the Region 3.4 anomaly was +0.9°C for the week centered around May 6. For the past six weeks, the ENSO Region 1+2 anomaly has averaged +1.50°C and the ENSO Region 3.4 anomaly has averaged +0.55°C. El Niño conditions are rapidly developing and will likely be in place in the next few weeks. The SOI was -27.48 today. The preliminary Arctic Oscillation (AO) was +1.368 today. Based on sensitivity analysis applied to the latest guidance, there is an implied near 60% probability that New York City will have a warmer than normal May (1991-2020 normal). May will likely finish with a mean temperature near 63.7° (0.5° above normal). Supplemental Information: The projected mean would be 1.2° above the 1981-2010 normal monthly value.