donsutherland1
-
Posts
24,194 -
Joined
Content Type
Profiles
Blogs
Forums
American Weather
Media Demo
Store
Gallery
Everything posted by donsutherland1
-
Tomorrow will be somewhat milder with highs in the upper 70s. Thursday will see readings return to the 80s and the Friday could see highs in the upper 80s. A few of the hot spots could approach or reach 90°. The weekend will turn somewhat cooler with highs mainly in the lower 80s. No excessive heat appears likely through mid-month. The ENSO Region 1+2 anomaly was +3.4°C and the Region 3.4 anomaly was +1.8°C for the week centered around July 1. For the past six weeks, the ENSO Region 1+2 anomaly has averaged +2.80°C and the ENSO Region 3.4 anomaly has averaged +1.52°C. The ongoing El Niño will continue to strengthen through the summer. The SOI is not available due to data feed issues. This could be an extended issue. The preliminary Arctic Oscillation (AO) was +1.023 today. Based on sensitivity analysis applied to the latest guidance, there is an implied near 61% probability that New York City will have a warmer than normal July (1991-2020 normal). July will likely finish with a mean temperature near 78.6° (1.1° above normal). Supplemental Information: The projected mean would be 2.1° above the 1981-2010 normal monthly value.
-
Occasional Thoughts on Climate Change
donsutherland1 replied to donsutherland1's topic in Climate Change
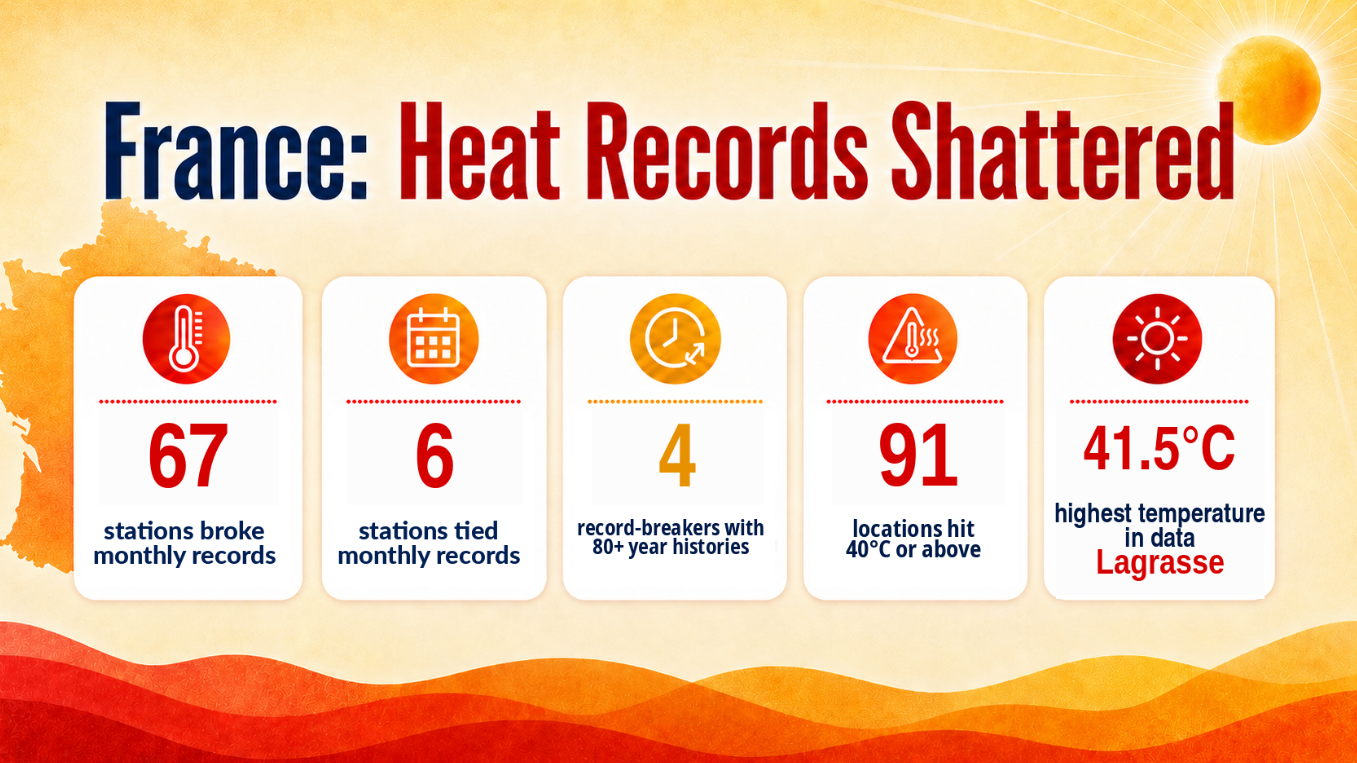
Just as had been the case in 2019, France is being hit by heatwave after heatwave. Following June's record-breaking heat, France is again in the midst of an extreme heatwave. Dozens of July monthly records have fallen. The next 5-7 days will feature a continuation of excessive heat.
-
Snow rooms: https://www.nytimes.com/2026/07/04/style/snow-rooms-home-technoalpin.html?unlocked_article_code=1.v1A.xAsJ.i6M32dlKAMai&smid=url-share
-
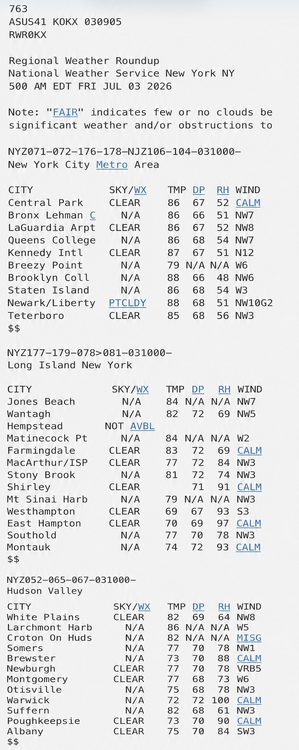
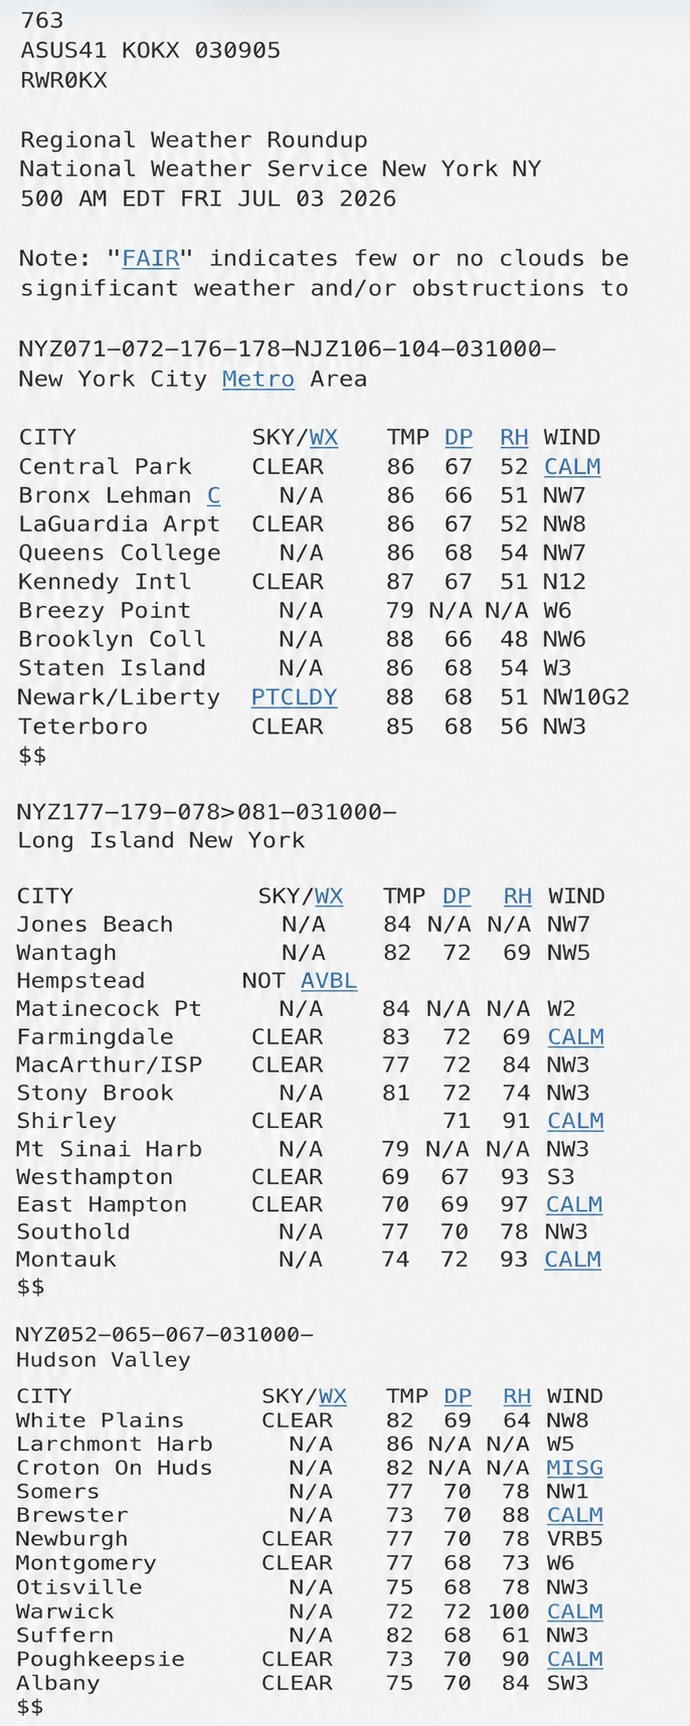
203 NOUS41 KOKX 070111 PNSOKX CTZ005>012-NJZ002-004-006-103>108-NYZ067>075-078>081-176>179-071311- Public Information Statement National Weather Service New York NY 911 PM EDT Mon Jul 6 2026 ...PRECIPITATION REPORTS FROM THE LAST 48 HOURS... Location Amount Time/Date Provider ...Connecticut... ...Fairfield County... Danbury 6.40 in 0815 PM 07/06 CWOP NEWTOWN 5.89 in 0820 PM 07/06 CWOP Danbury 5.52 in 0817 PM 07/06 CWOP 1 WNW Redding 5.38 in 0820 PM 07/06 AWS Shelton 4.65 in 0820 PM 07/06 CWOP Ridgefield 4.34 in 0823 PM 07/06 AWS 2 SW Newtown 4.22 in 0515 PM 07/06 Amateur Radio SHELTON 4.20 in 0811 PM 07/06 CWOP Redding Ridge 4.18 in 0815 PM 07/06 CWOP Bridgeport Airport 4.16 in 0822 PM 07/06 ASOS REDDING 4.12 in 0819 PM 07/06 CWOP Weston 3.33 in 0825 PM 07/06 AWS Stamford 3.32 in 0820 PM 07/06 AWS Fairfield 3.29 in 0815 PM 07/06 CWOP Westport 3.25 in 0815 PM 07/06 CWOP STAMFORD 2.26 in 0815 PM 07/06 CWOP Greenwich 2.02 in 0819 PM 07/06 CWOP 3 N New Canaan 1.79 in 0825 PM 07/06 AWS ...Middlesex County... Saybrook Manor 4.51 in 0825 PM 07/06 AWS Westbrook 4.40 in 0815 PM 07/06 CWOP Clinton 4.01 in 0820 PM 07/06 AWS MOODUS 3.44 in 0816 PM 07/06 CWOP 3.5 NW Durham 2.92 in 0800 PM 07/06 HADS Durham 2.78 in 0817 PM 07/06 CWOP Chester Center 2.7 WNW 2.41 in 0643 PM 07/06 COCORAHS ...New Haven County... Milford 5.36 in 0815 PM 07/06 CWOP Stony Creek 5.23 in 0816 PM 07/06 CWOP ORANGE 4.79 in 0815 PM 07/06 CWOP HAMDEN 4.67 in 0820 PM 07/06 CWOP Seymour 4.61 in 0820 PM 07/06 CWOP New Haven Airport 4.44 in 0827 PM 07/06 ASOS Outer Island, Branford 4.33 in 0825 PM 07/06 AWS PROSPECT 4.22 in 0815 PM 07/06 CWOP New Haven 4.11 in 0825 PM 07/06 AWS 4 NW Hamden 4.06 in 0824 PM 07/06 AWS Oxford 3.98 in 0813 PM 07/06 CWOP Waterbury Airport 3.89 in 0756 PM 07/06 AWOS WOODBRIDGE 3.87 in 0820 PM 07/06 CWOP Bethany 3.51 in 0811 PM 07/06 CWOP Wallingford 3.35 in 0801 PM 07/06 CWOP Meriden Airport 3.33 in 0753 PM 07/06 ASOS NORTH PORT 3.24 in 0815 PM 07/06 CWOP Branford 3.19 in 0815 PM 07/06 CWOP ...New London County... New London 3.18 in 0816 PM 07/06 CWOP Pawcatuck 2.80 in 0820 PM 07/06 CWOP GROTON 2.57 in 0815 PM 07/06 CWOP Lyme 2.56 in 0815 PM 07/06 CWOP SALEM 2.49 in 0815 PM 07/06 CWOP Groton Airport 2.22 in 0756 PM 07/06 ASOS Niantic 2.00 in 0408 PM 07/06 Public Lisbon 1.32 in 0820 PM 07/06 CWOP ...New Jersey... ...Bergen County... 1 SSE Franklin Lakes 1.94 in 0745 PM 07/06 IFLOWS Fair Lawn 1.66 in 0820 PM 07/06 CWOP RIVER EDGE 1.63 in 0815 PM 07/06 CWOP Emerson 1.59 in 0808 PM 07/06 CWOP New Milford 1.54 in 0820 PM 07/06 AWS Oakland 1.51 in 0820 PM 07/06 CWOP Tenafly 1.48 in 0815 PM 07/06 CWOP Bergenfield 1.28 in 0815 PM 07/06 CWOP Lyndhurst 1.23 in 0812 PM 07/06 AWS Bogota 1.21 in 0823 PM 07/06 AWS Lodi 1.20 in 0745 PM 07/06 IFLOWS Hasbrouck Heights 1.16 in 0819 PM 07/06 CWOP Teterboro Airport 1.09 in 0751 PM 07/06 ASOS ...Essex County... 0.6 SW Caldwell 1.88 in 0745 PM 07/06 IFLOWS 1.6 W Millburn 1.55 in 0815 PM 07/06 HADS WEST CALDWELL 1.52 in 0815 PM 07/06 CWOP Montclair 1.37 in 0825 PM 07/06 AWS West Caldwell 1.28 in 0820 PM 07/06 CWOP Caldwell 1.18 in 0816 PM 07/06 ASOS Millburn 1.01 in 0825 PM 07/06 AWS ...Hudson County... Secaucus 1.17 in 0825 PM 07/06 AWS Harrison 1.16 in 0416 PM 07/06 CO-OP Observer ...Passaic County... WAYNE 1.81 in 0815 PM 07/06 CWOP Ringwood 1.72 in 0810 PM 07/06 RAWS West Milford 1.72 in 0745 PM 07/06 IFLOWS North Haledon 1.62 in 0820 PM 07/06 CWOP 1.5 SW Ringwood 1.60 in 0745 PM 07/06 IFLOWS 2 ESE Barry Lakes 1.51 in 0825 PM 07/06 AWS Oak Ridge Reservoir 1.48 in 0745 PM 07/06 COOP 0.8 E West Paterson 1.48 in 0800 PM 07/06 HADS Hawthorne 1.45 in 0820 PM 07/06 CWOP 0.8 SE Pompton Lakes 1.45 in 0800 PM 07/06 HADS 2.1 E Ringwood 1.40 in 0745 PM 07/06 IFLOWS CLIFTON 1.32 in 0818 PM 07/06 CWOP Charlottesburg Reservoir 1.32 in 0745 PM 07/06 COOP Clifton 1.10 in 0820 PM 07/06 AWS Wayne 1.08 in 0815 PM 07/06 CWOP 0.9 S Wayne 1.00 in 0745 PM 07/06 IFLOWS ...Union County... Linden Airport 1.59 in 0815 PM 07/06 AWOS Union 1.54 in 0815 PM 07/06 CWOP Mountainside 1.16 in 0730 PM 07/06 IFLOWS Newark Airport 1.12 in 0751 PM 07/06 ASOS ...New York... ...Bronx County... Fordham 1.46 in 0815 PM 07/06 NYSM 1 NE Harlem 1.30 in 0825 PM 07/06 AWS ...Kings County... BROOKLYN 4.45 in 0811 PM 07/06 CWOP Brooklyn College 3.19 in 0815 PM 07/06 NYSM Dyker Heights 2.39 in 0820 PM 07/06 CWOP Brooklyn 2.16 in 0816 PM 07/06 CWOP ...Nassau County... NORTH MASSAPEQUA 4.62 in 0818 PM 07/06 CWOP North Massapequa 4.28 in 0815 PM 07/06 CWOP Oyster Bay 3.66 in 0815 PM 07/06 CWOP Farmingdale 3.59 in 0815 PM 07/06 CWOP Bethpage 3.49 in 0823 PM 07/06 AWS LONG BEACH 3.46 in 0818 PM 07/06 CWOP Levittown 3.36 in 0815 PM 07/06 CWOP Syosset 3.35 in 0820 PM 07/06 CWOP Massapequa Park 3.08 in 0815 PM 07/06 CWOP SYOSSET 2.99 in 0818 PM 07/06 CWOP Wantagh 2.77 in 0815 PM 07/06 NYSM Bellmore 2.75 in 0818 PM 07/06 CWOP MASSAPEQUA 2.72 in 0816 PM 07/06 CWOP East Rockaway 2.64 in 0818 PM 07/06 CWOP MASSAPEQUA 2.64 in 0818 PM 07/06 CWOP Valley Stream 2.49 in 0816 PM 07/06 CWOP Hicksville 2.40 in 0820 PM 07/06 CWOP 1 ESE Long Beach 2.30 in 0820 PM 07/06 AWS Muttontown 2.23 in 0815 PM 07/06 CWOP Merrick 2.20 in 0735 PM 07/06 CWOP PORT WASHINGTON 2.03 in 0810 PM 07/06 CWOP OLD WESTBURY 1.67 in 0815 PM 07/06 CWOP North Merrick 1.65 in 0815 PM 07/06 CWOP ...New York (Manhattan) County... Battery Park 1.52 in 0824 PM 07/06 AWS Central Park 1.29 in 0751 PM 07/06 ASOS ...Orange County... Otisville 8.40 in 0815 PM 07/06 NYSM Montgomery 6.22 in 0815 PM 07/06 CWOP Newburgh 5.40 in 0806 PM 07/06 CWOP Port Jervis 5.40 in 0818 PM 07/06 CWOP 4 SSE Middletown 5.12 in 0550 PM 07/06 AWS US Military Academy 5.05 in 0655 PM 07/06 RAWS CORNWALL ON HUDSON 4.88 in 0816 PM 07/06 CWOP NEW WINDSOR 4.84 in 0815 PM 07/06 CWOP Vails Gate 4.25 in 0816 PM 07/06 CWOP 1 N Chester 4.01 in 0301 PM 07/06 Cocorahs Chester 3.92 in 0820 PM 07/06 CWOP Warwick 3.92 in 0815 PM 07/06 NYSM 2.6 NW Tuxedo Park 3.68 in 0745 PM 07/06 HADS Harriman 3.03 in 0824 PM 07/06 AWS Port Jervis 3.01 in 0825 PM 07/06 AWS Walden 2.84 in 0818 PM 07/06 CWOP Tuxedo Park 1.84 in 0825 PM 07/06 AWS Washingtonville 1.37 in 0820 PM 07/06 CWOP ...Putnam County... Mahopac 4.03 in 0825 PM 07/06 AWS Lake Carmel 3.94 in 0815 PM 07/06 CWOP Brewster 3.31 in 0815 PM 07/06 NYSM ...Queens County... OZONE PARK 3.52 in 0816 PM 07/06 CWOP NYC/JFK Airport 2.63 in 0751 PM 07/06 ASOS Kew Garden Hills 2.09 in 0815 PM 07/06 NYSM NYC/La Guardia 1.17 in 0829 PM 07/06 ASOS Beechhurst 1.03 in 0820 PM 07/06 CWOP ...Richmond County... College of Staten Island 2.38 in 0815 PM 07/06 NYSM Eltingville 2.30 in 0815 PM 07/06 CWOP ...Rockland County... Stony Point 5.00 in 0824 PM 07/06 AWS 1 SSW Mount Ivy 2.62 in 0824 PM 07/06 AWS New City 2.49 in 0823 PM 07/06 AWS Blauvelt 2.38 in 0815 PM 07/06 CWOP Spring Valley 2.32 in 0815 PM 07/06 CWOP Nanuet 1.83 in 0730 PM 07/06 IFLOWS Bardonia 1.81 in 0823 PM 07/06 AWS Suffern 1.46 in 0815 PM 07/06 NYSM Montebello 1.36 in 0815 PM 07/06 CWOP ...Suffolk County... 1 WSW West Islip 4.41 in 0815 PM 07/06 Trained Spotter North Babylon 4.33 in 0815 PM 07/06 CWOP ORIENT 3.83 in 0820 PM 07/06 CWOP 1 SW Babylon 3.80 in 0758 PM 07/06 Amateur Radio Copiague 3.76 in 0800 PM 07/06 Amateur Radio 1 ESE Copiague 3.70 in 0749 PM 07/06 Public Orient 3.70 in 0846 PM 07/06 CO-OP Observer Melville 3.62 in 0815 PM 07/06 CWOP 1 NNW Copiague 3.56 in 0646 PM 07/06 Trained Spotter East Hampton 3.53 in 0820 PM 07/06 CWOP Farmingdale Airport 3.33 in 0753 PM 07/06 ASOS Miller Place 3.32 in 0820 PM 07/06 CWOP COMMACK 3.25 in 0819 PM 07/06 CWOP Saint James 3.19 in 0814 PM 07/06 CWOP SMITHTOWN 3.11 in 0815 PM 07/06 CWOP 2 WNW Riverhead 3.10 in 0823 PM 07/06 AWS North Patchogue 2.95 in 0820 PM 07/06 CWOP Stony Brook 2.94 in 0811 PM 07/06 CWOP Dix Hills 2.92 in 0819 PM 07/06 CWOP East Setauket 2.91 in 0816 PM 07/06 CWOP ISLIP 2.91 in 0815 PM 07/06 CWOP Blue Point 2.84 in 0815 PM 07/06 CWOP 3.6 NE Calverton 2.84 in 0500 PM 07/06 COOP Islip Airport 2.83 in 0756 PM 07/06 ASOS 1 WNW Oakdale 2.78 in 0636 PM 07/06 Trained Spotter West Gilgo Beach 2.78 in 0820 PM 07/06 CWOP N. Babylon 2.68 in 0820 PM 07/06 CWOP 1 ENE Cold Spring Harbor 2.55 in 0530 PM 07/06 Public ISLIP 2.54 in 0817 PM 07/06 CWOP Sayville 2.45 in 0813 PM 07/06 CWOP FAIR HARBOR 2.44 in 0818 PM 07/06 CWOP Ridge 2.43 in 0816 PM 07/06 CWOP Amityville 2.35 in 0304 PM 07/06 Trained Spotter Old Field 2.27 in 0825 PM 07/06 AWS Shirley 2.27 in 0815 PM 07/06 CWOP Smithtown 2.22 in 0815 PM 07/06 CWOP Eastport 2.21 in 0745 PM 07/06 RAWS Westhampton Airport 2.18 in 0753 PM 07/06 ASOS 1 NNW East Patchogue 2.00 in 0242 PM 07/06 Public Northport 1.97 in 0820 PM 07/06 CWOP Southold 1.97 in 0815 PM 07/06 CWOP Manorville 2.8 NE 1.95 in 0430 PM 07/06 COCORAHS 1 E East Hampton Airport 1.94 in 0755 PM 07/06 AWOS Montauk Airport 1.83 in 0754 PM 07/06 ASOS Remsenburg 1.71 in 0815 PM 07/06 CWOP Kings Park 1.59 in 0815 PM 07/06 CWOP ...Westchester County... 1 S Peach Lake 6.04 in 0825 PM 07/06 AWS Somers 5.51 in 0815 PM 07/06 NYSM Mount Kisco 5.07 in 0819 PM 07/06 CWOP 3 ESE Goldens Bridge 3.29 in 0807 PM 07/06 AWS Yorktown Heights 3.11 in 0820 PM 07/06 AWS Ossining 2.14 in 0818 PM 07/06 CWOP Pleasantville 2.06 in 0825 PM 07/06 AWS Rye Brook 1.98 in 0824 PM 07/06 AWS PORT CHESTER 1.97 in 0817 PM 07/06 CWOP White Plains Airport 1.83 in 0756 PM 07/06 ASOS Tarrytown 1.81 in 0817 PM 07/06 CWOP Armonk 1.72 in 0815 PM 07/06 CWOP CHAPPAQUA 1.71 in 0816 PM 07/06 CWOP Rye 1.65 in 0825 PM 07/06 AWS SCARSDALE 1.58 in 0815 PM 07/06 CWOP New Rochelle 1.55 in 0815 PM 07/06 CWOP &&
-
I can't say that there is a single cause. Stochastic variability, the rapid rise of the ongoing strong El Niño, and myriad marine heatwaves are all affecting the patterns and pattern evolution.
-
The four-day interval between Central Park's high of 100° on July 2 and its high of 69° yesterday is the shortest on record between a high of 100° or above and a high in the 60s. The old record of 10 days was set from July 3-13, 1898 and tied during August 1-11, 1933. Records go back to 1869.
-
As of 7:05 pm, New Haven has picked up 3.14" of rain today. That smashes the daily mark of 1.35" from 2019. It is also the 4th heaviest daily rainfall on record for July.
-
Through 4 pm, storm total rainfall totals included: Bridgeport: 2.09" Farmingdale: 3.23" Islip: 2.52" New Haven: 2.12" New York City-Central Park: 1.01" New York City-JFK Airport: 2.49" New York City-LaGuardia Airport: 1.01" Newark: 0.95" Philadelphia: 2.00" Reading: 1.44" Scranton: 2.18" White Plains: 0.67" Wilmington, DE: 2.17" The following locations have set daily rainfall records for July 6th: Bridgeport (1.14"), Farmingdale (2.92"), Islip (2.43"), New Haven (1.82"), and JFK Airport: 1.70". Periods of rain will likely continue into tomorrow. The heaviest rains will probably affect parts of Connecticut, Long Island, and New Jersey. Lighter amounts are likely in locations such as Central Park and LaGuardia Airport, as the atmosphere is relatively stable. All said, a general 1"-3" rainfall with locally higher amounts near or above 4" is likely across most of the New York City area. The areas favored for heavier rains will see a general 2"-4" with locally higher amounts of 5" or more. Tomorrow will be another cool day with highs mainly in the lower 70s. It will turn warmer to end the week. No excessive heat appears likely through mid-month. The ENSO Region 1+2 anomaly was +3.4°C and the Region 3.4 anomaly was +1.8°C for the week centered around July 1. For the past six weeks, the ENSO Region 1+2 anomaly has averaged +2.80°C and the ENSO Region 3.4 anomaly has averaged +1.52°C. The ongoing El Niño will continue to strengthen through the summer. The SOI is not available due to data feed issues. This could be an extended issue. The preliminary Arctic Oscillation (AO) was +0.966 today.
-
As of 1:30 pm, Bridgeport, Islip, and JFK Airport had set daily rainfall records for July 6. Parts of Brooklyn, Nassau County, and Orange County were reporting flash flooding. Otisville in Orange County had received 7.78" of rain. Brooklyn, Bridgeport, Islip, New Haven, JFK Airport, and Staten Island will likely see more additional rainfall than either Central Park or LaGuardia Airport through the remainder of the event. Parts of central New Jersey, the Connecticut shore and Long Island could see the highest additional rainfall amounts with additional flooding likely.
-
Unfortunately, the BLM site is offline. Observations would be helpful.
-
So far, both JFK Airport and Islip have set daily rainfall records for July 6th.
-
Occasional Thoughts on Climate Change
donsutherland1 replied to donsutherland1's topic in Climate Change
I agree. It was not. Indeed, the heat dome itself wasn't all that anomalous. That monthly records were approached and one all-time record was reached demonstrates how a warmer baseline leads to more extreme conditions even with an approximately one-in-six-year type heat dome. -
A soaking rain is likely tonight into Tuesday. It now appears that a general 1"-3" ranfall with locally higher amounts near or above 4" is likely. Thunderstorms could bring flooding downpours. Highs will reach the middle and upper 70s on both days. It will turn warmer to end the week. No excessive heat appears likely through mid-month. The ENSO Region 1+2 anomaly was +3.1°C and the Region 3.4 anomaly was +1.8°C for the week centered around June 24. For the past six weeks, the ENSO Region 1+2 anomaly has averaged +2.60°C and the ENSO Region 3.4 anomaly has averaged +1.37°C. The ongoing El Niño will continue to strengthen through the summer. The SOI is not available due to data feed issues. The preliminary Arctic Oscillation (AO) was +0.690 today.
-
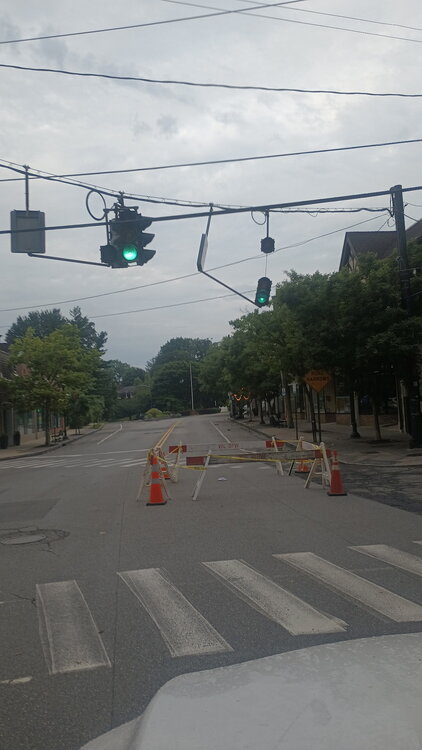
Damaged traffic light from last night’s severe thunderstorms in Larchmont, NY (photo from my brother).
-
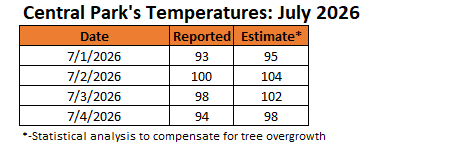
As had likely been the case during the record June 2025 heatwave, Central Park likely had two 100° or above days during the most recent heatwave. Only one such day was recorded due to Central Park's well-documented tree overgrowth. Moreover, July 3, 2026 was likely one of Central Park's hottest days on record, as was the case at surrounding sites: JFK Airport: 102°; LaGuardia Airport: 104°; and, Newark: 105°. As noted previously in this thread, I would run the statistical analysis based on the most recent 30-year period prior to the issue of tree overgrowth. The numbers are below. Since 2010, numerous summer records have been affected by the tree overgrowth. Based on the statistical calculation, below are the summer records that would likely have been tied or broken without the tree overgrowth issue: June 8 — 2011— Calculated 97, record 95, record year(s): 1933 June 9 — 2011— Calculated 99, record 97, record year(s): 1933 June 11 — 2026— Calculated 97, record 95, record year(s): 1973 June 12 — 2026— Calculated 97, record 93, record year(s): 1933, 1973, 2017 June 13 — 2017— Calculated 100, record 96, record year(s): 1961 June 20 — 2012— Calculated 98, record 98, record year(s): 1923 June 21 — 2012— Calculated 99, record 97, record year(s): 1953, 1988 June 23 — 2025— Calculated 97, record 96, record year(s): 1888, 2025 June 24 — 2025— Calculated 102, record 99, record year(s): 2025 ***New June Monthly Record*** June 25 — 2025— Calculated 100, record 99, record year(s): 1943, 1952 June 28 — 2010— Calculated 97, record 96, record year(s): 1969, 1991 June 30 — 2021— Calculated 100, record 99, record year(s): 1964 July 2 — 2026— Calculated 104, record 100, record year(s): 1901, 1966, 2026 July 7 — 2010— Calculated 101, record 100, record year(s): 2010 July 18 — 2012— Calculated 102, record 101, record year(s): 1953 July 22 — 2011— Calculated 106, record 104, record year(s): 2011 ***Tied All-time Record*** July 23 — 2011— Calculated 101, record 100, record year(s): 2011 July 24 — 2022— Calculated 100, record 97, record year(s): 1999, 2010 July 25 — 2025— Calculated 99, record 97, record year(s): 1999 July 29 — 2025— Calculated 100, record 99, record year(s): 1949 July 30 — 2025— Calculated 99, record 98, record year(s): 1917, 1933, 1940, 1988 August 12 — 2016— Calculated 97, record 97, record year(s): 1944 August 12 — 2021— Calculated 97, record 97, record year(s): 1944 August 25 — 2021— Calculated 95, record 95, record year(s): 1948 In sum, the tree overgrowth has already affected a growing number of records.
-
They have been delayed until 9:02. Weather conditions will determine if there are further delays.
-
Today, JFK Airport reached 100° for the third consecutive day. That ties the record for the longest such streak, which was set during July 2-4, 1966. Thunderstorms are possible this evening. Tomorrow will be noticeably cooler with highs reaching the upper 70s or lower 80s. A soaking rain is likely Monday into Tuesday. The potential exists for a general 0.50"-1.50" rainfall with locally higher amounts. Highs will reach the middle and upper 70s on both days. It will turn warmer to end the week. No excessive heat appears likely through mid-month. The ENSO Region 1+2 anomaly was +3.1°C and the Region 3.4 anomaly was +1.8°C for the week centered around June 24. For the past six weeks, the ENSO Region 1+2 anomaly has averaged +2.60°C and the ENSO Region 3.4 anomaly has averaged +1.37°C. The ongoing El Niño will continue to strengthen through the summer. The SOI is not available due to data feed issues. The preliminary Arctic Oscillation (AO) was +0.855 today.
-
Big Heat (and storms?) Week into July 4th Weekend
donsutherland1 replied to yoda's topic in Mid Atlantic
11, 1930. -
A short but severe heatwave will continue to scorch the region into the start of the weekend. However, the most severe heat has already occurred yesterday and today. Through 5 pm, highs included: Allentown: 101° Atlantic City: 105° (old record: 104°, 1966) Baltimore: 102° Boston: 100° Georgetown: 102° (old record: 101°, 1954) Harrisburg: 103° Hartford: 98° Islip: 98° Manchester: 97° New York City-Central Park: 98° New York City-JFK Airport: 100° New York City-LaGuardia Airport: 100° Newark: 102° Philadelphia: 102° Poughkeepsie: 101° Providence: 98° (tied record set 2002) Raleigh: 101° (tied record set in 2012) Reading: 102° Trenton: 101° Washington, DC: 102° (old record: 101°, 1872, 1873 and 1966) Wilmington, DE: 102° (tied record set in 1966) A few areas could see a thunderstorm this evening. Tomorrow will be a few degrees cooler, but still very hot. Temperatures will likely peak in the middle to perhaps upper 90s. Some showers or thunderstorms are possible, especially late in the day. Sunday will turn a bit cooler with readings returning to near normal levels. A soaking rain is possible Monday into Tuesday. The potential exists for a general 0.50"-1.50" rainfall. Highs will reach the middle and upper 70s on both days. It will turn warmer to end the week. The ENSO Region 1+2 anomaly was +3.1°C and the Region 3.4 anomaly was +1.8°C for the week centered around June 24. For the past six weeks, the ENSO Region 1+2 anomaly has averaged +2.60°C and the ENSO Region 3.4 anomaly has averaged +1.37°C. The ongoing El Niño will continue to strengthen through the summer. The SOI is not available due to data feed issues. The preliminary Arctic Oscillation (AO) was +1.312 today.
-
July 2-3, 2026 is only the third such case. The others were: July 2-3, 1966 and July 6-7, 2010.
-
E PA/NJ/DE Summer 2026 Obs/Discussion
donsutherland1 replied to PhiEaglesfan712's topic in Philadelphia Region
The wind shifted back offshore and the temperature rocketed. It shows just how hot this air mass is. -
E PA/NJ/DE Summer 2026 Obs/Discussion
donsutherland1 replied to PhiEaglesfan712's topic in Philadelphia Region
Harrisburg (though not in the Philly CWA) and Newark, too. -
Newark has reached 100°.
-
Sunrise this morning. The temperature at Larchmont Harbor at sunrise was 86°.