donsutherland1
-
Posts
23,988 -
Joined
Content Type
Profiles
Blogs
Forums
American Weather
Media Demo
Store
Gallery
Everything posted by donsutherland1
-
2025-2026 ENSO
donsutherland1 replied to 40/70 Benchmark's topic in Weather Forecasting and Discussion
February 8-9, 2013 was a very big snowstorm, especially in parts of CT. From Fairfield:
-
Occasional Thoughts on Climate Change
donsutherland1 replied to donsutherland1's topic in Climate Change
You wrote this, "Even if CO2 increase was stopped today and reversed - we would all still be doomed. Thus - why bother? Unless perhaps you think we have the ability to stop continental drift (?)" I didn't. All of the points I raised about sea level rise are based on the science. I provided links to papers. Doggerland and Delos are examples. They come from the literature. I get that you want to maintain the status quo and rationalize it. But those rationalizations don't change the reality that the status quo approach is a matter of choice. Choices have consequences. If, what is modeled, proves accurate, the consequences will have been foreseen and avoidable. Those consequences would have resulted from a cumulative set of choices that were made. -
Here's something I found. Unfortunately, it's a general overview of the process. https://www.ncei.noaa.gov/sites/default/files/2022-09/Documentation_Daily_Gridded_Normals V1.0.pdf
-
2025-2026 ENSO
donsutherland1 replied to 40/70 Benchmark's topic in Weather Forecasting and Discussion
February 13, 2014: 9.5"; PNA: -1.097 -
Bridgeport: Raw: 56.0; Normal: 56.4 Islip: Raw: 55.7; Normal: 55.7 JFK: Raw: 57.8; Normal: 57.2 LGA: Raw: 59.3; Normal: 59.6 Newark: Raw: 57.8; Normal: 57.5
-
2025-2026 ENSO
donsutherland1 replied to 40/70 Benchmark's topic in Weather Forecasting and Discussion
It's a Category 5 marine heatwave. -
Here are the rules for NYC: https://www.nyc.gov/site/mayorspeu/resources/heat-season-resources.page#:~:text=Heat Season (October 1st - May 31st),least 62°F%2C regardless of the outdoor temperature.
-
It will turn milder during the weekend. Partly to mostly sunny conditions should prevail. Temperatures will reach the lower and middle 60s tomorrow and then upper 60s to perhaps lower 70s on Sunday. A cold front will move across the region Sunday night. Low pressure will likely form along the front and move across the region. Periods of rain and perhaps some thunderstorms are likely into Monday. A general 0.25"-0.75" with locally higher amounts appears likely. In the 18 past years where Central Park saw at least two 80° or above highs and Newark saw at least two 84° or above highs during the first week of October, the temperature returned to 70° or above on at least one day during the second half of October in 17 (94.4%) of those cases. For all other cases, 84.1% saw at least one such high temperature during the second half of October. Therefore, the sharp cool spell very likely won't mean that New York City has seen its last 70° or above high temperature. The ENSO Region 1+2 anomaly was -0.1°C and the Region 3.4 anomaly was -0.3°C for the week centered around October 8. For the past six weeks, the ENSO Region 1+2 anomaly has averaged -0.12°C and the ENSO Region 3.4 anomaly has averaged -0.42°C. La Niña conditions will likely continue through mid-winter. The SOI was +1.09 today. The preliminary Arctic Oscillation (AO) was -0.328 today. Based on sensitivity analysis applied to the latest guidance, there is an implied 62% probability that New York City will have a warmer than normal October (1991-2020 normal). October will likely finish with a mean temperature near 58.6° (0.7° above normal). Supplemental Information: The projected mean would be 1.7° above the 1981-2010 normal monthly value.
-
2025-2026 ENSO
donsutherland1 replied to 40/70 Benchmark's topic in Weather Forecasting and Discussion
For January, a PNA+ is all but necessary for big snowstorms. New York City's data: Looking at a wider lens that goes back to 1950 when daily teleconnection data became available, 75% of all January snowstorms (n=24) that brought 10" or more snow to Boston, New York City, and/or Philadelphia had a PNA+. All 15 January storms that brought 10" or more snow to at least two of those three cities had a PNA+. 90% of January storms (n=10) that brought 10" of snow to either New York City or Philadelphia had a PNA+.
-
Occasional Thoughts on Climate Change
donsutherland1 replied to donsutherland1's topic in Climate Change
This is getting to absurd "twilight zone" alternate reality territory. Wild claims are made. No scientific literature is cited to support the thesis of doom. Comparing CO2 mitigation to “stopping continental drift” is rhetorically clever but scientifically irrelevant. Continental drift operates over tens of millions of years, not the decades/centuries/millennia under discussion with climate change and the responses to changes in forcing. It’s incorrect to suggest that halting or reversing CO2 rise would have no effect. If CO2 concentrations stabilize or decline, global temperatures would likely follow over decades to centuries, as radiative forcing equilibrates (equilibrium climate sensitivity). The system’s inertia is large but not infinite. "Doomed no matter what” has little or no scientific support. It is nothing more than a rallying cry to stick with an unsustainable status quo. To be sure, a degree of melt/sea-level rise is baked in. However, there is no evidence that an inflection point has been reached where the Greenland and West Antarctic ice sheets are doomed to disappear. The latest estimate for an inflection point for Greenland is 1.7°-2.3°C. For Antarctica, the latest estimates for the West is 1°-3°C and 2°-6°C for the East. One recent study suggested that an additional 0.25°C ocean warming could reach the inflection point for the West Antarctic Ice Sheet. Mitigation can reduce the extent of warming. Society is not helpless. The problem is largely not technical or technological. It's largely political. It's about societal choice, specifically a choice to stick with the status quo while fully aware of the consequences of that choice. The "Doomist" characterization deployed to argue against mitigation is what's foolish, particularly as human agency exists. Alternative paths away from the status quo of dumping some 40 gigatons of CO2 into the atmosphere each year do exist. -
2025-2026 ENSO
donsutherland1 replied to 40/70 Benchmark's topic in Weather Forecasting and Discussion
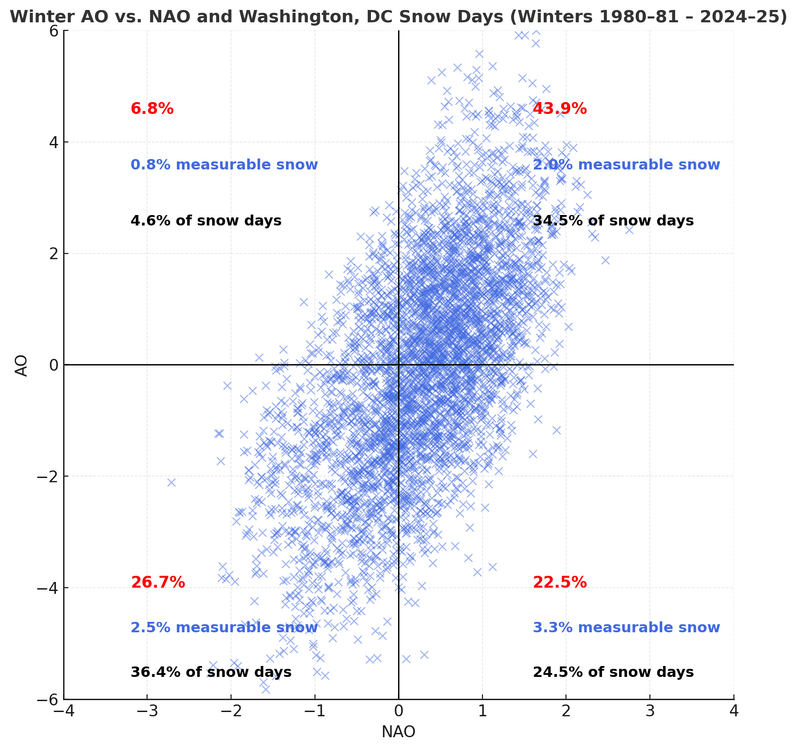
Correlations with teleconnections e.g., the PNA, provide one perspective in addressing questions e.g., will it snow? But to get a better understanding, one needs to look more deeply. For example, the spread of PNA values for snow events can result in a low correlation. However, if one categorizes events by PNA- or PNA+, one can get distinctive differences in the frequency of events e.g., just over two-thirds of New York City's measurable snow events during winter occur when the PNA is positive. Here's daily snowfall and PNA data for New York City's Central Park: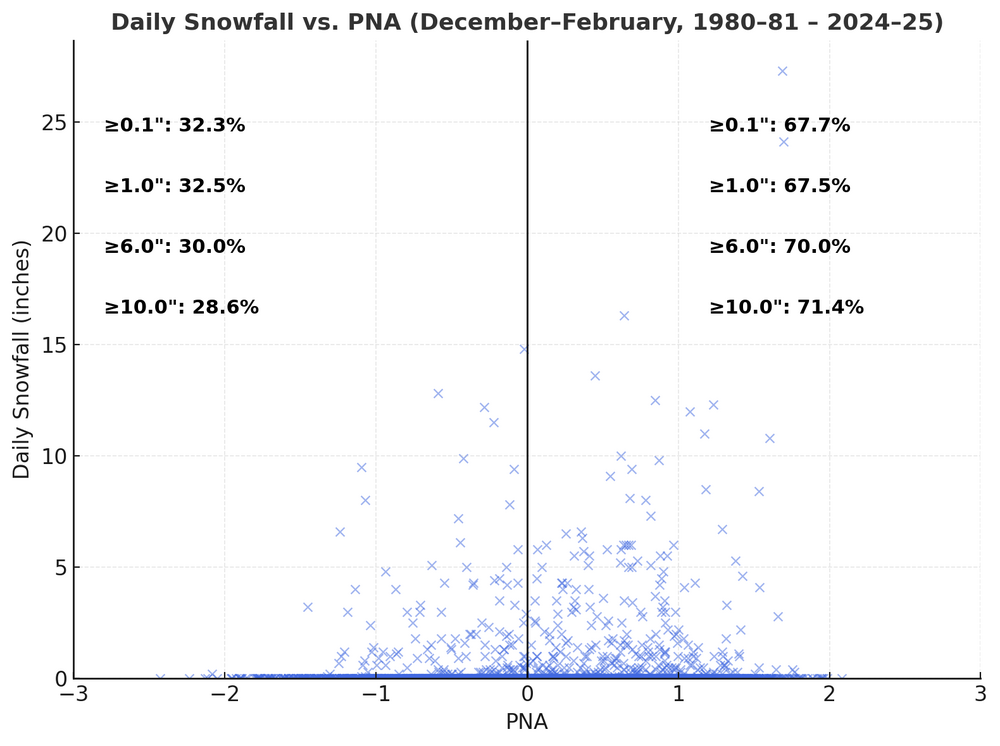
-
2025-2026 ENSO
donsutherland1 replied to 40/70 Benchmark's topic in Weather Forecasting and Discussion
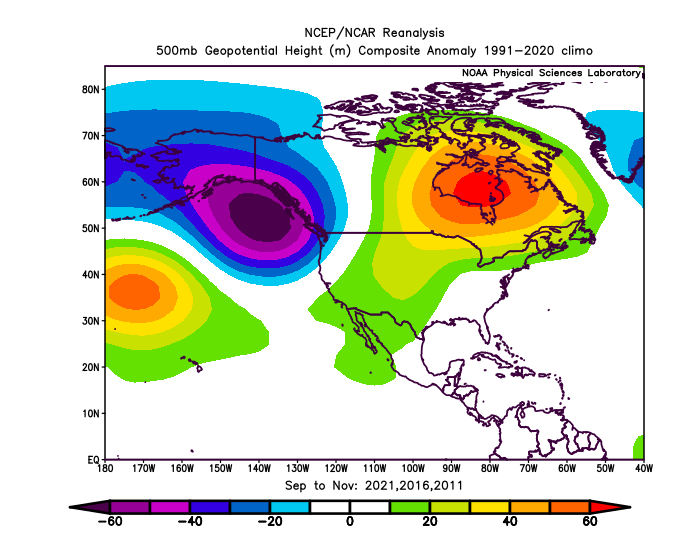
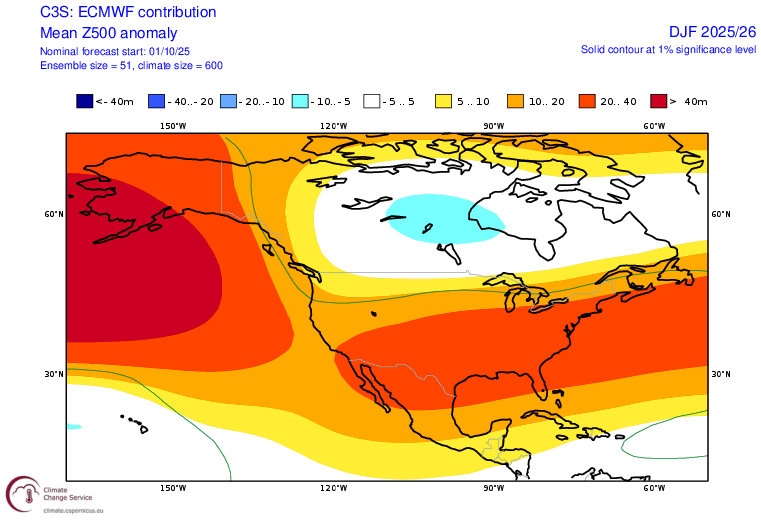
Currently, I am playing with a three-step analog construction method that incorporates ENSO evolution, forecast winter ENSO, and major teleconnections, using root mean square error (RMSE) values to rank potential 500 mb analogs. I am using the 1990-present period to represent the contemporary climate state with its increasingly widespread warm SSTAs and growing incidence of marine heatwaves. I had been considering just using the last 30 years of data but decided to start a little earlier at 1990. Below are maps using the top three analogs. Interestingly enough, 2021-22, which I discussed previously, was among them. Fall 2025: Winter 2025-2026: Fall to Date (through October 14): So far, there are some big differences in the Pacific domain with the most anomalous trough and ridge displaced well north of what the analog group suggests. But this early data covers just over 48% of the fall season. Winter 2025-2026 ECMWF Forecast: Personally, I do not like the use of 2011-12, but I didn't exclude it from this analysis, because this exercise is aimed at developing cases objectively without human subjectivity. One case that I have among my current mix 2024-25 didn't come up in this exercise. This exercise is for purposes of illustration and learning. It will not affect my final choices. Unless there are some big changes, I won't include 2011-12. In contrast, 2024-25 still seems worth including to me. The common reference to 2021-22 gives me added confidence that its emergence as a strong example is real. Ultimately, this exercise is about trying to develop a more objective approach toward picking seasonal cases. If there is promise, I might try adding some additional variables e.g., QBO. Finally, it should be noted that even zonal-looking 500 mb patterns do not preclude periods of synoptic differences e.g., blocking. I suspect that there will be several periods of blocking this coming winter.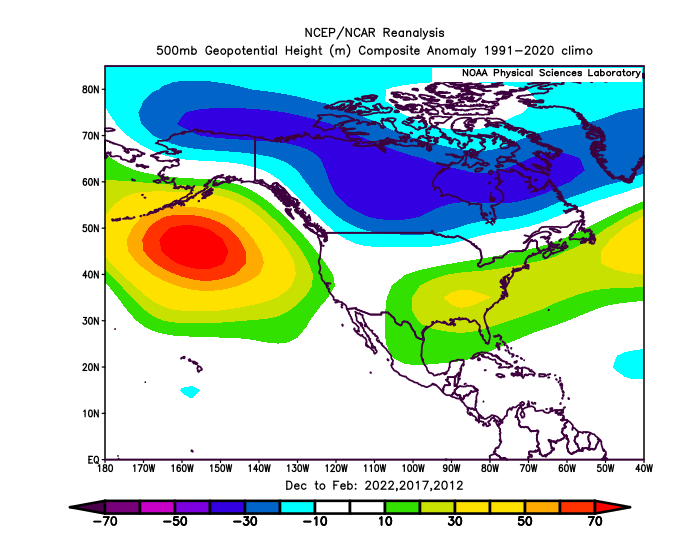
-
Occasional Thoughts on Climate Change
donsutherland1 replied to donsutherland1's topic in Climate Change
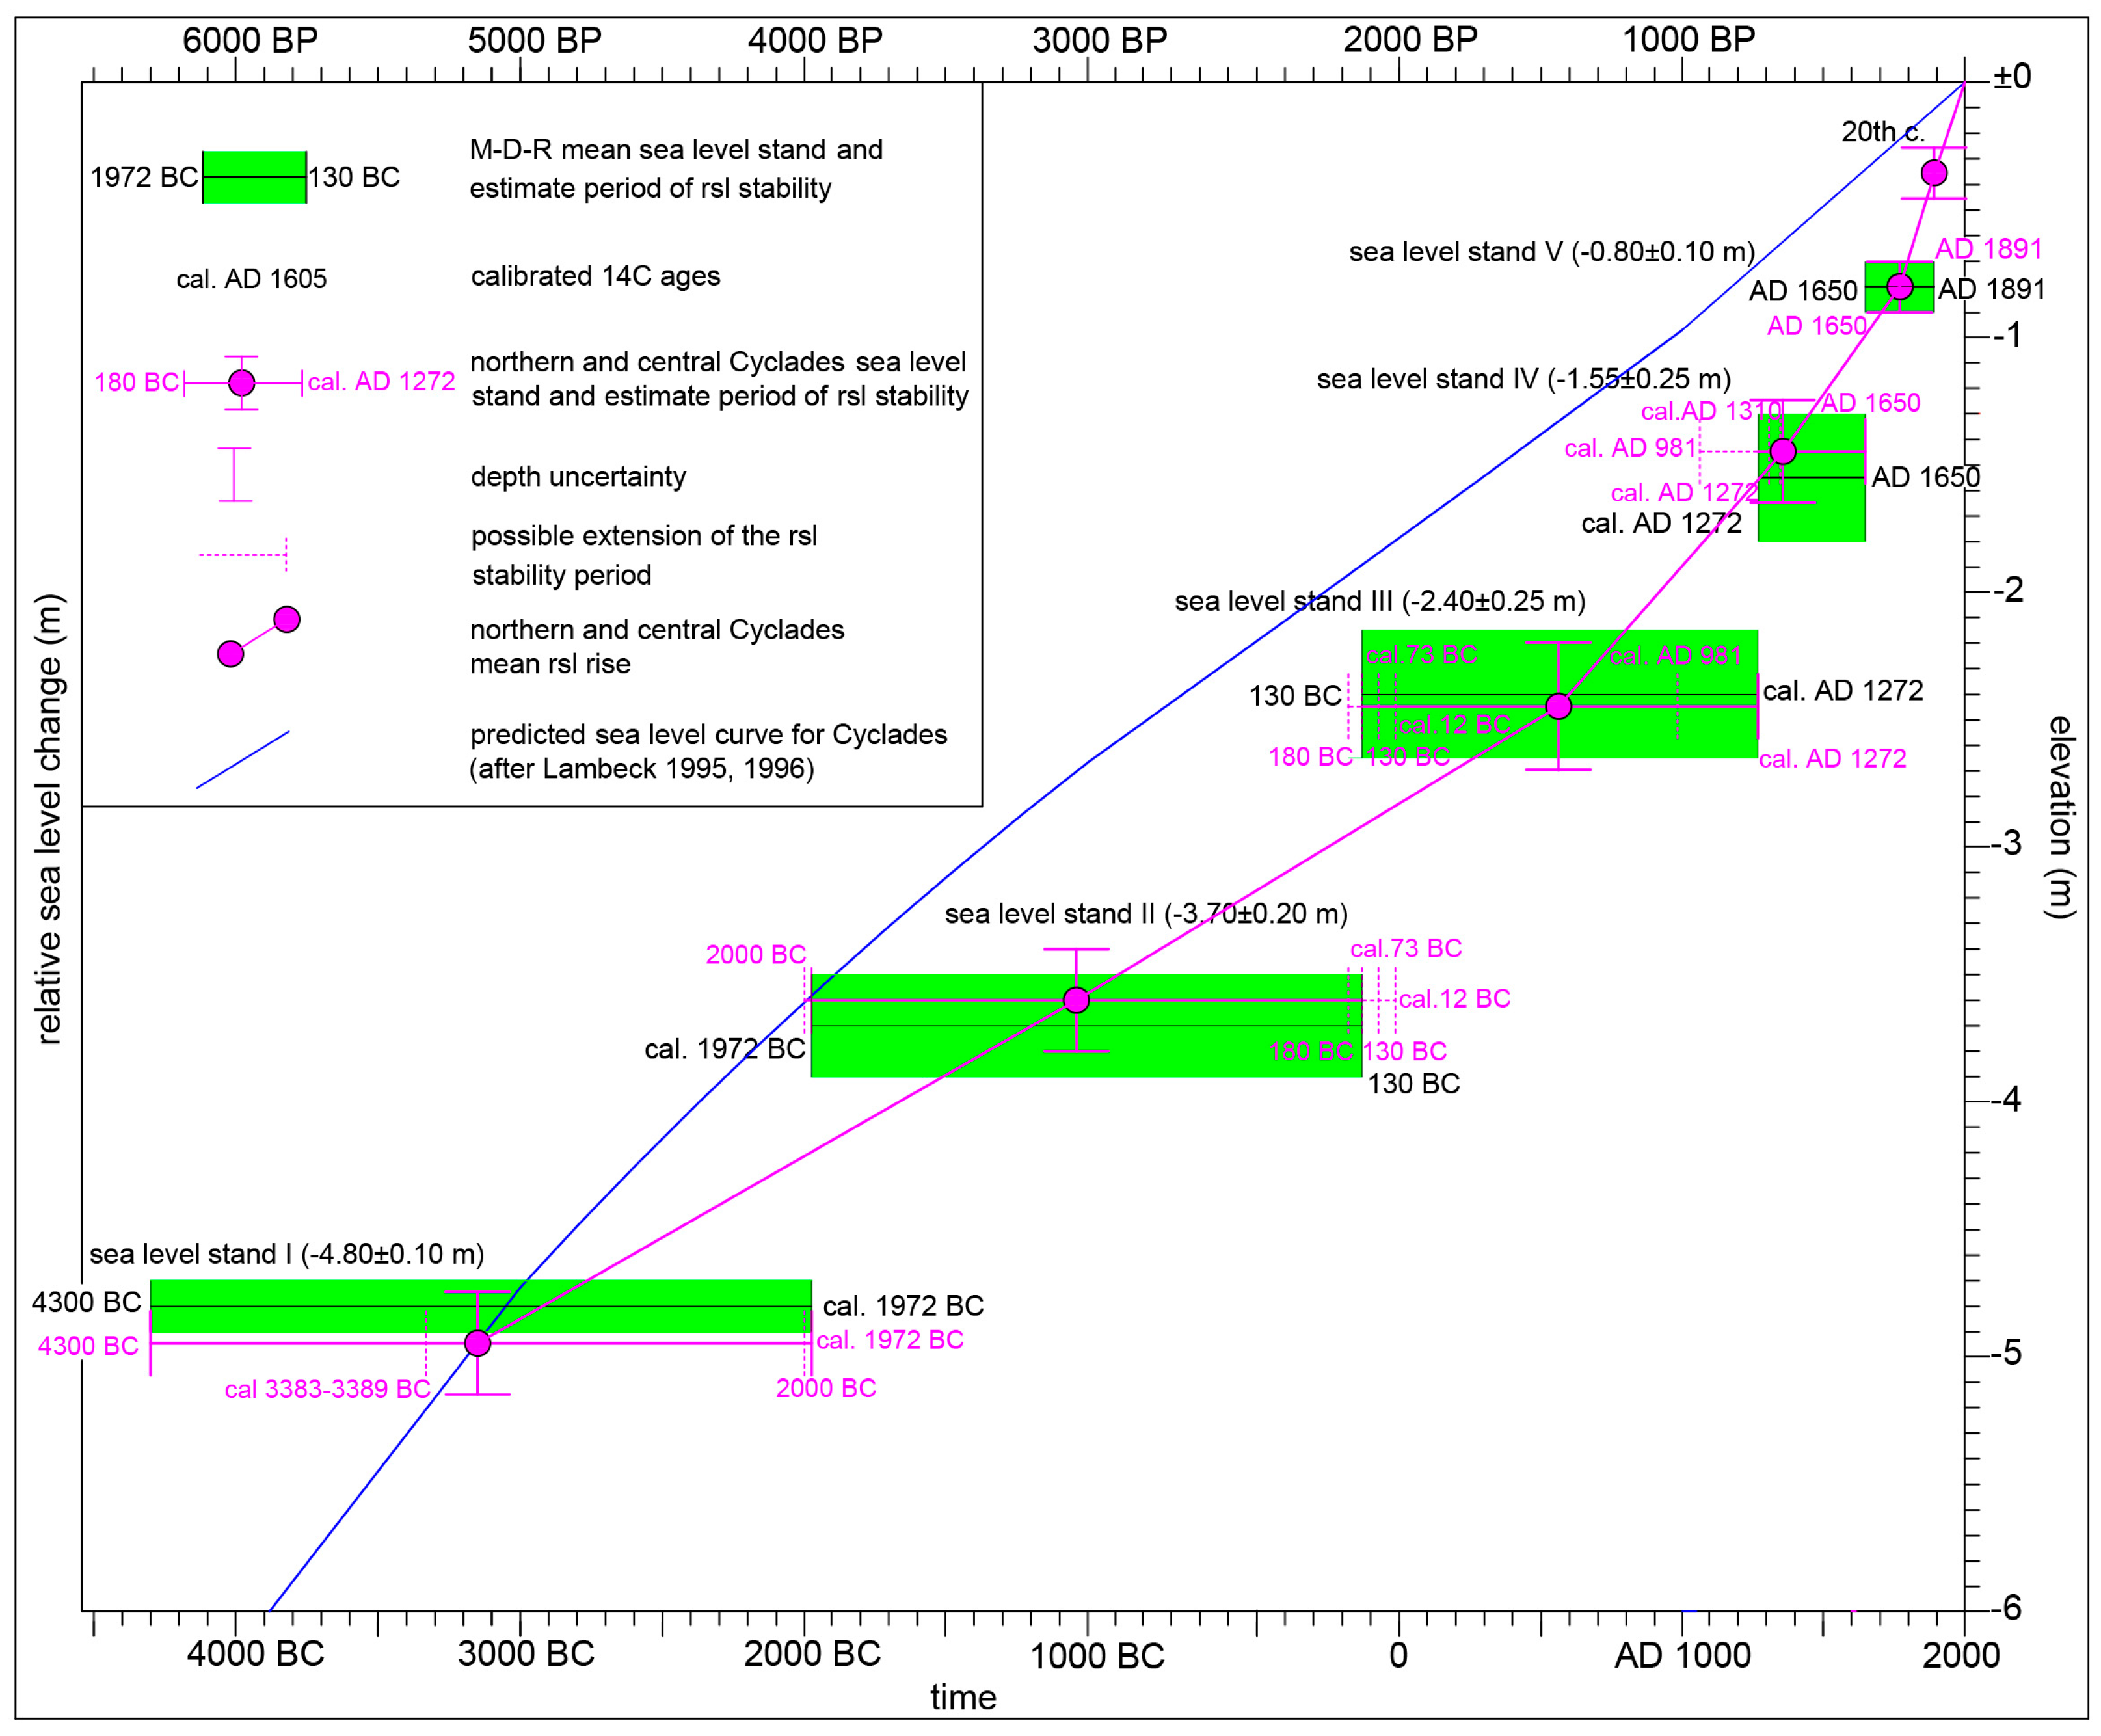
Your claim misses the larger point of my examples. It does not matter whether the sea rises or the land subsides. The result is the same. The water line advances relative to human settlements and ecosystems. At Delos, the submerged temples and quays bear witness to centuries of the intertwined forces of subsidence compounded by accelerating global sea-level rise from thermal expansion and melting ice. These processes do not cancel each other. They reinforce one another. Delos, like Doggerland, stands as a warning of what coastal cities around the world may face as relative sea level climbs ever faster through the 21st century under humanity's choice to continue to inject massive amounts of greenhouse gases into the atmosphere. Sea-level rise is incremental in pace but cumulative in consequence. It undermines foundations, salinizes water tables, and devours shorelines. The crisis is not measured in centimeters per year, but in the permanence of its trajectory. The seas will continue rising for centuries, long after the emissions that drive them have ceased, because the response of the ice caps to the warming is a slow feedback. Calling it “ludicrous” to treat Delos as a cautionary crisis misunderstands the lesson. The near one-meter rise projected by the end of the 21st century and several meters by 2300, will erase vast stretches of today’s coastal infrastructure. Miami, New York, Jakarta, Shanghai, and Bangkok are among vulnerable cities. To apply the dismissal of Delos' lessons and accordingly view the eventual partial inundation of the major cities I listed, among others, as a “non-crisis” is the kind of short-sighted thinking that is produced by the limits of human nature that Tip and I had been discussing. -
We agree that it’s a large adjustment. Unfortunately, I don’t have the specific details.
-
Such lows are occurring later. Central Park: 1961-1990: 10/19; 1991-2020: 10/22; 2000-2025: 10/24 JFK: 1961-1990: 10/17; 1991-2020: 10/21; 2000-2025: 10/22
-
Statistical adjustments are involved. The numbers aren't raw averages. https://www.noaa.gov/explainers/understanding-climate-normals
-
There's been virtually no change. Central Park: 1961-1990: 10/6; 1991-2020: 10/5; 2000-2025: 10/6 JFK: 1961-1990: 10/10; 1991-2020: 10/9; 2000-2025: 10/11
-
The 1981-2010 normals can be found here: https://www.ncei.noaa.gov/access/us-climate-normals/

-
Occasional Thoughts on Climate Change
donsutherland1 replied to donsutherland1's topic in Climate Change
He's wrong. The paper documents sea-level rise that began some 6,000 years ago. -
It was much warmer last October than is likely this time around. Last October had a mean temperature of 60.9° in New York City.
-
Tomorrow morning will again be very chilly. Lows in New York City will be in the middle 40s. 30s will be common outside the City with colder spots falling into the 20s. It will turn milder during the weekend. Partly to mostly sunny conditions should prevail. In the 18 past years where Central Park saw at least two 80° or above highs and Newark saw at least two 84° or above highs during the first week of October, the temperature returned to 70° or above on at least one day during the second half of October in 17 (94.4%) of those cases. For all other cases, 84.1% saw at least one such high temperature during the second half of October. Therefore, the sharp cool spell very likely won't mean that New York City has seen its last 70° or above high temperature. The ENSO Region 1+2 anomaly was -0.1°C and the Region 3.4 anomaly was -0.3°C for the week centered around October 8. For the past six weeks, the ENSO Region 1+2 anomaly has averaged -0.12°C and the ENSO Region 3.4 anomaly has averaged -0.42°C. La Niña conditions will likely continue through mid-winter. The SOI was +3.54 today. The preliminary Arctic Oscillation (AO) was -0.697 today. Based on sensitivity analysis applied to the latest guidance, there is an implied 60% probability that New York City will have a warmer than normal October (1991-2020 normal). October will likely finish with a mean temperature near 58.5° (0.6° above normal). Supplemental Information: The projected mean would be 1.6° above the 1981-2010 normal monthly value.
-
Occasional Thoughts on Climate Change
donsutherland1 replied to donsutherland1's topic in Climate Change
I hyperlinked the paper regarding sea level rise at Delos. A key chart: There was more to the story than war. Moreover, the historic site continues to be reclaimed by the sea. https://www.mdpi.com/2077-1312/12/6/870 In short, I made sure that the information was verifiable.
-
There's one day that's listed with a high of 72° (10/2) that actually had a high of 66°. I'm not sure how the 72° got into the climate record. Every other NYC area location ((BDR: 63, ISP: 67, LGA: 66, NYC: 66, EWR:68, HPN: 64)) + the hourly data shows < 70° for 10/2. During late September/early October, there were recurring issues at the JFK station.
-
2025-2026 ENSO
donsutherland1 replied to 40/70 Benchmark's topic in Weather Forecasting and Discussion
I agree. It's possible that other variables contributed, too, beyond the two utilized e.g., PNA. During the AO+/NAO+ days, 61.8% had a PNA+; for AO+/NAO- days, 56.5% had PNA+. -
2025-2026 ENSO
donsutherland1 replied to 40/70 Benchmark's topic in Weather Forecasting and Discussion
Yes, I made it. Here it is for Washington, DC (KDCA):