donsutherland1
-
Posts
23,988 -
Joined
Content Type
Profiles
Blogs
Forums
American Weather
Media Demo
Store
Gallery
Everything posted by donsutherland1
-
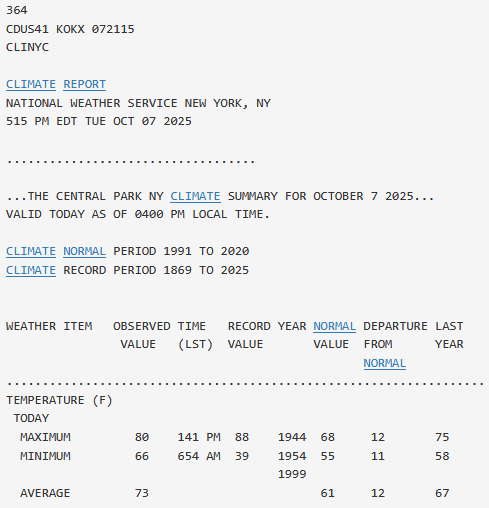
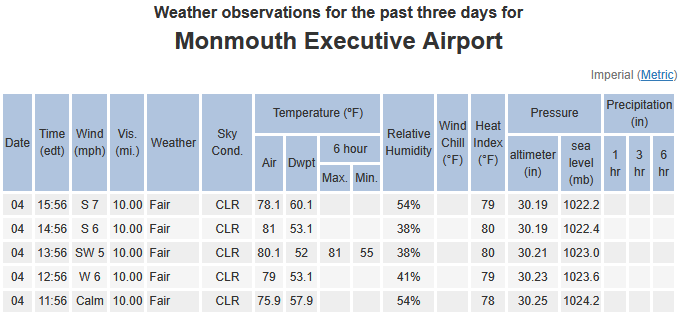
No adjustment. The high of 80 occurred early in the afternoon. The station never checked the preliminary climate report before going on air.
-
Central Park: October 11-14, 1954 Newark: October 15-18, 1908 Both Simultaneously: October 11-14, 1954
-
Today, both Central Park and Newark reached 80° for the fourth consecutive day. The last time both cities had at least four consecutive 80° or above highs in October was way back in 1990.
-
Occasional Thoughts on Climate Change
donsutherland1 replied to donsutherland1's topic in Climate Change
Caribou has been experiencing rapidly warming Octobers. Since 1980, October has warmed 1.1° per decade. The rapid warming coupled with an ideal synoptic pattern contributed to Caribou's experiencing an unprecedented warm spell in October.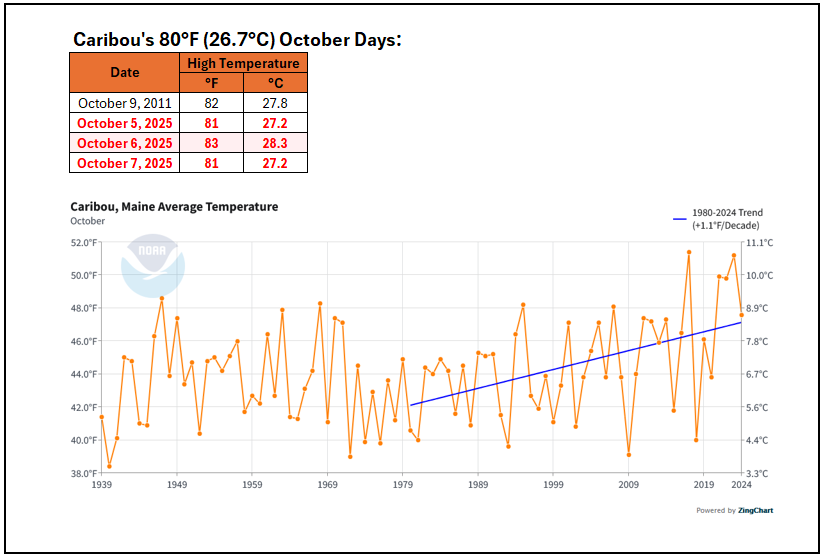
-
The taste of late summer that has prevailed for the past four days will be coming to an abrupt end. A strong cold front will move across the region tonight into tomorrow. The frontal passage will likely bring some heavy showers or thundershowers. The potential exists for 0.50"-1.00" of rain in the region. A shot of much cooler air will follow. Central Park will likely see its first lows in the 40s this season. Temperatures will moderate during Friday through Sunday. A potential nor'easter will need to be watched for late in the weekend to early next week. This storm could bring some showers and gusty rain to parts of the region, with the highest rainfall amounts and strongest gusts likely for the Jersey Shore and parts of Long Island. Coastal flooding is possible. Suppression south and east of the area still remains a plausible scenario. In the 18 past years where Central Park saw at least two 80° or above highs and Newark saw at least two 84° or above highs during the first week of October, the temperature returned to 70° or above on at least one day during the second half of October in 17 (94.4%) of those cases. For all other cases, 84.1% saw at least one such high temperature during the second half of October. Therefore, the sharp cool spell very likely won't mean that New York City has seen its last 70° or above high temperature. The ENSO Region 1+2 anomaly was -0.1°C and the Region 3.4 anomaly was -0.5°C for the week centered around October 1. For the past six weeks, the ENSO Region 1+2 anomaly has averaged -0.15°C and the ENSO Region 3.4 anomaly has averaged -0.43°C. La Niña conditions will likely develop during mid- or late-autumn. The SOI was +8.31 today. The preliminary Arctic Oscillation (AO) was +1.007 today. Based on sensitivity analysis applied to the latest guidance, there is an implied 63% probability that New York City will have a warmer than normal October (1991-2020 normal). October will likely finish with a mean temperature near 59.3° (1.4° above normal). Supplemental Information: The projected mean would be 2.4° above the 1981-2010 normal monthly value.
-
Parts of the region again saw 80° or above heat, with additional records falling in New England. Highs included: Albany: 82° Bangor: 84° (tied record set in 1946) Boston: 84° Burlington: 84° (old record: 82°, 1946 and 1990) Caribou: 83° (old record: 74°, 1946) ***New October record*** Concord: 86° (old record: 84°, 1946 and 1990) Hartford: 84° Manchester: 86° (old record: 82°, 2007) Millinocket: 85° (old record: 82°, 1946) New York City-Central Park: 80° New York City-LaGuardia Airport: 81° Newark: 83° Philadelphia: 82° Plattsburgh: 82° (old record: 80°, 2005) Poughkeepsie: 84° Portland: 86° (old record: 84°, 1946 and 1947) Providence: 81° White Plains: 80° Tomorrow will see a continuation of above normal temperatures. Highs will generally reach the upper 70s to lower 80s. It will also turn windy. A strong cold front will likely cross the region on Wednesday. The frontal passage will likely bring some heavy showers or thundershowers. The potential exists for 0.50"-1.00" of rain. A shot of much cooler air will follow. Central Park will likely see its first lows in the 40s this season. A potential nor'easter will need to be watched for late in the weekend to early next week. It could bring some showers and gusty rain to parts of the region, but suppression south and east of the area remains a plausible scenario. In the 18 past years where Central Park saw at least two 80° or above highs and Newark saw at least two 84° or above highs during the first week of October, the temperature returned to 70° or above on at least one day during the second half of October in 17 (94.4%) of those cases. For all other cases, 84.1% saw at least one such high temperature during the second half of October. Therefore, the sharp cool spell very likely won't mean that New York City has seen its last 70° or above high temperature. The ENSO Region 1+2 anomaly was -0.1°C and the Region 3.4 anomaly was -0.5°C for the week centered around October 1. For the past six weeks, the ENSO Region 1+2 anomaly has averaged -0.15°C and the ENSO Region 3.4 anomaly has averaged -0.43°C. La Niña conditions will likely develop during mid- or late-autumn. The SOI was +8.31 today. The preliminary Arctic Oscillation (AO) was +1.007 today.
-
Winter cancelled/uncancelled banter 25/26
donsutherland1 replied to Rjay's topic in New York City Metro
Good luck with the move. Hopefully, you will get some good snowfall this coming winter. -
A quick note of caution about weekend storminess: The 12z ECMWF is currently an outlier. That a system will likely form out in the Atlantic is a reasonable idea. That it will bring a heavy rainfall to the New York City area is currently speculative. Most ensemble members have < 1" rainfall. There are also more dry ensemble members than 2" or above members, so a dry weekend is also a better possibility than the big rainfall amount shown on the 12z ECMWF. In sum, until there is a stronger and consistent signal, the potential for some rainfall seems appropriate. The idea of a significant nor'easter, especially as shown on the ECMWF, requires a lot more evidence.
-
Late summer warmth prevailed for another day. Highs reached the 80s in most parts of the region. Preliminary highs in the Northeast included: Albany: 83° Bangor: 80° Bridgeport: 80° Burlington: 86° (old record: 83°, 2023) Caribou: 79° (old record: 77°, 1946 and 2005) Hartford: 85° Islip: 83° (tied record from 2002) New Haven: 82° New York City-Central Park: 84° New York City-LaGuardia Airport: 86° Newark: 87° Philadelphia: 83° Poughkeepsie: 86° White Plains: 83° (tied record set in 2017) Montreal, Quebec City, and Toronto were among Canadian cities setting new daily temperature records today. Six locations in Quebec reached 86° (30.0°C) or above. Tomorrow and Tuesday will see a continuation of above normal temperatures. Highs will generally reach the upper 70s to lower 80s. A strong cold front will likely cross the region around midweek. The frontal passage will likely bring some heavy showers or thundershowers. The potential exists for 0.50"-1.00" of rain. A shot of much cooler air will follow. In the 18 past years where Central Park saw at least two 80° or above highs and Newark saw at least two 84° or above highs during the first week of October, the temperature returned to 70° or above on at least one day during the second half of October in 17 (94.4%) of those cases. For all other cases, 84.1% saw at least one such high temperature during the second half of October. Therefore, the sharp cool spell very likely won't mean that New York City has seen its last 70° or above high temperature. The ENSO Region 1+2 anomaly was -0.1°C and the Region 3.4 anomaly was -0.5°C for the week centered around September 24. For the past six weeks, the ENSO Region 1+2 anomaly has averaged -0.12°C and the ENSO Region 3.4 anomaly has averaged -0.42°C. La Niña conditions will likely develop during mid- or late-autumn. The SOI was +4.64 today. The preliminary Arctic Oscillation (AO) was +1.033 today.
-
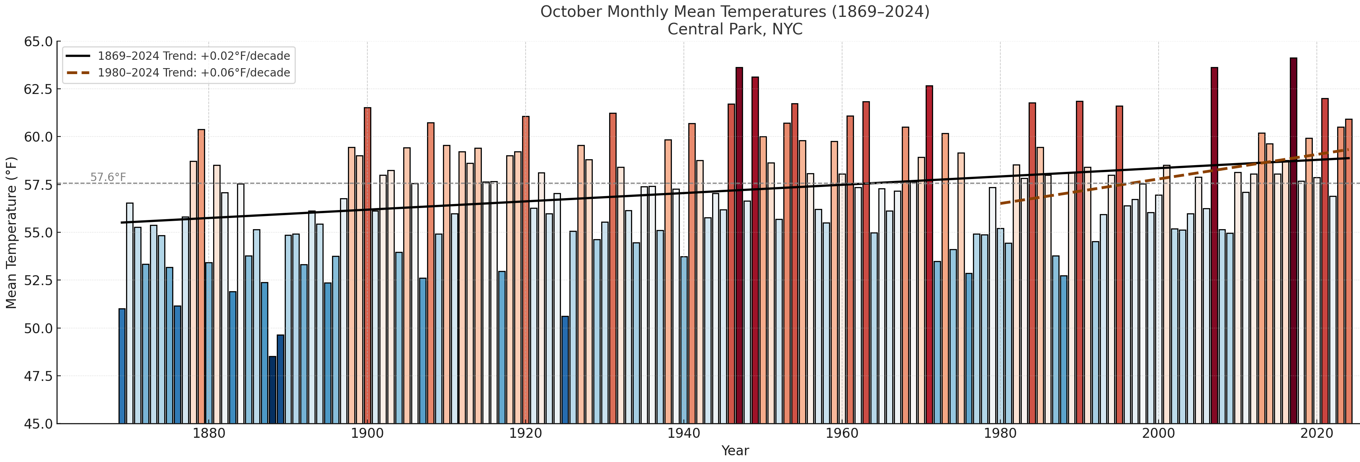
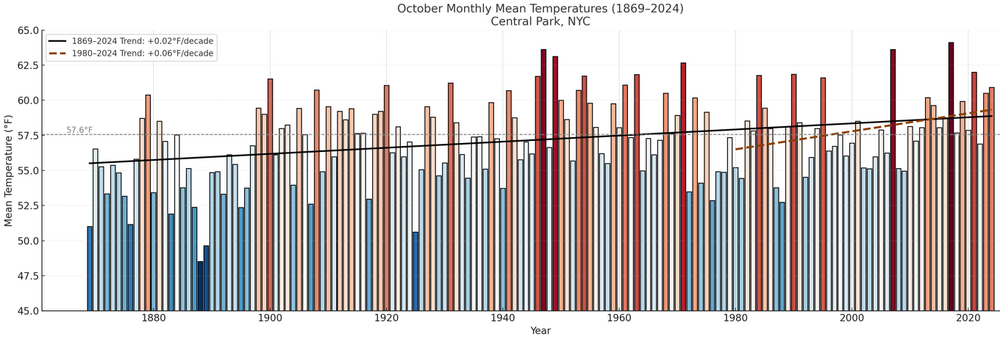
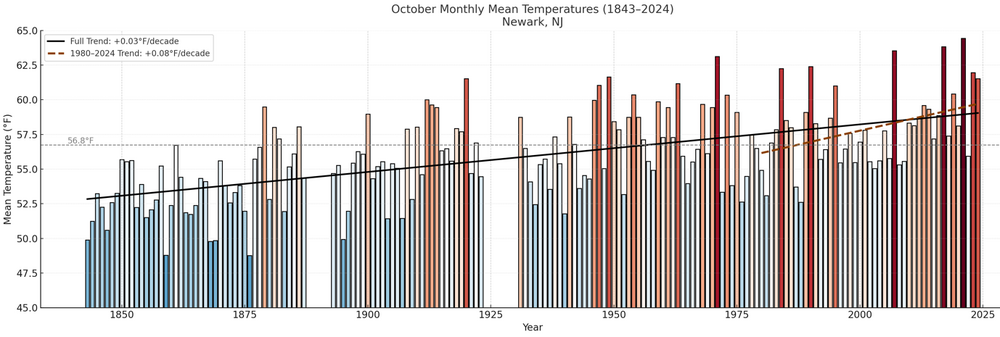
Here's how October has fared in New York City and Newark. The rate of warming has been very gradual, though there has been some acceleration since 1980. The chart's anomalies are based on the 20th century mean temperature for October. For Central Park, the 1991-2020 baseline temperature is 57.9° vs. the 20th century figure of 57.6°. Note: Octobers with large amounts of missing data were excluded.
-
2025-2026 ENSO
donsutherland1 replied to 40/70 Benchmark's topic in Weather Forecasting and Discussion
There were 3 prior cases: 1881-1882, 1889-1890, 1931-1932. 2023-2024 (34.8° was a near miss). Suburbs are cooler. In the larger picture, I don't think Detroit and its vicinity have any worries that winter will essentially become unrecognizable for decades to come. -
2025-2026 ENSO
donsutherland1 replied to 40/70 Benchmark's topic in Weather Forecasting and Discussion
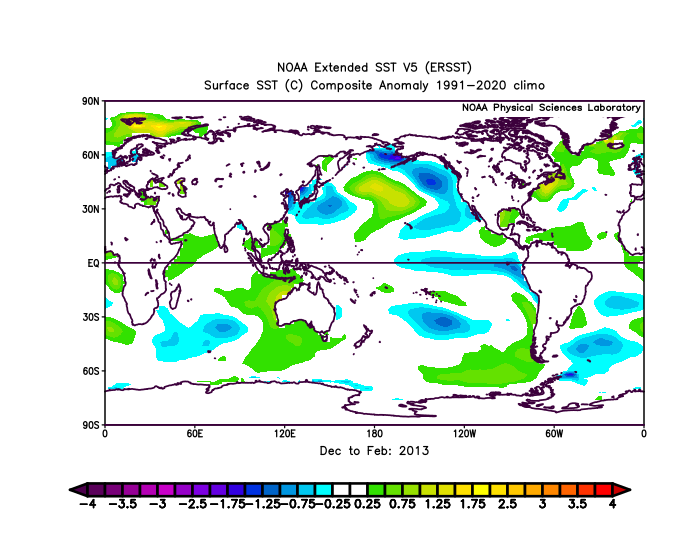
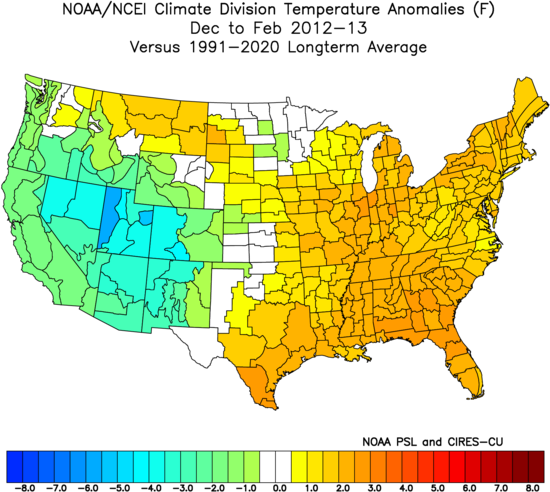
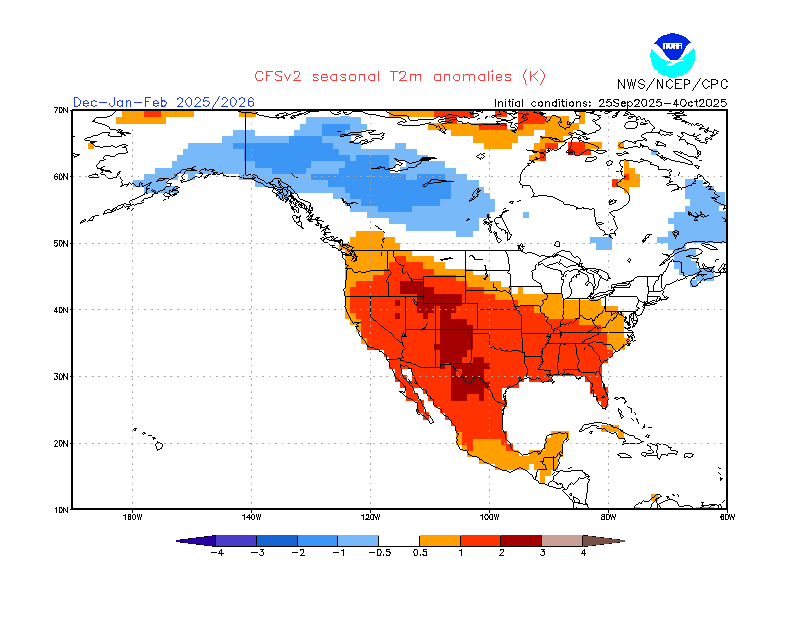
The latest CFSv2 SST forecast is showing an outlook that bears some similarity to the Winter 2012-13 anomalies in the Pacific (ENSO Regions northward). Winter 2012-2013 SSTAs: Winter 2012-13 was classified as a neutral-cool winter on ONI, but a La Niña winter on RONI (DJF: -0.62). That's within the realm of plausible scenarios this winter, though I expect the ENSO R3.4 and ONI anomalies to be a bit cooler this time around. Winter 2012-13 was warmer than normal in the eastern half of the U.S., but it wasn't a "blowtorch" winter. The most notable aspects of this winter were a big southern New England snowstorm and seasonal snowfall totals that ranged from much below normal in Washington, DC, somewhat below normal in New York City, and well above normal in Boston. Snowfall totals ranged from below normal in Chicago to near normal in Detroit. October 2012 saw much more widespread cool anomalies than is likely this time around. Finally, the CFSv2 winter temperature forecast differs markedly from the 2012-13 scenario. Models take into consideration far more than SSTs. This is a key point. One should not get caught up with whether there will or won't be a "blob" at this point in time. SSTs can change. Moreover, they are one variable, even if they are important. Finally, the CFSv2's latest forecast is the coolest so far for the Great Lakes into the Northeast. Meanwhile, late summer conditions will prevail today from the Great Lakes region, across southern Ontario and Quebec, into the northeastern United States.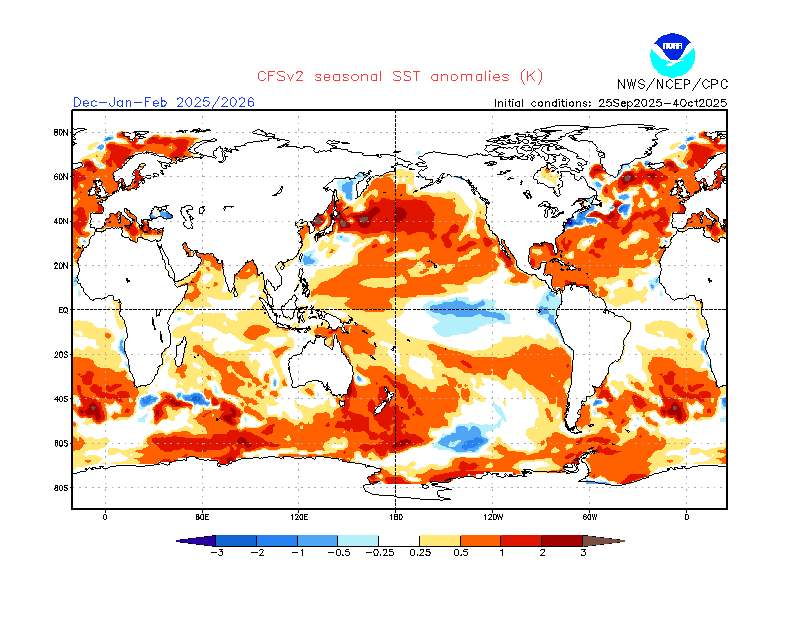
-
From BLM:
-
2025-2026 ENSO
donsutherland1 replied to 40/70 Benchmark's topic in Weather Forecasting and Discussion
I believe any transition to structurally lower snowfall at Detroit is at least several decades away. 35° or above winter warmth will likely remain very uncommon for at least the next 20 or more years. -
Under bright sunshine, much of the region saw temperatures soar into the 80s. Areas immediately on the coastline were a bit cooler. Preliminary highs included: Hartford: 80° Islip: 83° (tied record set in 2023) New York City-Central Park: 82° New York City-LaGuardia Airport: 83° Newark: 87° Poughkeepsie: 82° White Plains: 82° Tomorrow will be another very warm day. Highs will generally reach the upper 70s to lower 80s. A few of the warmest spots will reach the middle and perhaps upper 80s. The warm weather will continue through early next week. Another strong cold front will likely cross the region around midweek. The frontal passage will likely bring some showers or thundershowers. A shot of much cooler air will follow. The ENSO Region 1+2 anomaly was -0.1°C and the Region 3.4 anomaly was -0.5°C for the week centered around September 24. For the past six weeks, the ENSO Region 1+2 anomaly has averaged -0.12°C and the ENSO Region 3.4 anomaly has averaged -0.42°C. La Niña conditions will likely develop during mid- or late-autumn. The SOI was +4.64 today. The preliminary Arctic Oscillation (AO) was +1.096 today.
-
Islip has reached 83°. That ties the daily record set in 2023.
-
92 is its October monthly record.
-
2025-2026 ENSO
donsutherland1 replied to 40/70 Benchmark's topic in Weather Forecasting and Discussion
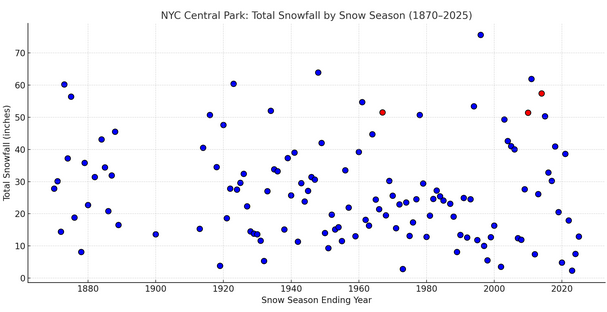
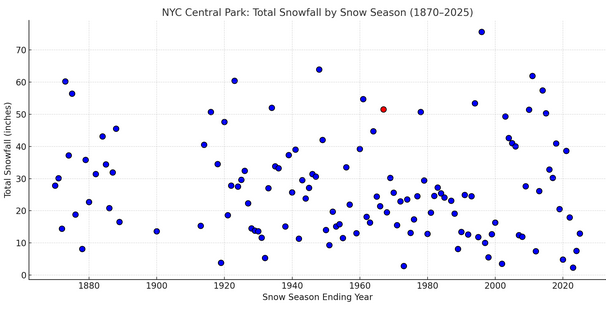
He was referring to New York City (Central Park). Interior sections are cooler than NYC's heat island. For example, using the two seasons you cited, the winter mean temperatures were as follows at nearby SMQ: 2017-18: 31.7° and 2020-21: 32.6°. For Central Park, the winter mean temperatures were 36.1° for both winters. Here's how 50" seasons disappear in New York City's historic climate record: Mean Winter Temperature above 32° (qualifying 50" or above seasons are denoted in red): Mean Winter Temperature above 33° (qualifying 50" or above seasons are denoted in red): Mean Winter Temperature above 34° (qualifying 50" or above seasons are denoted in red): New York City (JFK, LaGuardia, and Central Park) has never had a 50" season with a mean winter temperature above 35.0°. In the broader Mid-Atlantic, Washington, DC has a single case at 35.8°, so under the right circumstances, the upper-bound is higher than what New York City's climate record shows. On the issue of a VEI-7 eruption, it would lead to short-lived but rapid global cooling (perhaps several tenths of a degree C). Mid-latitudes would generally see appreciable cooling. Internal variability can still result in sufficiently cold winters, but the kind of cold typically associated with 50" or above snowfall seasons in New York City is decreasing in frequency. Even last winter was at the outer fringes of temperatures consistent with such snowfall in New York City's climate record. Interior sections away from the coast and outside the major heat islands of the big cities remain sufficiently cool for more frequent 50" or above seasons, and they will remain that way for several more decades at a minimum. However,@bluewavewas addressing New York City. He wasn't making an argument outside of New York City.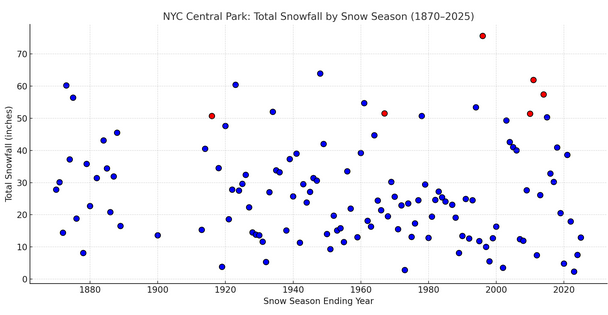
-
2025-2026 ENSO
donsutherland1 replied to 40/70 Benchmark's topic in Weather Forecasting and Discussion
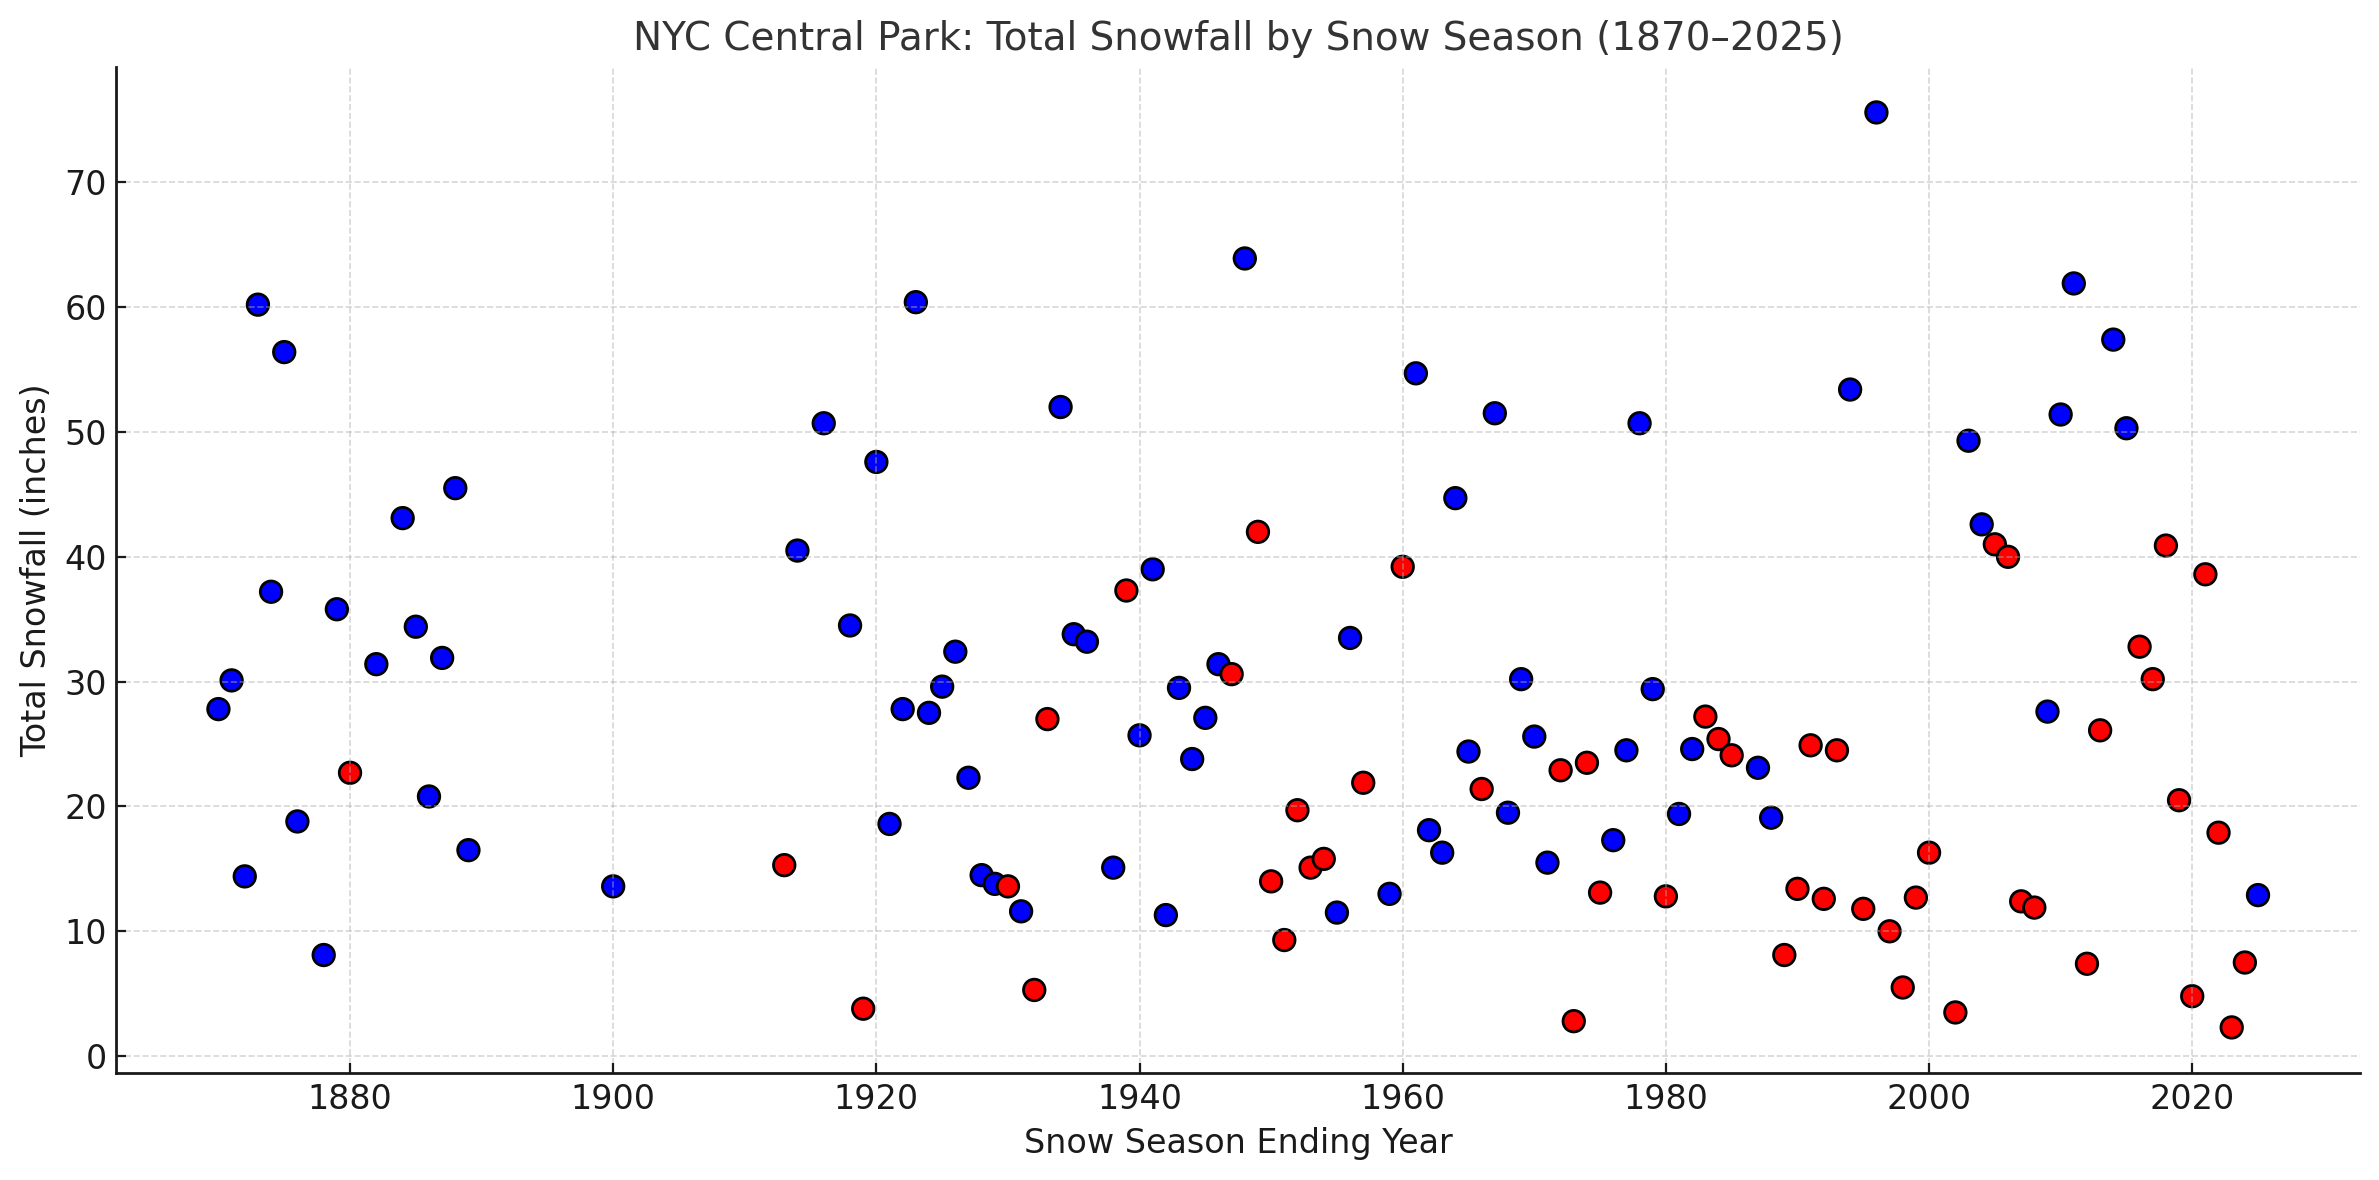
To illustrate @bluewavepoint about warming winters and reduced frequency of 50” snow seasons in NYC, here’s a chart that depicts winters with mean temperatures below 35 (blue) and 35 or above (red) and seasonal snowfall.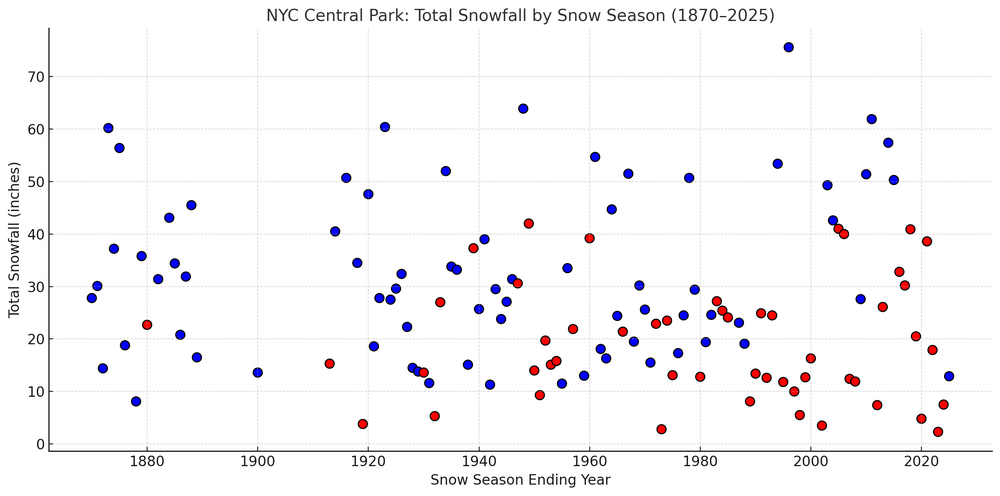
-
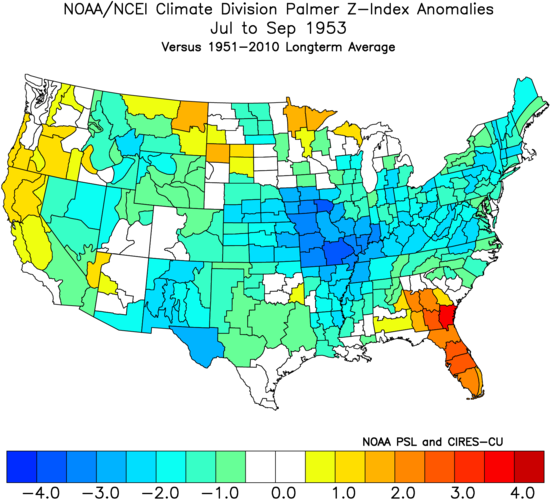
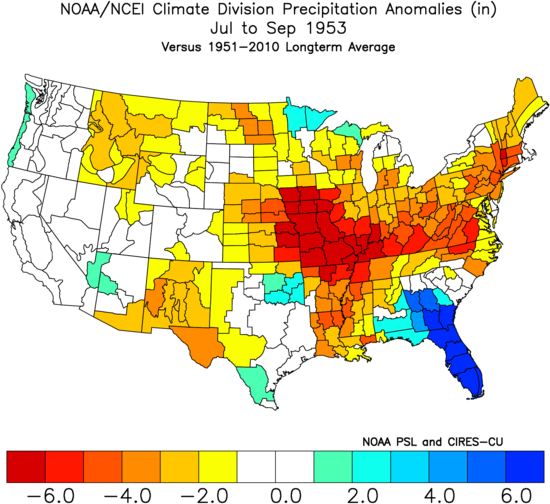
Significant dry conditions (widespread negative Palmer Z-Index anomalies). The greens/blues are dry; the yellows/oranges are wet:
-
Yes. Values are assigned based on their range. One can manually make adjustments.
-
Yes.
-
The shading is based on the historic figures. Next time, I will manually force the same y-axis.
-
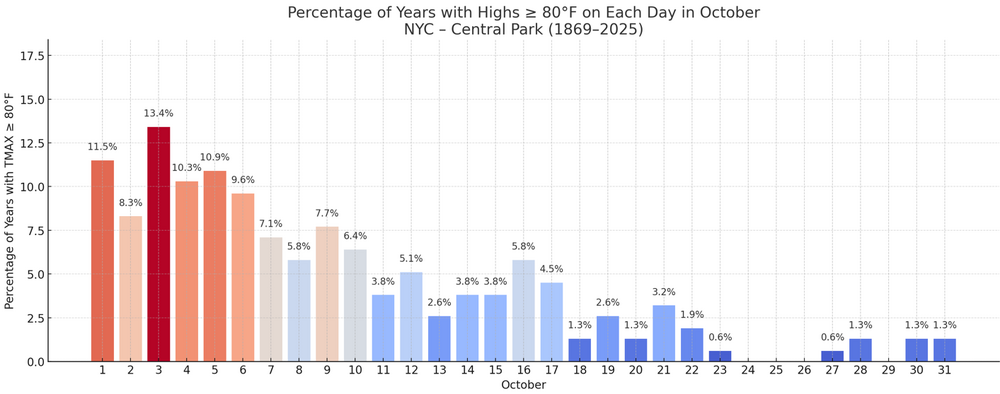
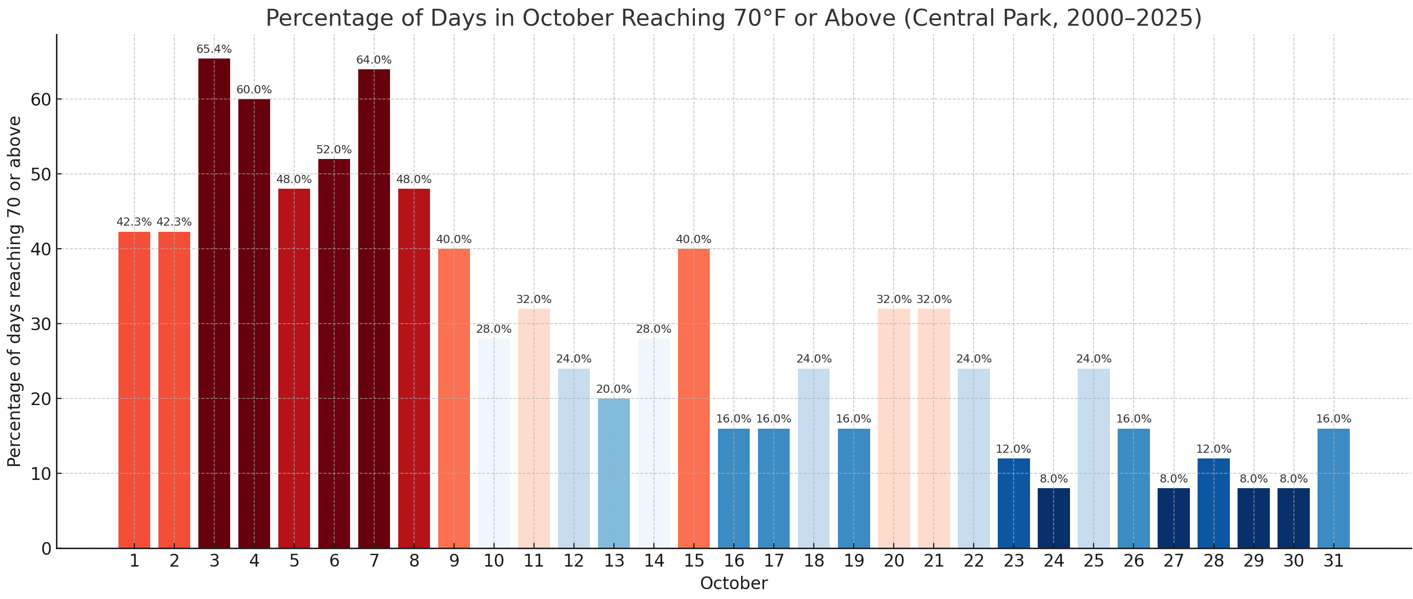
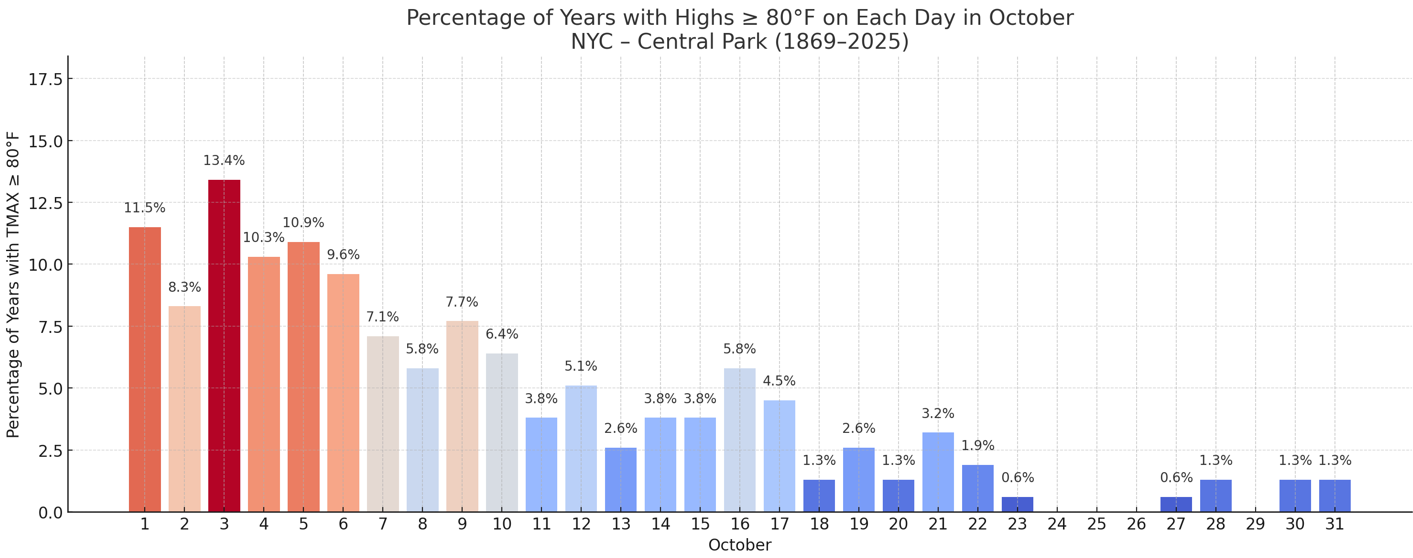
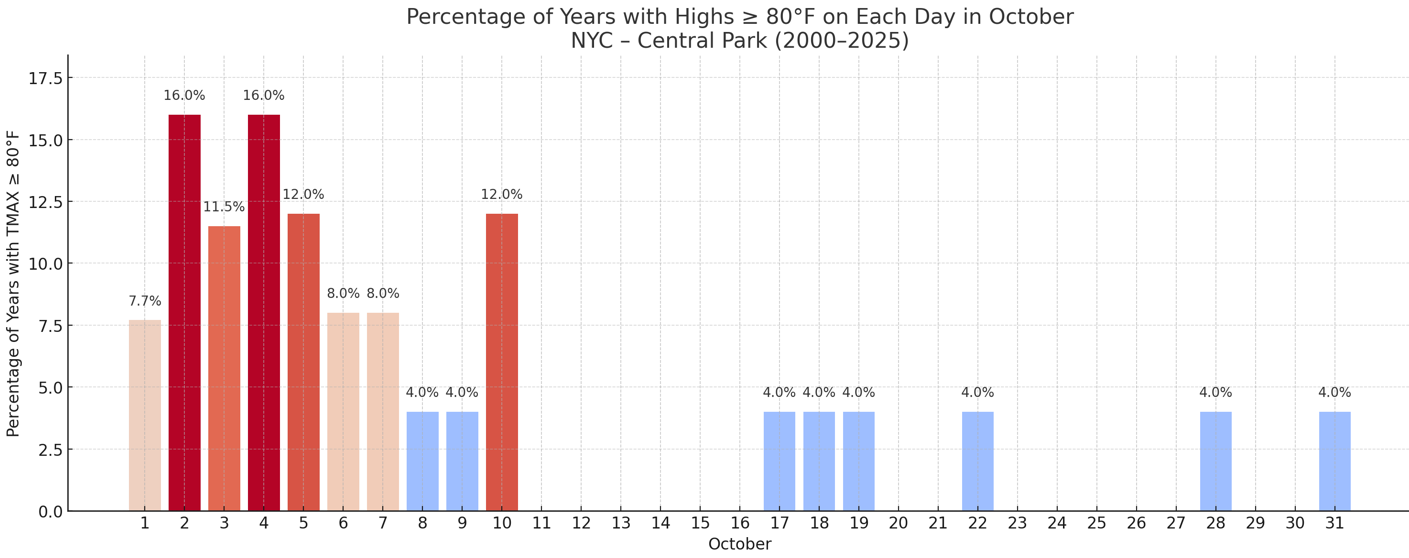
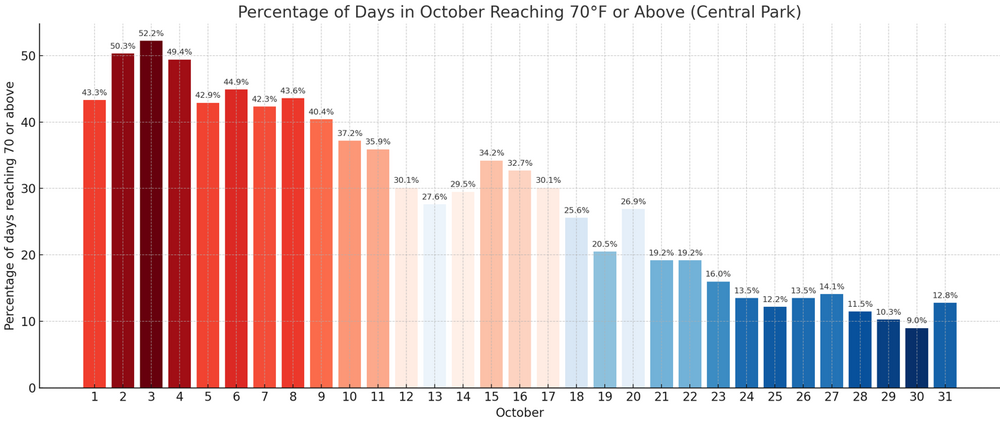
Here you go. Historic: 1869-2025: 2000-2025: Note: October 1-3 goes through 2025 while October 4-31 goes through 2024.

-
Frequency of 80° or above highs at Central Park: 1869-2025: 2000-2025: Note: October 4-31 is from 1869-2024.