donsutherland1
-
Posts
23,759 -
Joined
Content Type
Profiles
Blogs
Forums
American Weather
Media Demo
Store
Gallery
Everything posted by donsutherland1
-
The latest from WPC:
-
2025-2026 ENSO
donsutherland1 replied to 40/70 Benchmark's topic in Weather Forecasting and Discussion
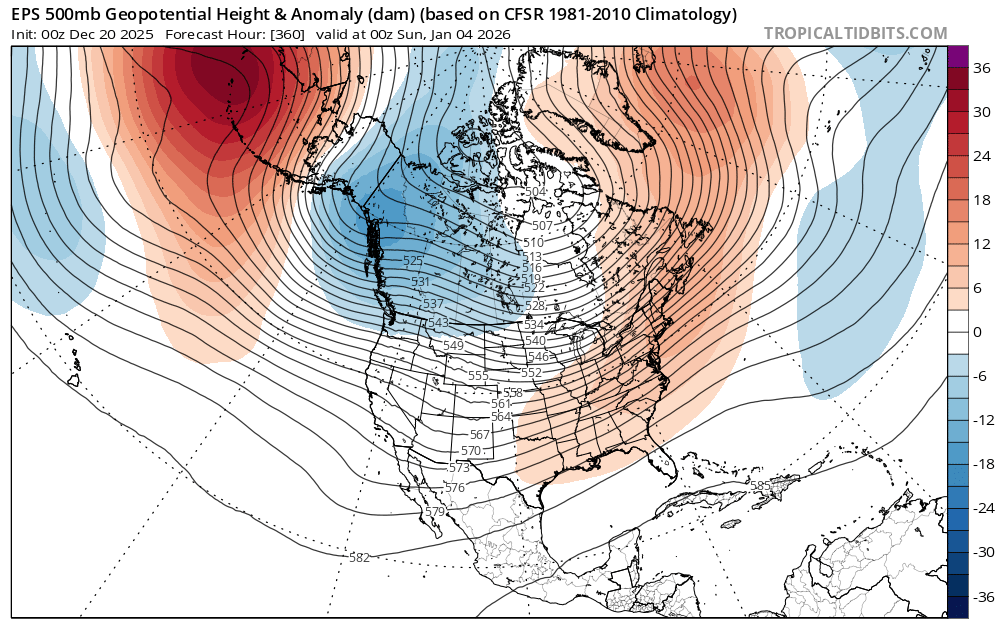
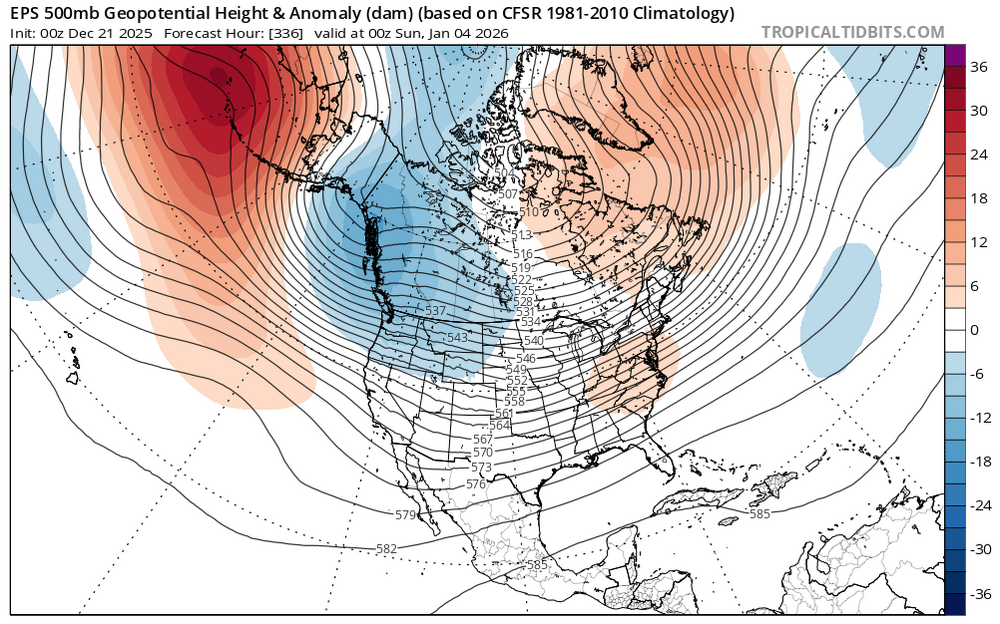
As is often the case during La Niña, winter arrived abruptly. It came on fast, cold, and at times snowy, especially across the Upper Midwest, the Great Lakes, and the Northeast. But the PNA turned increasingly and persistently negative. As its negative state grew stronger, it began to consume winter. Voices quickly rose to declare winter finished before it had truly begun. Some had even pronounced it stillborn from the outset. As Hanukkah arrived and Christmas drew near, fatalism spread like the unwelcome Influenza virus. The earlier December snows faded into memory. What remained were only fragments of seemed to be a winter that nearly was. Others, however, saw something different. They treated the shift not as an ending, but as an invitation. They saw the pause as an opportunity to reflect on moments that failed to fully arrive yet still left their mark. They recognized how seasons, like ideas or paths, often shape us not through completion, but through incompleteness. They held onto their dreams of snow, their faith in winter intact even as it was tested and surrounded by a growing chorus of voices whose belief had long since shattered. Then, on the heels of the winter solstice, the 12/21/2025 0z EPS arrived. 12/20 0z run: 12/21 0z run: Although it was one cycle of an Ensemble at a distant timeframe, it bore a message. It did not guarantee that an epic winter period lay ahead. However, with its smaller Southeast ridge, it whispered that perhaps the worst fears expressed by some might never come to pass. The journey continues.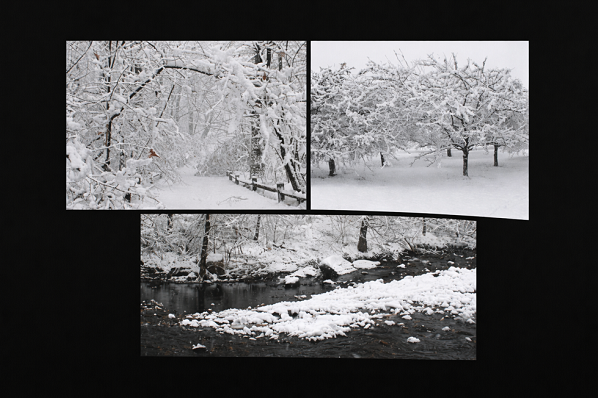


-
Winter cancelled/uncancelled banter 25/26
donsutherland1 replied to Rjay's topic in New York City Metro
While we wait for the next snow... Note: All photos were taken at the New York Botanical Garden on December 14, 2025.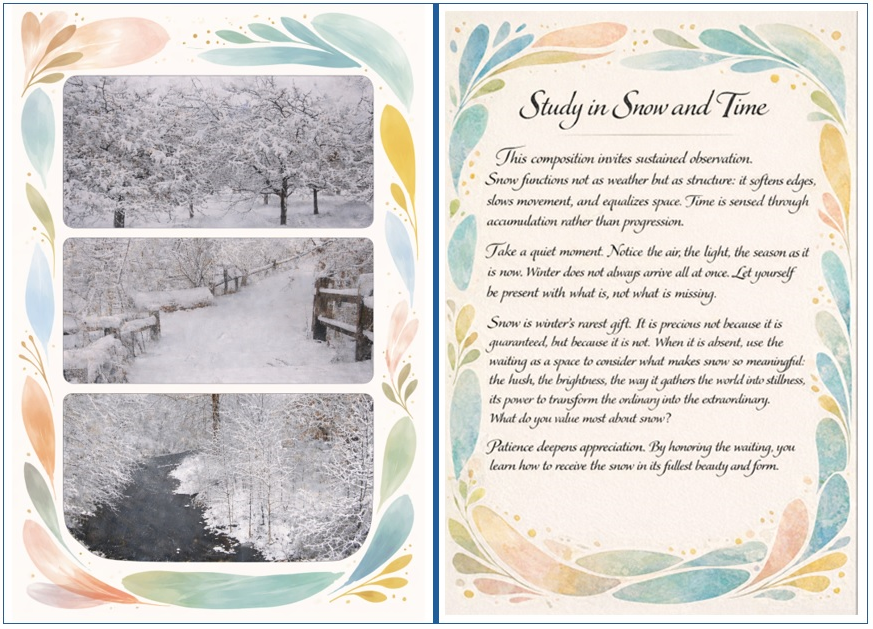
-
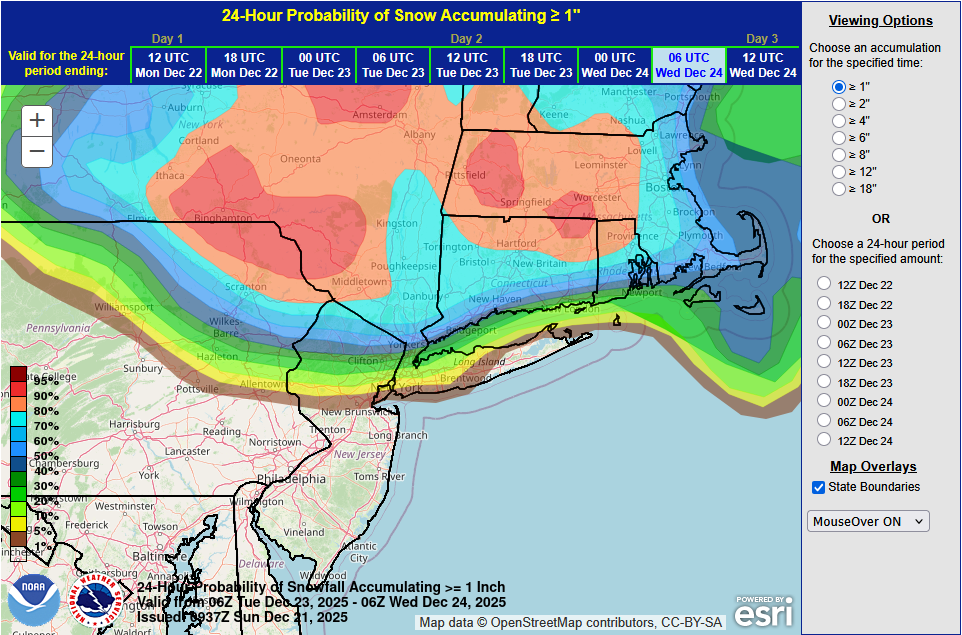
Tomorrow will be a bit milder with temperatures returning to the lower 40s with another brief push of somewhat cooler air following for Monday. No exceptionally cold or warm weather appears likely for the first week of astronomical winter. In terms of precipitation, light snow or snow showers are possible on Tuesday. The closing week of December could experience periodic warmer and cooler days. It now appears that the cooler anomalies will persist mainly in central and northern New England. The probability that December 2025 will have a maximum monthly temperature below 60° has increased further. The last time that happened was in 2019 when the monthly high was 58°. If 2025 has a monthly high below 60°, that would be only the fifth such occurrence since 2000 (2003, 2004, 2005, and 2019 are the cases since 2000). The ENSO Region 1+2 anomaly was -0.3°C and the Region 3.4 anomaly was -0.7°C for the week centered around December 10. For the past six weeks, the ENSO Region 1+2 anomaly has averaged -0.33°C and the ENSO Region 3.4 anomaly has averaged -0.67°C. La Niña conditions will likely continue through at least mid-winter. The SOI was +8.15 today. The preliminary Arctic Oscillation (AO) was +1.749 today. Based on sensitivity analysis applied to the latest guidance, there is an implied near 99% probability that New York City will have a cooler than normal December (1991-2020 normal). December will likely finish with a mean temperature near 34.5° (4.6° below normal). Supplemental Information: The projected mean would be 2.9° below the 1981-2010 normal monthly value.
-
Cooler air is now pouring into the region. The weekend will turn somewhat cooler. No exceptionally cold or warm weather appears likely for the first week of astronomical winter. In terms of precipitation, some rain or snow showers are possible on Tuesday. The closing week of December could experience periodic warmer and cooler days. It now appears that the cooler anomalies will persist mainly in central and northern New England. The probability that December 2025 will have a maximum monthly temperature below 60° has continued to increase. The last time that happened was in 2019 when the monthly high was 58°. If 2025 has a monthly high below 60°, that would be only the fifth such occurrence since 2000 (2003, 2004, 2005, and 2019 are the cases since 2000). The ENSO Region 1+2 anomaly was -0.3°C and the Region 3.4 anomaly was -0.7°C for the week centered around December 10. For the past six weeks, the ENSO Region 1+2 anomaly has averaged -0.33°C and the ENSO Region 3.4 anomaly has averaged -0.67°C. La Niña conditions will likely continue through at least mid-winter. The SOI was -1.19 today. The preliminary Arctic Oscillation (AO) was +2.327 today. Based on sensitivity analysis applied to the latest guidance, there is an implied near 98% probability that New York City will have a cooler than normal December (1991-2020 normal). December will likely finish with a mean temperature near 34.3° (4.8° below normal). Supplemental Information: The projected mean would be 3.1° below the 1981-2010 normal monthly value.
-
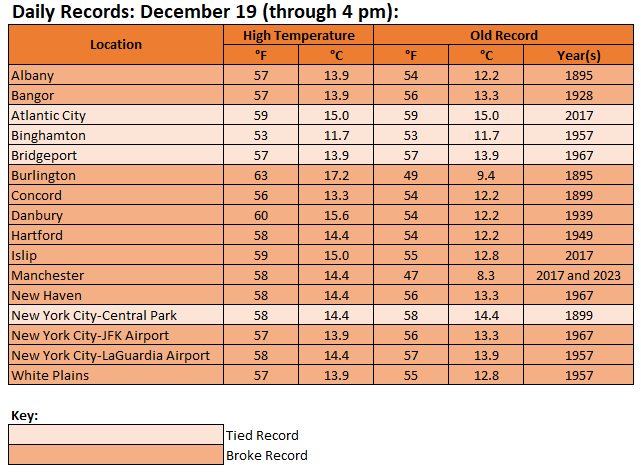
In addition to high winds and heavy rainfall, today was a day of record temperatures in many parts of the Northeast.
-
2025-2026 ENSO
donsutherland1 replied to 40/70 Benchmark's topic in Weather Forecasting and Discussion
For December through the first half of February, that's definitely the case. Big PNA- snowstorms are a rarity. However, once one gets to the second half of February, the PNA- is better (wave lengths are shortening). -
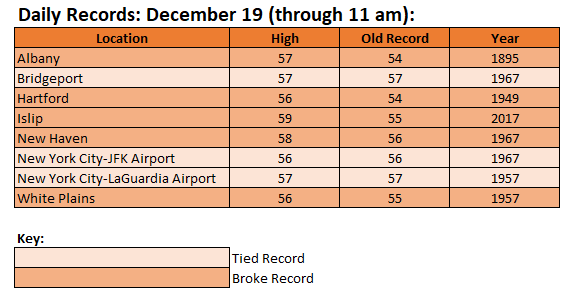
Numerous records have been tied or broken through 11 am:
-
2025-2026 ENSO
donsutherland1 replied to 40/70 Benchmark's topic in Weather Forecasting and Discussion
I agree. I've made some horrific errors. They were good opportunities for learning/improvement. I've never deleted any of my posts, good or bad. -
2025-2026 ENSO
donsutherland1 replied to 40/70 Benchmark's topic in Weather Forecasting and Discussion
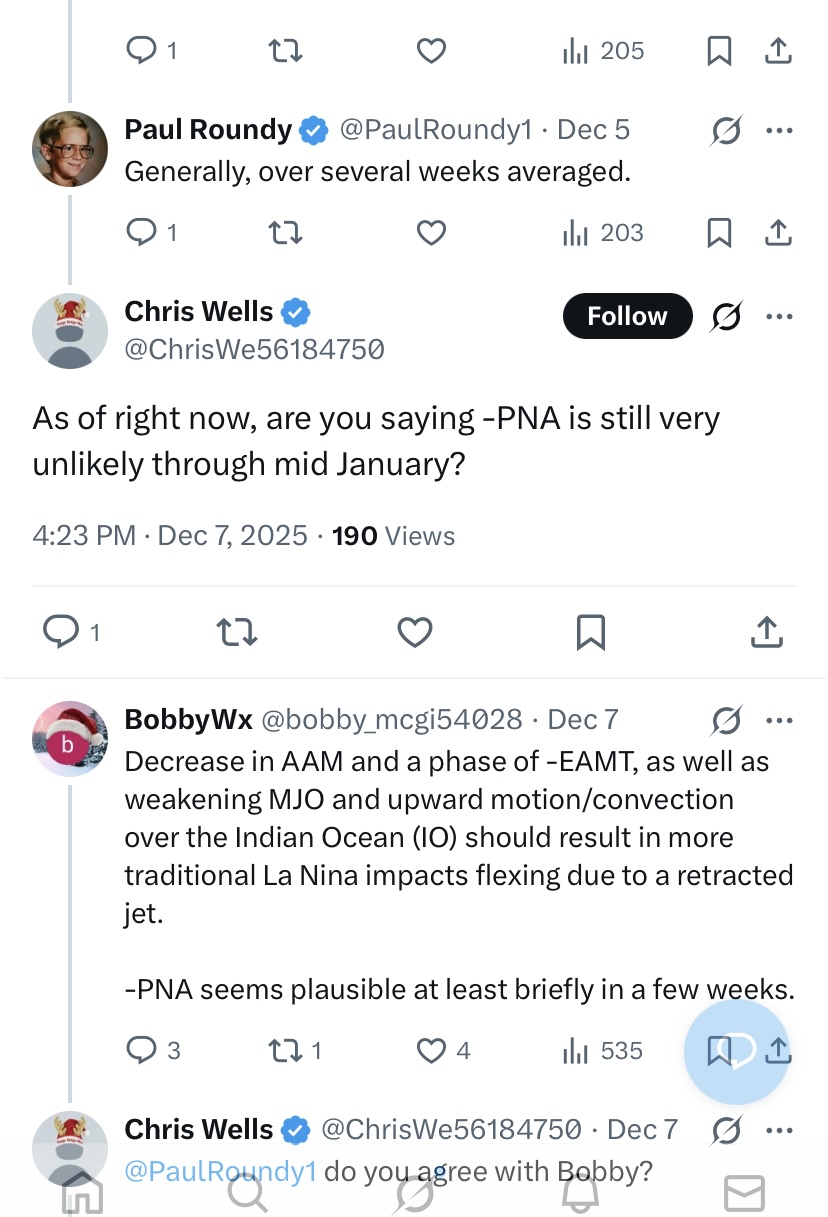
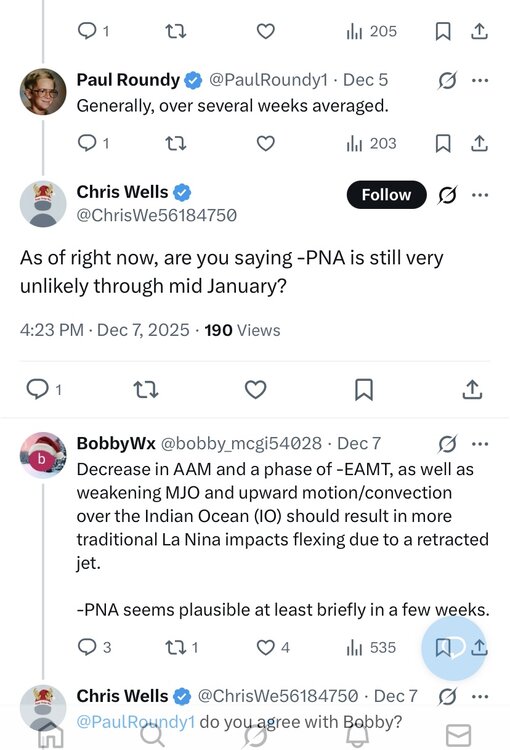
I've bumped this post, because the original embedded tweets calling for a PNA+ in December were deleted (not by @stadiumwave). It's ok to be wrong in a field where there are no crystal balls and variables typically have low coefficients of determination. These low coefficients of determination increase complexity and raise risks of oversimplification. Error is inescapable. It's also ok to change one's thinking. Indeed, the information on how one's thinking evolves can provide insight and also learning opportunities. IMO, it's not ok to simply delete posts to obscure one's errors. Indeed, it is bad practice. That someone I greatly respect and who has done pioneering work on the MJO engaged in this bad practice makes it all the more disappointing. Although the original post is gone, at least some people remember that the prediction made (and one I questioned here) was for a predominantly positive PNA in December. The argument was that the base state did not favor a PNA-. Probably not too surprisingly, the poster's question was ignored. Responding to it would have acknowledged the original position that apparently was deleted.

-
Recent gusts: Bridgeport: 44 mph Farmingdale: 61 mph Islip: 60 mph JFK Airport: 55 mph
-
Bridgeport has now received 0.67" of rain today. That breaks its daily precipitation record for December 19 of 0.64" from 1948.
-
Central Park received 0.44" of rain in the past hour. That breaks the highest hourly figure for December 19th. The old record was 0.32" from 1934.
-
White Plains has also broken its daily record while New Haven has tied its record. More could fall before temperatures start to fall later this morning.
-
2025-2026 ENSO
donsutherland1 replied to 40/70 Benchmark's topic in Weather Forecasting and Discussion
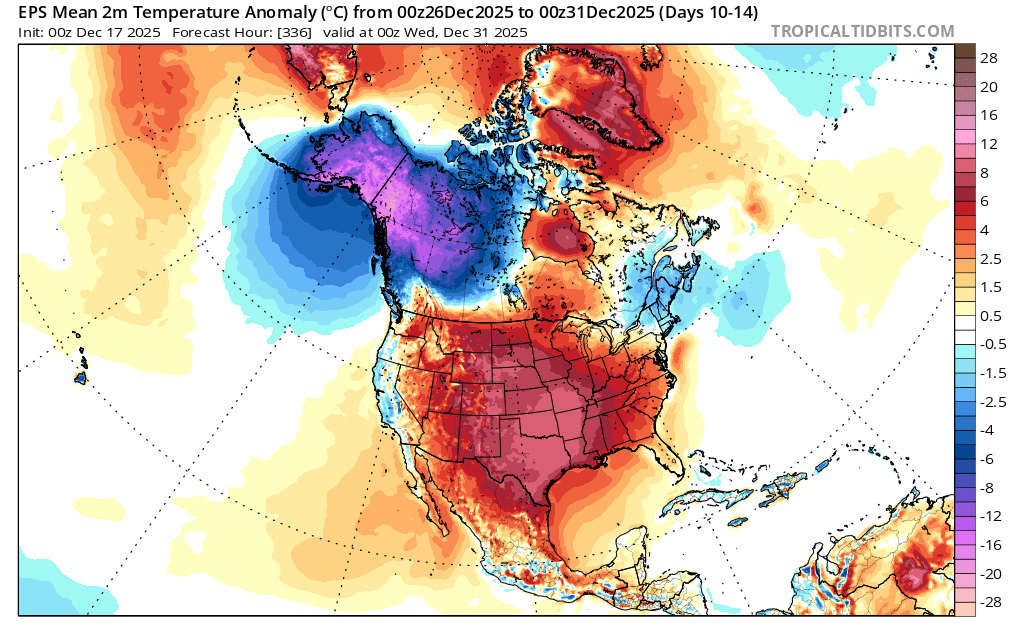
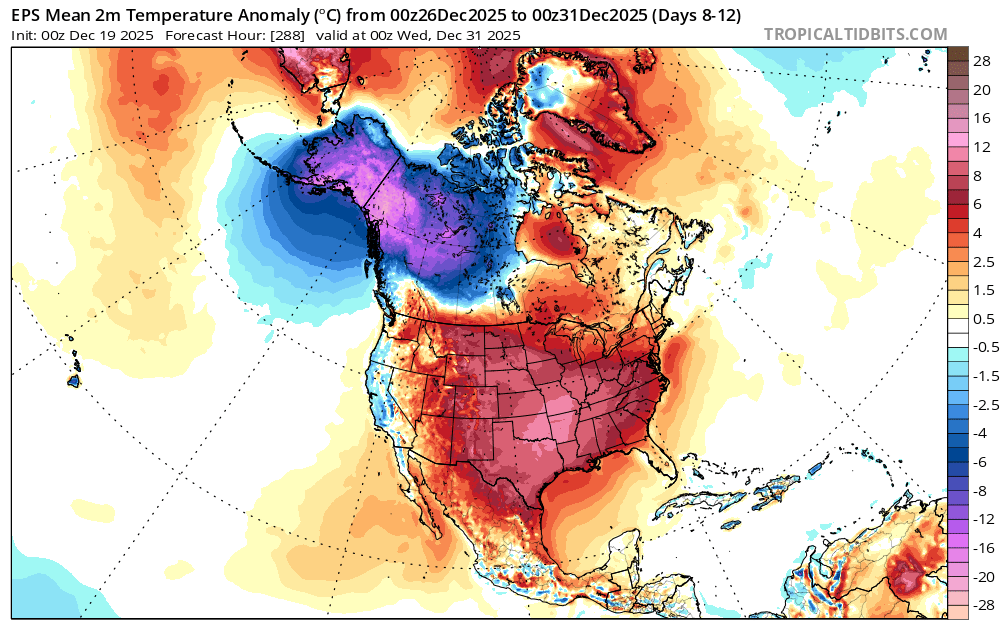
Just a brief note, the probability that the warmth will break through into the northern Mid-Atlantic and southern New England areas to close December has increased in recent days. The widespread warmth elsewhere in much of the CONUS and cold in NW Canada and Alaska remain intact. The forecast EPO+/PNA- seems sufficiently strong to offset the combination of a neutral AO and negative NAO even into parts of the Northeast now. Previously, the EPO was forecast to be mainly negative for the close of December. EPS from Wednesday 0z: EPS from Today 0z:

-
Winter cancelled/uncancelled banter 25/26
donsutherland1 replied to Rjay's topic in New York City Metro
Negativity about this winter seems to be rising. There seems to be a growing focus on the time snow does not fall. I choose to focus on the positive. I savor every snowfall, even the small ones. Sunday's snowfall provided some scenes that can be used for some of the custom Holiday e-cards I will share with colleagues at work. One example: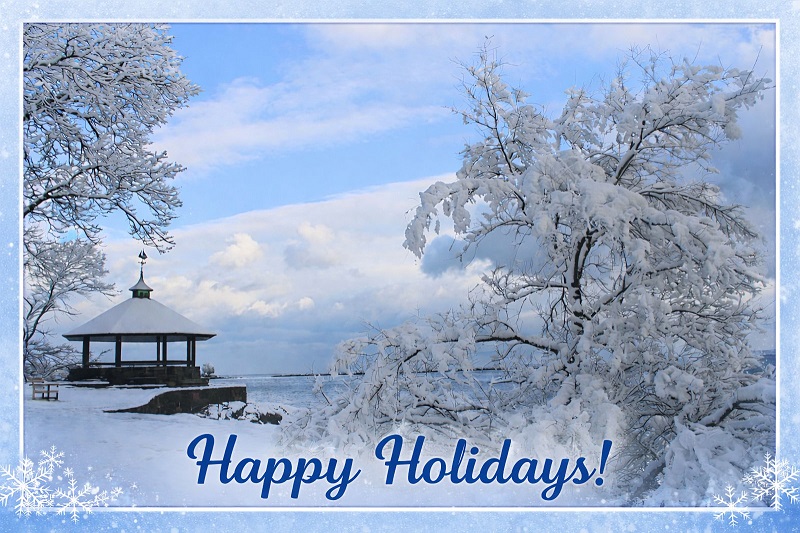
-
A soaking rain will develop tonight with a storm total 0.50"-1.50" rain likely across the region by the time the storm pulls away late tomorrow. The wind could also gust past 50 mph producing some coastal flooding and beach erosion. It will also be unseasonably mild tomorrow with highs reaching the lower and middle 50s. Behind the storm, the weekend will turn somewhat cooler. No exceptionally cold or warm weather appears likely for the first week of astronomical winter. The probability that December 2025 will have a maximum monthly temperature below 60° has continued to increase. The last time that happened was in 2019 when the monthly high was 58°. If 2025 has a monthly high below 60°, that would be only the fifth such occurrence since 2000 (2003, 2004, 2005, and 2019 are the cases since 2000). The ENSO Region 1+2 anomaly was -0.3°C and the Region 3.4 anomaly was -0.7°C for the week centered around December 10. For the past six weeks, the ENSO Region 1+2 anomaly has averaged -0.33°C and the ENSO Region 3.4 anomaly has averaged -0.67°C. La Niña conditions will likely continue through at least mid-winter. The SOI was -2.23 today. The preliminary Arctic Oscillation (AO) was +2.676 today. Based on sensitivity analysis applied to the latest guidance, there is an implied near 99% probability that New York City will have a cooler than normal December (1991-2020 normal). December will likely finish with a mean temperature near 33.9° (5.2° below normal). Supplemental Information: The projected mean would be 3.5° below the 1981-2010 normal monthly value.
-
2025-2026 ENSO
donsutherland1 replied to 40/70 Benchmark's topic in Weather Forecasting and Discussion
Thank you. I've never seen a link. -
I wasn't aware of that disparity. That's a pretty sizable change.
-
-
2025-2026 ENSO
donsutherland1 replied to 40/70 Benchmark's topic in Weather Forecasting and Discussion
Very interesting archived forecast. Is this information publicly-accessible and, if so, do you have a link? -
2025-2026 ENSO
donsutherland1 replied to 40/70 Benchmark's topic in Weather Forecasting and Discussion
For Baltimore: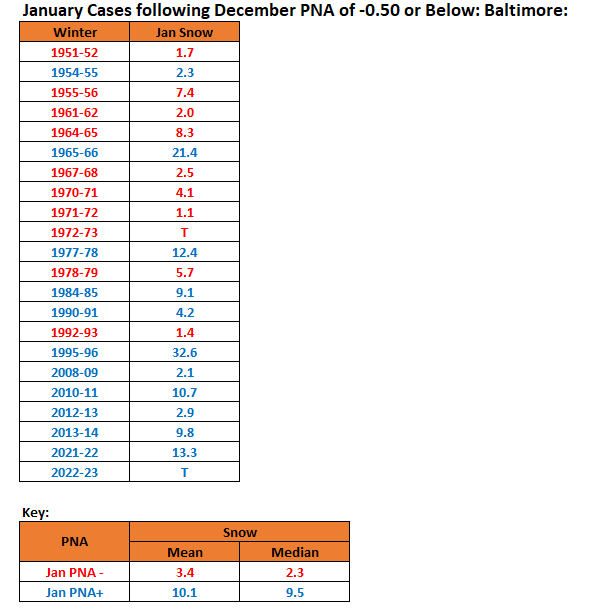
-
2025-2026 ENSO
donsutherland1 replied to 40/70 Benchmark's topic in Weather Forecasting and Discussion
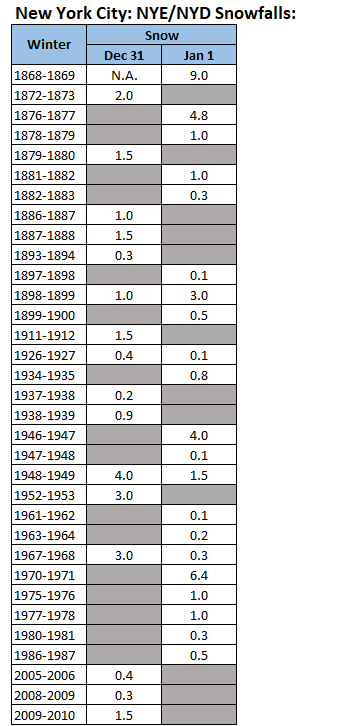
It will be interesting to see how things evolve. Since 1980, December PNA- cases have been followed by January PNA+ cases. Prior to 1980, December PNA- cases were generally followed by January PNA- cases. It is possible that the less stable PNA state is, at least in part, a result of Arctic amplification.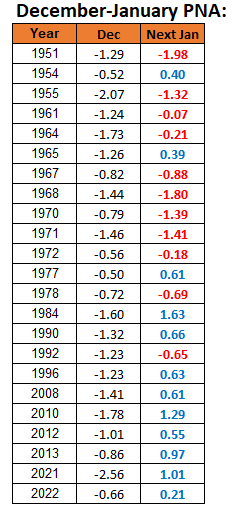
-
2025-2026 ENSO
donsutherland1 replied to 40/70 Benchmark's topic in Weather Forecasting and Discussion
Here's some data for NYC for January and March (1980-2025):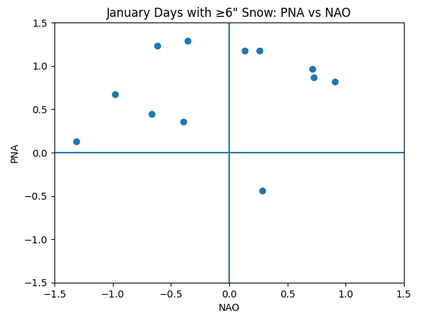
-
2025-2026 ENSO
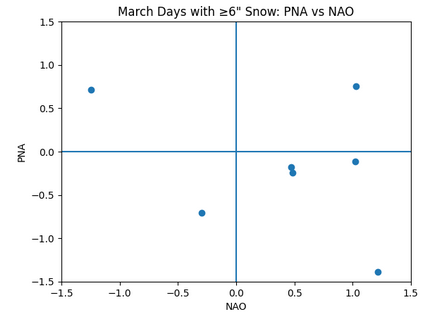
donsutherland1 replied to 40/70 Benchmark's topic in Weather Forecasting and Discussion
I suspect that when it comes to snowstorms in parts of the Southeast, more is involved than the pattern itself. Synoptic details are critical and outweigh the teleconnections. One sees a similar outcome in the spring in the Middle Atlantic region as wave lengths shorten and the state of the teleconnections becomes less important.