donsutherland1
-
Posts
23,782 -
Joined
Content Type
Profiles
Blogs
Forums
American Weather
Media Demo
Store
Gallery
Everything posted by donsutherland1
-
It is also good that the smoke isn’t as thick or the air quality as poor as it was during the summer.
-
Arctic Sea Ice Extent, Area, and Volume
donsutherland1 replied to ORH_wxman's topic in Climate Change
Arctic sea ice extent fell further to 4.613 million square kilometers (JAXA). The last year with a higher minimum was 2014 when the minimum extent was 4.884 million square kilometers. -
Arctic Sea Ice Extent, Area, and Volume
donsutherland1 replied to ORH_wxman's topic in Climate Change
I am not sure about the pure hurricane vs. post-tropical/transitioning hurricane, as the charts don't distinguish between them. Greenland picked up 10 gigatons of mass yesterday from the Larry-induced blizzard. That was, by far, a record for this early in the season. -
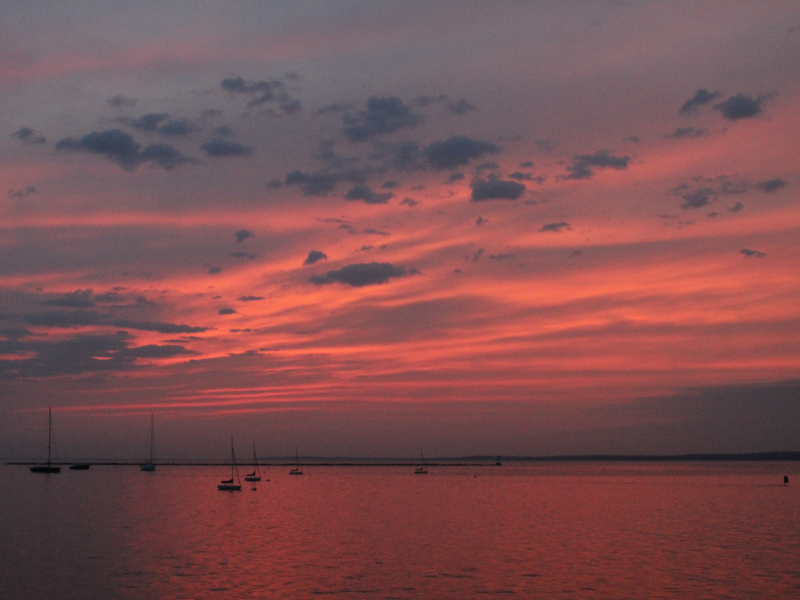
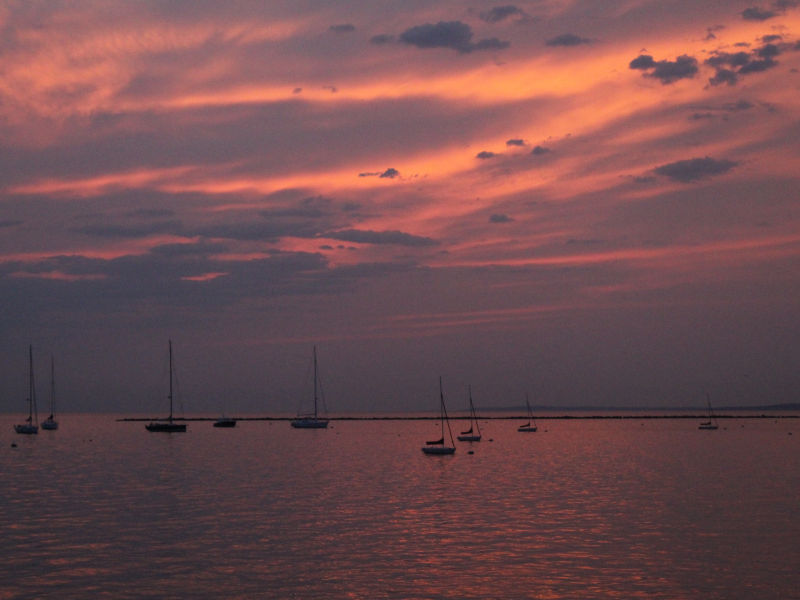
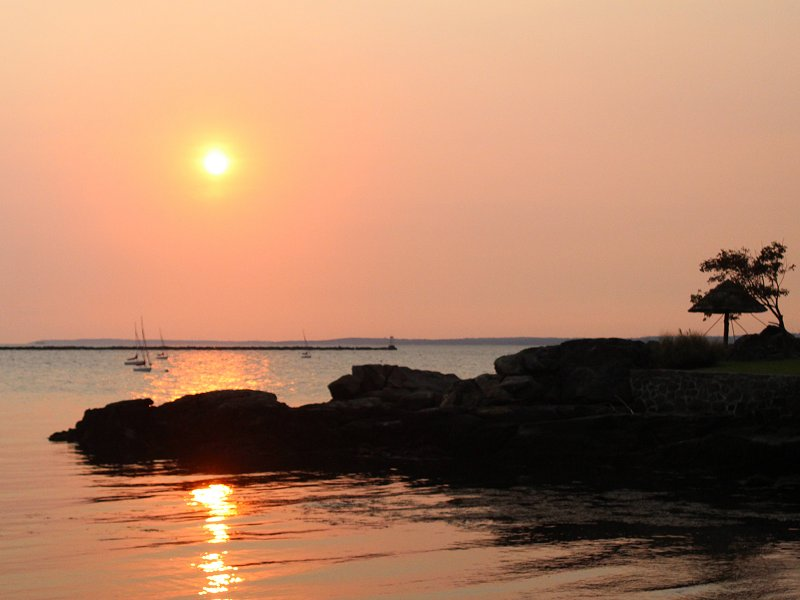
Just before sunrise today:
-
Morning thoughts… Today will be partly sunny, hazy, and warm. Some areas could see an evening thunderstorm. High temperatures will likely reach the lower and middle 80s in most of the region. Likely high temperatures around the region include: New York City (Central Park): 83° Newark: 87° Philadelphia: 87° Normals: New York City: 30-Year: 77.4°; 15-Year: 78.0° Newark: 30-Year: 78.8°; 15-Year: 79.5° Philadelphia: 30-Year: 80.0°; 15-Year: 80.5° Generally warmer than normal weather will continue through the week.
-
Arctic Sea Ice Extent, Area, and Volume
donsutherland1 replied to ORH_wxman's topic in Climate Change
Arctic sea ice extent was 4.648 million square kilometers on September 11 on JAXA. The minimum extent is likely near or imminent, but the Larry's impact is a wildcard. The 25th percentile (lowest) based on the August 31 value was 4.610 million square kilometers. -
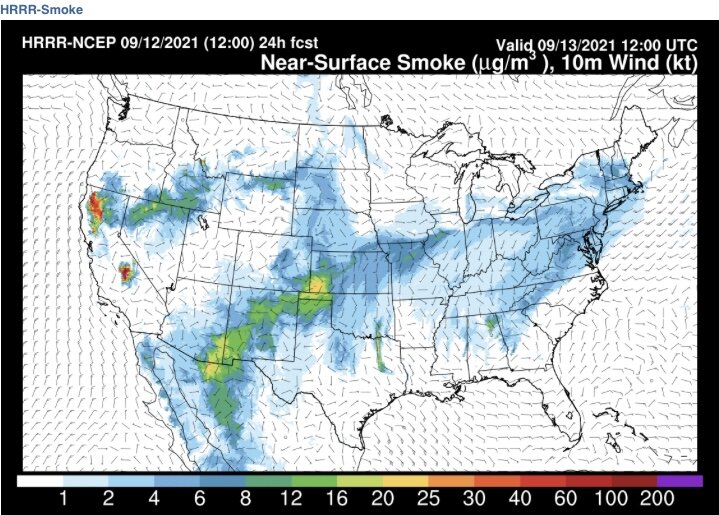
Tomorrow will feature hazy sunshine, as wildfire smoke from aloft becomes present near the surface. It will be unseasonably warm with temperatures rising into the middle and upper 80s in much of the region. A few hot spots could reach 90°. Some of the guidance is hinting at a potential tropical-enhanced rain event for late next week into next weekend. The potential needs to be watched. Before then, showers and thundershowers are possible tomorrow evening and night. The 12z HREF has a stripe of 0.25" precipitation that cuts across New York City, which implies a fairly good chance that some of the thunderstorms could impact New York City. Despite a cooler than normal first 7-10 days, September will likely feature near normal to somewhat warmer than normal temperatures in much of the region. The second half of the month could feature above to perhaps much above normal temperatures. As a result, 2021 is increasingly likely to become the 6th out of the last 7 years during which September has had a mean temperature of 70° or above in New York City. Prior to 2000, New York City saw such warmth on average once every five years. In short, September has become more an extension of summer than a gateway to autumn in the New York City area. Fall 2021 will likely be wetter to much wetter than normal in the northern Middle Atlantic region. Since 1869, there have been 9 August cases where New York City picked up 20.00" or more rainfall during the summer. Two thirds of those cases (and 4/5 of those with summer mean temperatures of 73.0° or above) had 17.00" or more fall precipitation in New York City. 2011 is probably the closest match in terms of precipitation and a nearly identical summer mean temperature. Mean fall precipitation for those 9 cases was 14.86". The median was 17.35". The 1991-2020 normal value is 12.27". The ENSO Region 1+2 anomaly was -0.2°C and the Region 3.4 anomaly was -0.3°C for the week centered around September 1. For the past six weeks, the ENSO Region 1+2 anomaly has averaged +0.22°C and the ENSO Region 3.4 anomaly has averaged -0.43°C. Neutral ENSO conditions will likely prevail through September. Afterward, La Niña conditions could begin to develop. The SOI was +24.90 today. The preliminary Arctic Oscillation (AO) figure was -0.093 today. On September 10 the MJO was in Phase 3 at an amplitude of 1.308 (RMM). The September 9-adjusted amplitude was 1.293 (RMM). Based on sensitivity analysis applied to the latest guidance, there is an implied 74% probability that New York City will have a warmer than normal September (1991-2020 normal). September will likely finish with a mean temperature near 70.8° (1.6° above normal).
-
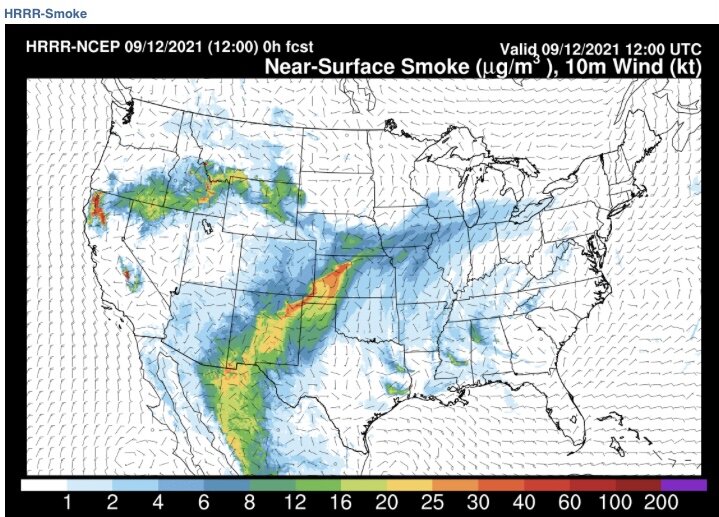
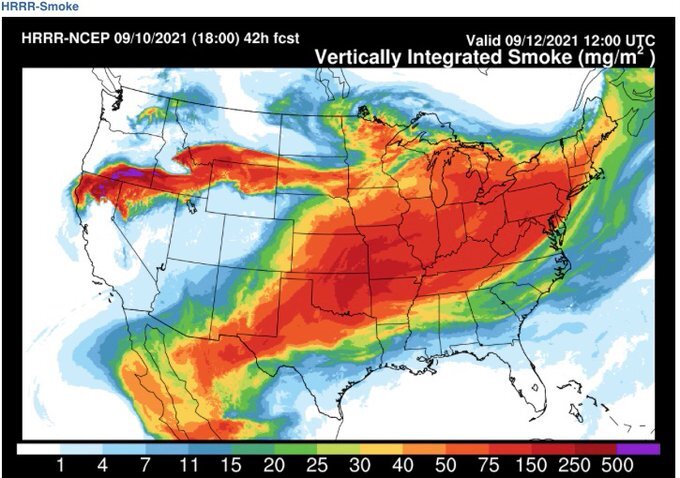
Great shot and great news. The smoke models bear out what you described.
-
Fairly thick smoke is aloft, but not yet present near the surface. That will change overnight.
-
Smoky morning.
-
Morning thoughts… Today will be partly sunny, hazy, and warm. High temperatures will likely reach the lower and middle 80s in most of the region. Likely high temperatures around the region include: New York City (Central Park): 82° Newark: 86° Philadelphia: 84° Normals: New York City: 30-Year: 77.7°; 15-Year: 78.2° Newark: 30-Year: 79.2°; 15-Year: 79.8° Philadelphia: 30-Year: 80.4°; 15-Year: 80.8° The week will likely be warmer to occasionally much warmer than normal.
-
At this time, I believe Central Park will likely reach 10” or more this month. Three reasons: 1. The rainfall from 9/12-30 during the 1971-2020 period would be sufficient (more than half the years in the he sample) 2. Super wet summers have been followed by wet falls. 3. The forecast pattern evolution and potential development of a PNA- near or after mid-month. A PNA- has been present for a disproportionate share of daily rainfall amounts of 1” or more during September 1991-2020. The PNA was negative during Ida’s historically intense rainfall in NYC and EWR.
-
You are correct. I have grave reservations about concepts that would overturn entire ecosystems. I can’t think of a legitimate, much less ethical basis for doing so.
-
Temperatures rose into the middle and upper 70s with a few lower 80s today. Out West, more record heat prevailed. Denver saw the temperature reach 97°, which easily surpassed the daily record of 93° from 2018. Today was the 3rd consecutive 95° or above temperature in Denver, the latest such stretch on record. The prior record was set during September 5-7, 2013. 10/14 (71%) of Denver's 97° or above September temperatures have occurred since 2010. Records go back to 1872. Cheyenne had a high temperature of 91°. The previous daily record was 88°, which was set in 1954 and tied in 2016. September 9-11, 2021 is Cheyenne's latest-season heatwave on record. The prior latest heatwave occurred during September 6-8, 1959. Tomorrow will be unseasonably warm with temperatures rising into the middle and upper 80s as far north as New York City. Thick wildfire smoke could again push into the region overnight. Some of the guidance--the GFS in particular--is hinting at a potential tropical-enhanced rain event for late next week into next weekend. The GFS's run-to-run consistency suggests that the potential be watched closely. Despite a cooler than normal first 7-10 days, September will likely feature near normal to somewhat warmer than normal temperatures in much of the region. The second half of the month could feature above to perhaps much above normal temperatures. As a result, 2021 is increasingly likely to become the 6th out of the last 7 years during which September has had a mean temperature of 70° or above in New York City. Prior to 2000, New York City saw such warmth on average once every five years. In short, September has become more an extension of summer than a gateway to autumn in the New York City area. Fall 2021 will likely be wetter to much wetter than normal in the northern Middle Atlantic region. Since 1869, there have been 9 August cases where New York City picked up 20.00" or more rainfall during the summer. Two thirds of those cases (and 4/5 of those with summer mean temperatures of 73.0° or above) had 17.00" or more fall precipitation in New York City. 2011 is probably the closest match in terms of precipitation and a nearly identical summer mean temperature. Mean fall precipitation for those 9 cases was 14.86". The median was 17.35". The 1991-2020 normal value is 12.27". The ENSO Region 1+2 anomaly was -0.2°C and the Region 3.4 anomaly was -0.3°C for the week centered around September 1. For the past six weeks, the ENSO Region 1+2 anomaly has averaged +0.22°C and the ENSO Region 3.4 anomaly has averaged -0.43°C. Neutral ENSO conditions will likely prevail through September. Afterward, La Niña conditions could begin to develop. The SOI was +4.04 today. The preliminary Arctic Oscillation (AO) figure was -0.834 today. On September 9 the MJO was in Phase 3 at an amplitude of 1.303 (RMM). The September 8-adjusted amplitude was 1.279 (RMM). Based on sensitivity analysis applied to the latest guidance, there is an implied 74% probability that New York City will have a warmer than normal September (1991-2020 normal). September will likely finish with a mean temperature near 70.7° (1.5° above normal).
-
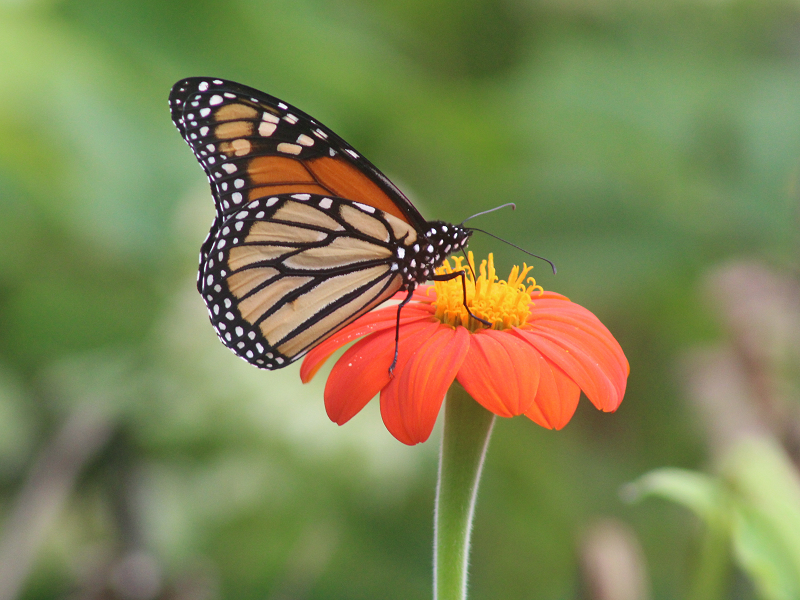
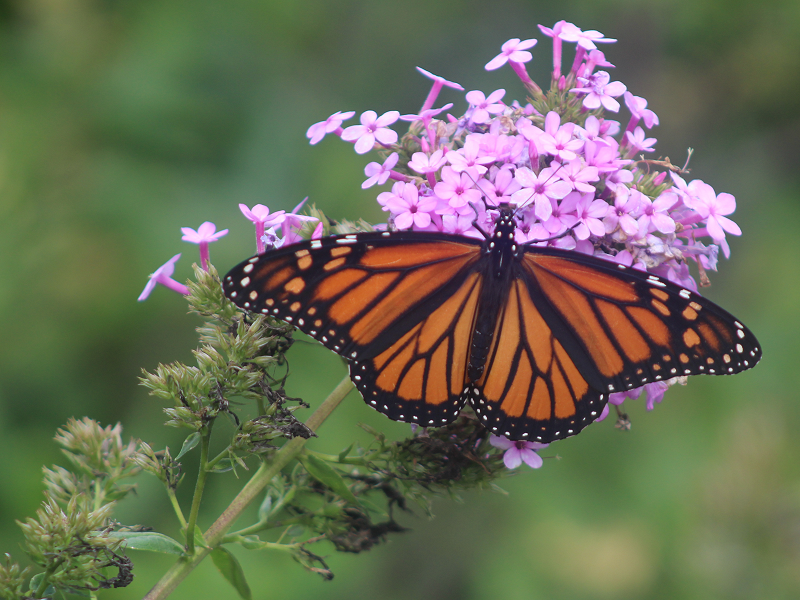
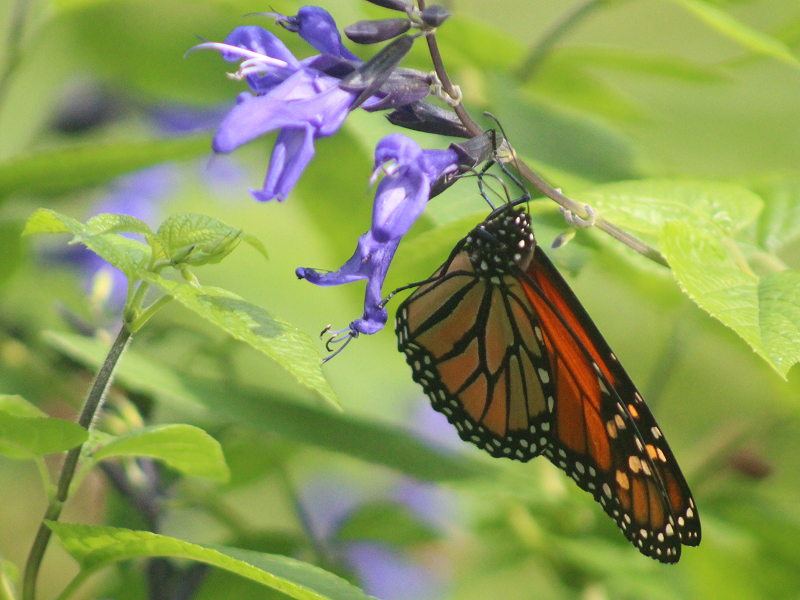
Under partly to mostly sunny skies, the temperature rose into the middle and upper 70s. There is now an abundance of Monarchs at the New York Botanical Garden:
-
Yes, the tropical rainforests are more significant, but a precedent based on expediency would only give further cover for Brazil to continue to develop the Amazon rainforest area. Better building codes, reduced development in highest risk areas (current and modeled) and sustained decarbonization are needed.
-
Morning thoughts… Today will be mostly sunny and warm. High temperatures will likely reach the upper 70s and lower 80s in most of the region. Likely high temperatures around the region include: New York City (Central Park): 78° Newark: 82° Philadelphia: 80° Normals: New York City: 30-Year: 78.0°; 15-Year: 78.5° Newark: 30-Year: 79.5°; 15-Year: 80.0° Philadelphia: 30-Year: 80.7°; 15-Year: 81.0° Tomorrow and Monday will be very warm days. At Denver, the temperature could reach 95° or above for the third consecutive day. That would surpass the daily record of 93° from 2018. It would also set the record for the latest stretch of three consecutive days at or above 95°, which occurred on September 5-7, 2013.
-
The problem with that approach is the precedent it would set, in addition to its reducing a carbon sink. The U.S. retains high global visibility. If it moves dramatically to reduce some of its major forests, others will take license to do the same. One could witness an acceleration of the destruction of the Amazon, Burmese tropical rainforest, Congo rainforest. The rationale would be framed in self-interest. With reduced carbon uptake, emissions would then need to decline even more rapidly, as a higher share would wind up in the atmosphere. The end result would be more weather extremes and such extremes are non-linear in nature. Potential game-changer tipping points would come up much faster. In sum, there is no “free lunch.” The long-term consequences would vastly outweigh short-term localized benefits.
-
No. Reducing a natural carbon sink would be very short-sighted. If others imitated such a move, the world would be in a much worse position. Decarbonization is what is necessary. Shortcuts and gimmicks won’t address climate change or its increasingly extreme impacts.
-
Under brilliant sunshine, the temperature rose into the lower and middle 70s across the region. Another similar day is in store tomorrow before warmer air returns. Out West, exceptional heat again toppled records. At Denver, the temperature rose to 99°, which smashed the old record of 93°. The old record was set in 1931 and tied in 1974, 1994, 1998, and 2018. Denver also saw the relative humidity fall to a daily record low 6%. At Cheyenne, the temperature peaked at 96°. That smashed the previous daily record of 88°, which was set in 2012. It also surpassed the September mark of 95°, which was set on September 1, 1995 and tied on September 2, 2019. The previous latest 96° or above temperature was recorded on August 10, 1969. Sunday could be unseasonably warm with temperatures rising into the upper 80s as far north as New York City. Thick wildfire smoke could again push into the region beginning late Saturday. Despite a cooler than normal first 7-10 days, September will likely feature near normal to somewhat warmer than normal temperatures in much of the region. The second half of the month could feature above to perhaps much above normal temperatures. As a result, 2021 is increasingly likely to become the 6th out of the last 7 years during which September has had a mean temperature of 70° or above in New York City. Prior to 2000, New York City saw such warmth on average once every five years. In short, September has become more an extension of summer than a gateway to autumn in the New York City area. Fall 2021 will likely be wetter to much wetter than normal in the northern Middle Atlantic region. Since 1869, there have been 9 August cases where New York City picked up 20.00" or more rainfall during the summer. Two thirds of those cases (and 4/5 of those with summer mean temperatures of 73.0° or above) had 17.00" or more fall precipitation in New York City. 2011 is probably the closest match in terms of precipitation and a nearly identical summer mean temperature. Mean fall precipitation for those 9 cases was 14.86". The median was 17.35". The 1991-2020 normal value is 12.27". The ENSO Region 1+2 anomaly was -0.2°C and the Region 3.4 anomaly was -0.3°C for the week centered around September 1. For the past six weeks, the ENSO Region 1+2 anomaly has averaged +0.22°C and the ENSO Region 3.4 anomaly has averaged -0.43°C. Neutral ENSO conditions will likely prevail through September. Afterward, La Niña conditions could begin to develop. The SOI was -1.25 today. The preliminary Arctic Oscillation (AO) figure was -0.834 today. On September 8 the MJO was in Phase 3 at an amplitude of 1.278 (RMM). The September 7-adjusted amplitude was 1.306 (RMM). Based on sensitivity analysis applied to the latest guidance, there is an implied 69% probability that New York City will have a warmer than normal September (1991-2020 normal). September will likely finish with a mean temperature near 70.4° (1.2° above normal).
-
Parts of the West remained very dry.
-
FYI, the smoke will be returning.
-
1943 on a regular basis, but physical records go back as far as 1889, with a few missing months. Daily records go back to 1869.
-
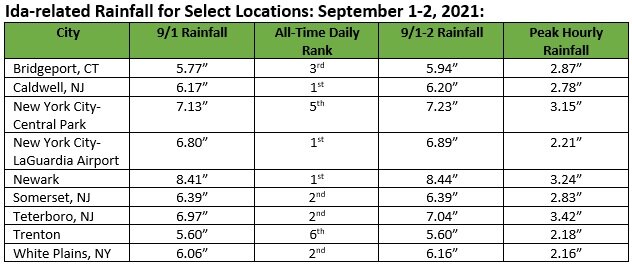
Some additional rainfall data: