donsutherland1
-
Posts
23,782 -
Joined
Content Type
Profiles
Blogs
Forums
American Weather
Media Demo
Store
Gallery
Everything posted by donsutherland1
-
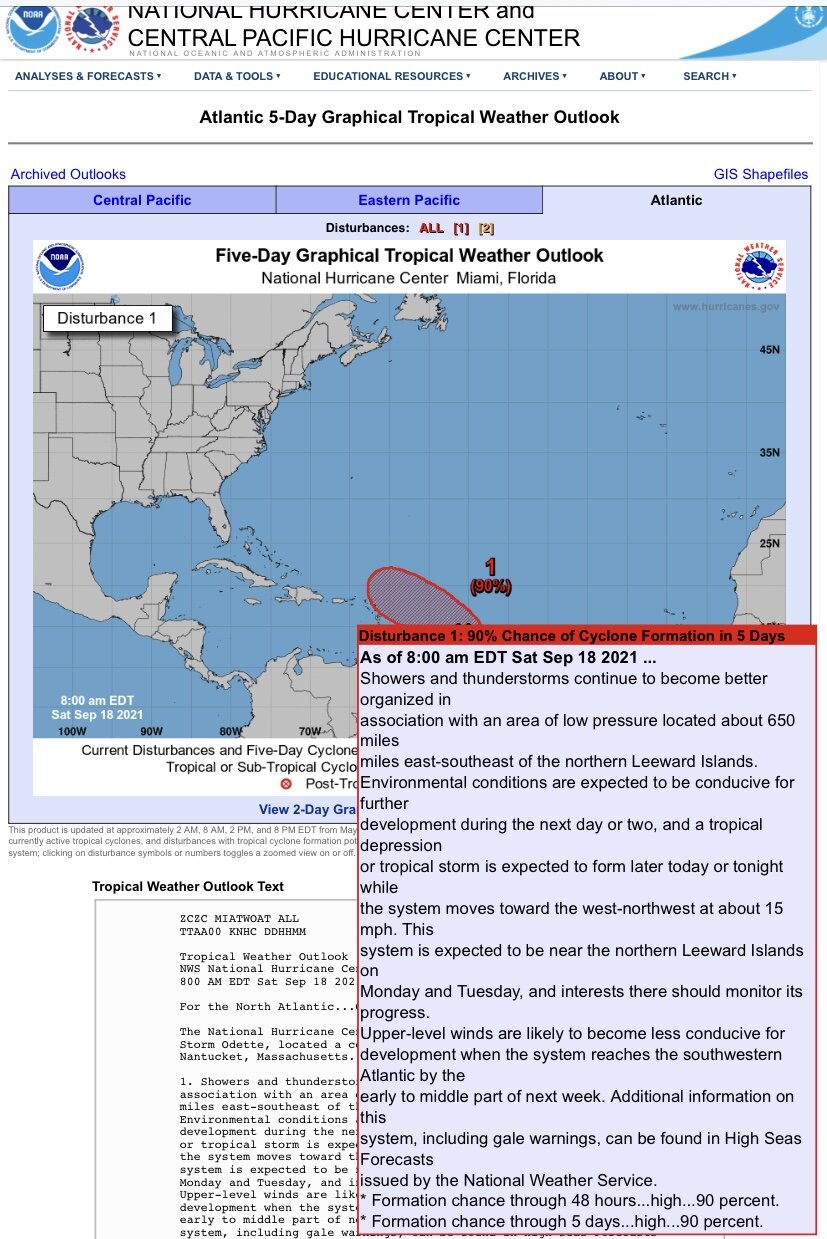
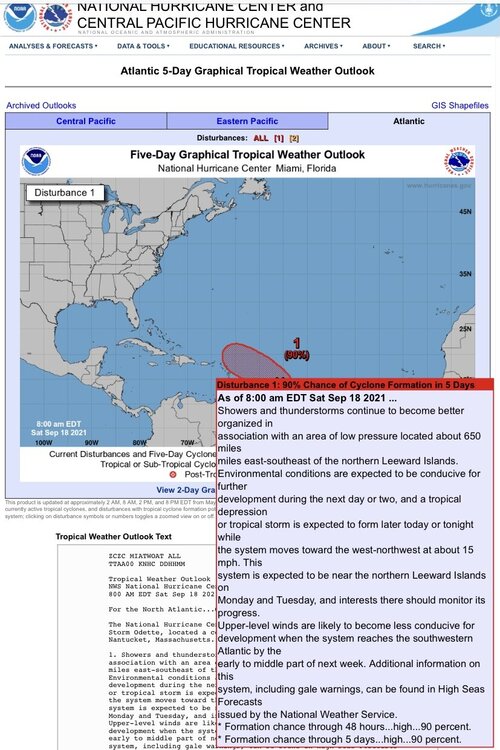
While true, the odds would be greater than climatology. Even indirect effects could produce flooding. Of course, what will likely become Sam could recurve if the pattern is still evolving. But there’s always the possibility of additional storms, as it has been a very active season.
-
This is the kind of situation that is possible under some of the fairly ominous monthly 500 mb forecasts for October (and weekly forecasts going into October).
-
Morning thoughts… Today will be partly sunny and pleasant. High temperatures will likely reach the middle and upper 70s in most of the region. Likely high temperatures around the region include: New York City (Central Park): 74° Newark: 77° Philadelphia: 79° Normals: New York City: 30-Year: 74.3°; 15-Year: 75.4° Newark: 30-Year: 75.9°; 15-Year: 77.0° Philadelphia: 30-Year: 77.1°; 15-Year: 78.1° A moderate to perhaps significant rainfall is possible during the middle or latter part of the week. A general 0.50”-1.50” rainfall with locally higher amounts appears likely.
-
Tomorrow will be another partly sunny and pleasant day. Temperatures will again rise well into the 70s in much of the region. The potential exists for a moderate to perhaps significant rainfall during the middle or latter part of the week. A widespread 0.50"-1.50" rainfall with locally higher amounts is possible. The timing still remains somewhat uncertain. The MJO has recently been locked in Phase 3 at a high amplitude, frequently in excess of 1.500. Only 2006 and 2009 saw the MJO in Phase 3 at an amplitude of 1.500 or above for 2 or more days during September 10-20. Both years saw September end with a cold shot that continued into the first days of October. Both days saw Central Park's temperature fall to 49° on September 30. October wound up wetter than normal with 7.07" rainfall in 2006 and 5.58" of rainfall in 2009. Normal rainfall (1991-2020) is 4.38". Despite the guidance of a few days ago and a likely cold shot to end the month, 2021 is still on course to become the 6th out of the last 7 years during which September has had a mean temperature of 70° or above in New York City. Considering that the close of September is still more than 10 days out, the guidance can still reverse. Prior to 2000, New York City saw such warmth on average once every five years. In short, September has become more an extension of summer than a gateway to autumn in the New York City area. Fall 2021 will likely be wetter to much wetter than normal in the northern Middle Atlantic region. Since 1869, there have been 9 August cases where New York City picked up 20.00" or more rainfall during the summer. Two thirds of those cases (and 4/5 of those with summer mean temperatures of 73.0° or above) had 17.00" or more fall precipitation in New York City. 2011 is probably the closest match in terms of precipitation and a nearly identical summer mean temperature. Mean fall precipitation for those 9 cases was 14.86". The median was 17.35". The 1991-2020 normal value is 12.27". The ENSO Region 1+2 anomaly was +0.2°C and the Region 3.4 anomaly was -0.4°C for the week centered around September 15. For the past six weeks, the ENSO Region 1+2 anomaly has averaged +0.03°C and the ENSO Region 3.4 anomaly has averaged -0.45°C. Neutral ENSO conditions will likely prevail through September. Afterward, La Niña conditions could begin to develop. The SOI was +8.14 today. The preliminary Arctic Oscillation (AO) figure was -0.118 today. On September 18 the MJO was in Phase 3 at an amplitude of 1.466 (RMM). The September 17-adjusted amplitude was 1.735 (RMM). Based on sensitivity analysis applied to the latest guidance, there is an implied 73% probability that New York City will have a warmer than normal September (1991-2020 normal). September will likely finish with a mean temperature near 70.3° (1.1° above normal).
-
Occasional Thoughts on Climate Change
donsutherland1 replied to donsutherland1's topic in Climate Change
I agree. They don’t typically link fossil fuels to climate change. They should do better. -
Occasional Thoughts on Climate Change
donsutherland1 replied to donsutherland1's topic in Climate Change
Not initially. But since the lease sale was announced, the Administration has appealed a court ruling that prevents it from suspending such sales. Perhaps the criticism that followed that announcement played some role. -
Occasional Thoughts on Climate Change
donsutherland1 replied to donsutherland1's topic in Climate Change
Today, some positive news from Washington: Today, President Biden is launching a coordinated, interagency effort to respond to extreme heat that threatens the lives and livelihoods of Americans, especially workers, children, and seniors. While climate-related disasters like hurricanes, wildfires, and floods produce dramatic images of devastation, extreme heat often takes place out of sight and out of the news. But heat is the nation’s leading weather-related killer. https://www.whitehouse.gov/briefing-room/statements-releases/2021/09/20/fact-sheet-biden-administration-mobilizes-to-protect-workers-and-communities-from-extreme-heat/ -
Morning thoughts… Today will be partly sunny and pleasant. High temperatures will likely reach the middle and upper 70s in most of the region. Likely high temperatures around the region include: New York City (Central Park): 75° Newark: 79° Philadelphia: 79° Normals: New York City: 30-Year: 74.7°; 15-Year: 75.7° Newark: 30-Year: 76.3°; 15-Year: 77.4° Philadelphia: 30-Year: 77.5°; 15-Year: 78.4° A moderate to perhaps significant rainfall is possible during the middle or latter part of the week. A general 0.50”-1.50” rainfall with locally higher amounts appears likely.
-
Tomorrow will be another partly to mostly sunny day. Temperatures will likely reach the middle and upper 70s across the region. The potential exists for a moderate to perhaps significant rainfall during the middle or latter part of the week. A widespread 0.50"-1.50" rainfall with locally higher amounts is possible. The timing remains somewhat uncertain. Despite the guidance of a few days ago, 2021 is still on course to become the 6th out of the last 7 years during which September has had a mean temperature of 70° or above in New York City. Considering that the close of September is still more than 10 days out, the guidance can still reverse. Prior to 2000, New York City saw such warmth on average once every five years. In short, September has become more an extension of summer than a gateway to autumn in the New York City area. Fall 2021 will likely be wetter to much wetter than normal in the northern Middle Atlantic region. Since 1869, there have been 9 August cases where New York City picked up 20.00" or more rainfall during the summer. Two thirds of those cases (and 4/5 of those with summer mean temperatures of 73.0° or above) had 17.00" or more fall precipitation in New York City. 2011 is probably the closest match in terms of precipitation and a nearly identical summer mean temperature. Mean fall precipitation for those 9 cases was 14.86". The median was 17.35". The 1991-2020 normal value is 12.27". The ENSO Region 1+2 anomaly was -0.2°C and the Region 3.4 anomaly was -0.3°C for the week centered around September 8. For the past six weeks, the ENSO Region 1+2 anomaly has averaged +0.22°C and the ENSO Region 3.4 anomaly has averaged -0.43°C. Neutral ENSO conditions will likely prevail through September. Afterward, La Niña conditions could begin to develop. The SOI was +12.42 today. The preliminary Arctic Oscillation (AO) figure was +0.354 today. On September 17 the MJO was in Phase 3 at an amplitude of 1.737 (RMM). The September 16-adjusted amplitude was 1.825 (RMM). Based on sensitivity analysis applied to the latest guidance, there is an implied 72% probability that New York City will have a warmer than normal September (1991-2020 normal). September will likely finish with a mean temperature near 70.3° (1.1° above normal).
-
Occasional Thoughts on Climate Change
donsutherland1 replied to donsutherland1's topic in Climate Change
The problem is that those producing such charts assume reasonable information literacy. An interactive explainer about how to read such charts and the consequences for each path would add considerable value. -
Occasional Thoughts on Climate Change
donsutherland1 replied to donsutherland1's topic in Climate Change
There’s some coverage, but not enough. <I>The Washington Post</i> seems to do the best job in linking extreme events to climate change and climate change to the burning of fossil fuels. That last element—who/what is responsible—is often missing in stories that cite climate change. Hence, the kind of public pressure required to begin to roll back fossil fuel production and hold fossil fuel producers liable for climate damages is lacking. -
Occasional Thoughts on Climate Change
donsutherland1 replied to donsutherland1's topic in Climate Change
I don’t know. A not insignificant slice of the population is indifferent to the terrible toll inflicted by COVID-19. There likely is a level at which the threshold would be reached. -
Morning thoughts… Today will be partly sunny and pleasant. High temperatures will likely reach the middle and upper 70s with a few lower 80s in most of the region. Likely high temperatures around the region include: New York City (Central Park): 77° Newark: 81° Philadelphia: 81° Normals: New York City: 30-Year: 75.1°; 15-Year: 76.1° Newark: 30-Year: 76.6°; 15-Year: 77.7° Philadelphia: 30-Year: 77.9°; 15-Year: 78.7° A moderate to perhaps significant rainfall is possible during the middle or latter part of the week.
-
Occasional Thoughts on Climate Change
donsutherland1 replied to donsutherland1's topic in Climate Change
One isn’t dealing with trivial amounts of oil and gas, and therefore future greenhouse gas emissions. From the BOEM: The Bureau of Ocean Energy Management (BOEM) proposes to offer approximately 78.2 million acres for a region-wide Gulf of Mexico lease sale scheduled for March 2021. Lease Sale 257, scheduled to be livestreamed from New Orleans, will be the eighth offshore sale under the 2017-2022 Outer Continental Shelf Oil and Gas Leasing Program. The sale will include approximately 14,594 unleased blocks – all of the available unleased areas in federal waters of the Gulf of Mexico... The Gulf of Mexico Outer Continental Shelf (OCS), covering about 160 million acres, is estimated to contain about 48 billion barrels of undiscovered technically recoverable oil and 141 trillion cubic feet of undiscovered technically recoverable gas. https://www.boem.gov/boem-proposes-first-gulf-oil-and-gas-lease-sale-2021 Nearly 49% of an area with enormous fossil fuel reserves is very substantial. This is why climate scientists, environmentalists, and members of the public who want to address climate change are objecting. Geopolitically, a country that is expanding its own fossil fuel footprint lacks the standing to tell others, including India and China, to do more, even as more is urgently needed if the 1.5C or 2.0C goals are to be met. All in all, it provides a damaging example. -
Occasional Thoughts on Climate Change
donsutherland1 replied to donsutherland1's topic in Climate Change
The reason why expansion of fossil fuel infrastructure despite promises of addressing climate change needs to be called out: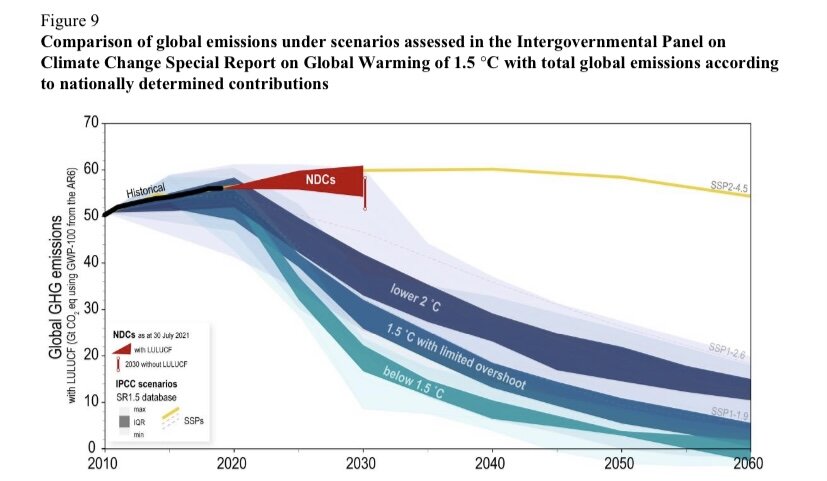
-
The last weekend of astronomical summer began with temperatures reaching the middle and upper 80s across the New York City region. Tomorrow will be fair and somewhat cooler. The potential exists for a moderate to perhaps significant rainfall during the middle or latter part of next week. Readings will mainly be in the 70s during the day and upper 50s and lower 60s at night. The recent guidance has taken a dramatic turn away from a warm close to September. Instead, early indications of a trough and cooler than normal readings have grown in magnitude. If the guidance holds up, it is close to a toss-up whether 2021 will become the 6th out of the last 7 years during which September has had a mean temperature of 70° or above in New York City. Considering that the close of September is still more than 10 days out, the guidance can still reverse. Prior to 2000, New York City saw such warmth on average once every five years. In short, September has become more an extension of summer than a gateway to autumn in the New York City area. Fall 2021 will likely be wetter to much wetter than normal in the northern Middle Atlantic region. Since 1869, there have been 9 August cases where New York City picked up 20.00" or more rainfall during the summer. Two thirds of those cases (and 4/5 of those with summer mean temperatures of 73.0° or above) had 17.00" or more fall precipitation in New York City. 2011 is probably the closest match in terms of precipitation and a nearly identical summer mean temperature. Mean fall precipitation for those 9 cases was 14.86". The median was 17.35". The 1991-2020 normal value is 12.27". The ENSO Region 1+2 anomaly was -0.2°C and the Region 3.4 anomaly was -0.3°C for the week centered around September 8. For the past six weeks, the ENSO Region 1+2 anomaly has averaged +0.22°C and the ENSO Region 3.4 anomaly has averaged -0.43°C. Neutral ENSO conditions will likely prevail through September. Afterward, La Niña conditions could begin to develop. The SOI was +14.20 today. The preliminary Arctic Oscillation (AO) figure was +0.354 today. On September 16 the MJO was in Phase 3 at an amplitude of 1.826 (RMM). The September 15-adjusted amplitude was 1.851 (RMM). Based on sensitivity analysis applied to the latest guidance, there is an implied 64% probability that New York City will have a warmer than normal September (1991-2020 normal). September will likely finish with a mean temperature near 70.2° (1.0° above normal).
-
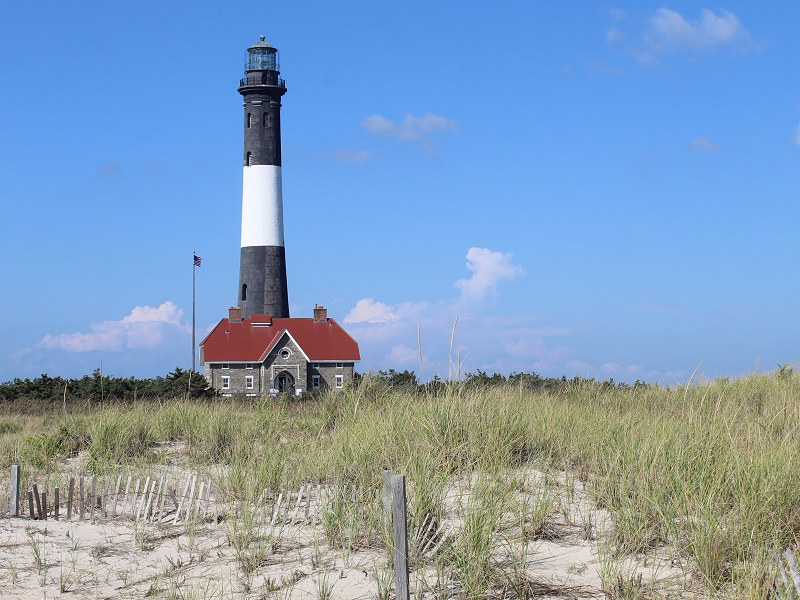
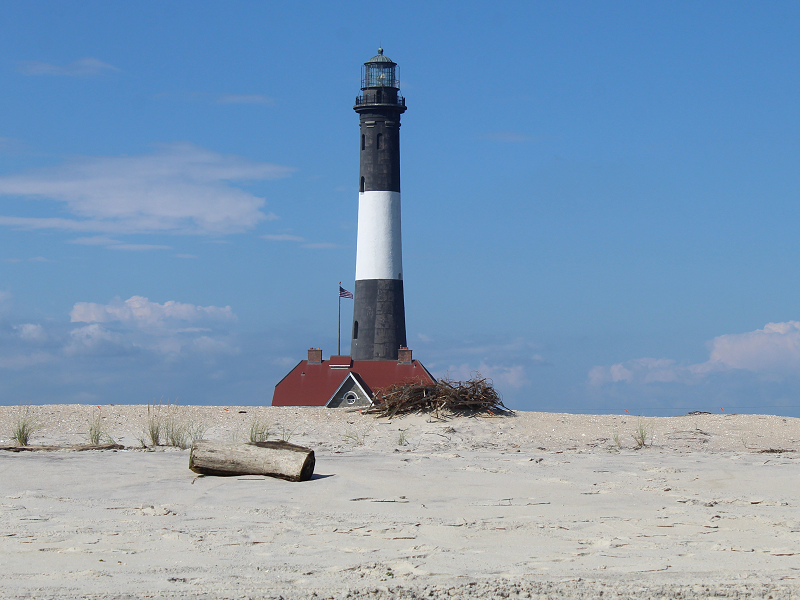
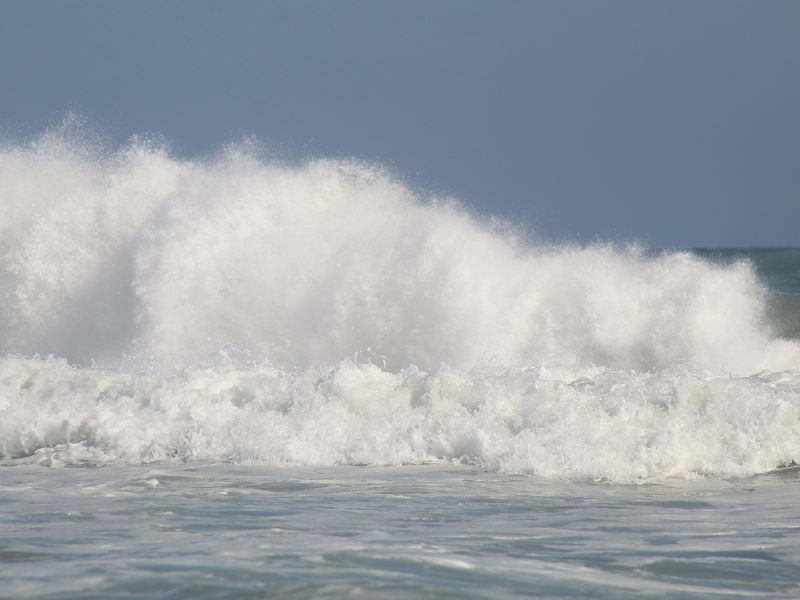
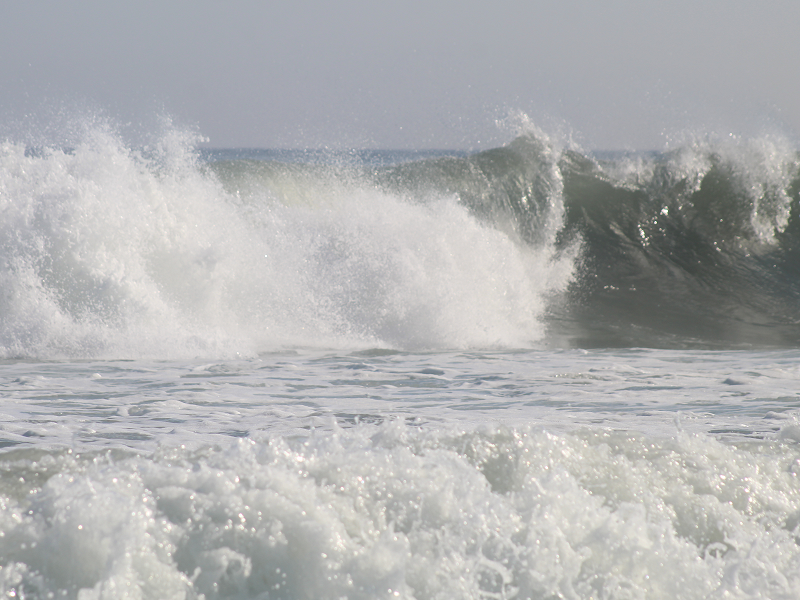
Bright sunshine was present at Robert Moses State Park. The waves were higher than usual on account of Odette, which is far offshore.
-
Occasional Thoughts on Climate Change
donsutherland1 replied to donsutherland1's topic in Climate Change
My guess is that with some exceptions, human society has an almost iron-clad commitment to the status quo, even one that is unsustainable, because it has fear of change that exceeds fear of the consequences of inaction. Thus, there is a bias for inaction and rhetoric outruns substantive action. Denial of the reality that a status quo can’t be preserved is explicit (denial of climate change) or implicit (belief that one can finance and approve expanded fossil fuel production and magically make progress toward net zero emissions). Far more effort and investment are devoted to saving the status quo than toward an early transition during which time is sufficient to avert significant disruption or avoid the much higher cost from allowing things to worsen. The leadership and action undertaken to address the ozone hole and acid rain are exceptions to the rule. My concern is that the disasters of this summer will be largely forgotten in the policy and business world. In terms of concrete policy and energy production, things will go on little changed. The gap between rhetoric and action will continue to widen. That gap will only be resolved when a crisis of a much larger magnitude imposes a new order. Then, of course, the shift will be more disruptive and the economic and human costs much higher than would otherwise have been the case. There are plausible candidates for such crises, but they still lie in the future. One would entail a series of years where widespread crop failures lead to an appreciable shortage of food. Another would entail a massive marine heatwave that results in an appreciable decline in the population of sea life, including seafood. Still another would entail reaching an irreversible tipping point that dooms the Greenland ice sheet and a significant part of the Antarctic ice sheet, and subsequently, much of the world’s coastlines and coastal cities to the rising sea. I don’t currently think humanity will get that far, but am concerned that humanity will approach such a situation due to insufficient policy measures. Unfortunately, because humans aren’t prescient, it will be uncertain precisely where the boundary that separates a severe crisis from a truly catastrophic one lies. With continued delay, there will be danger that humanity could wait too long to avert the latter. -
Perhaps the last chance? But not my preference.
-
Morning thoughts… Today will be partly sunny and warm. High temperatures will likely reach the lower and middle 80s in most of the region. Likely high temperatures around the region include: New York City (Central Park): 82° Newark: 87° Philadelphia: 86° Normals: New York City: 30-Year: 75.5°; 15-Year: 76.4° Newark: 30-Year: 77.0°; 15-Year: 78.0° Philadelphia: 30-Year: 78.2°; 15-Year: 79.1° Tomorrow will be partly sunny and cooler.
-
Occasional Thoughts on Climate Change
donsutherland1 replied to donsutherland1's topic in Climate Change
My concern is that she is merely carrying out the Administration’s policy. That policy is inconsistent with its rhetoric and even more inconsistent with what’s needed to begin to address climate change. -
Occasional Thoughts on Climate Change
donsutherland1 replied to donsutherland1's topic in Climate Change
It’s from the Bureau of Ocean Energy Management (part of the Department of Interior). -
Larry almost certainly enhanced the blocking. But at this time of year, long-range modeling can change dramatically.
-
Occasional Thoughts on Climate Change
donsutherland1 replied to donsutherland1's topic in Climate Change
A new document concerning oil and gas lease sale 257 is just the latest evidence that the tyranny of the status quo in favor of fossil fuels still prevails in Washington, D.C.. Page 7 declares that the recent IPCC report “does not present sufficient cause” to block the sale of new oil and gas leases. The IPCC had declared, “It is unequivocal that human influence has warmed the atmosphere, ocean and land. Widespread and rapid changes in the atmosphere, ocean, cryosphere and biosphere have occurred.” Unfortunately, despite all its bold talk, “unequivocal” evidence is insufficient cause for this Administration to suspend the expansion of the nation’s fossil fuel footprint. Something close to business-as-usual is its energy policy business. And, in the best tradition of punting concrete action into the future while seeking credit for that punt, the document suggests, that the report and “additional analysis of climate change may be a significant consideration” in the future. No credit is merited. Instead, the Administration will have steepened the slope for achieving net zero emissions by 2050. Given this pathetic embrace of fossil fuel expansion, it is becoming increasingly likely that the United States will come to the COP26 conference without something big and concrete like a clean electricity standard. Instead it may well make promises that are short of concrete policy outcomes. There will be no enforcement mechanisms. And the actual actions will be left to the future. Again. Other countries will take note. The U.S. Republican Party and pro-fossil fuel Democrats such as Joe Mancin will be emboldened. U.S. policy action will fizzle. Another opportunity to finally begin to tackle climate change will be squandered. Another generation of political leaders will bequeath the growing mess of climate change to the nation’s youth—youth who made the current Administration’s victory possible in the first place. Being marginally better than the historically bad Trump Administration is of little consolation. Much more needs to be done over an increasingly short and shortening timeframe. Will the President intervene to overturn this decision to increase the nation’s greenhouse gas emissions? In other words, will he provide leadership or leadership failure. Well, for an Administration that asked OPEC to increase oil production just after the IPCC released its report, the odds seem against such action. I hope my worries are misplaced. Whether the U.S. announces concrete, binding policies or merely offers promises at COP26 will be revealing. -
Tomorrow will be partly sunny and warmer. Readings will likely reach the lower and middle 80s across much of the region. However the warmth will likely be fairly short-lived. Overnight, the guidance has taken a dramatic turn away from a warm close to September. Instead, early indications of a trough and cooler than normal readings have grown in magnitude. If the guidance holds up, it is close to a toss-up whether 2021 will become the 6th out of the last 7 years during which September has had a mean temperature of 70° or above in New York City. Considering that the close of September is still more than 10 days out, the guidance can still reverse. Prior to 2000, New York City saw such warmth on average once every five years. In short, September has become more an extension of summer than a gateway to autumn in the New York City area. Fall 2021 will likely be wetter to much wetter than normal in the northern Middle Atlantic region. Since 1869, there have been 9 August cases where New York City picked up 20.00" or more rainfall during the summer. Two thirds of those cases (and 4/5 of those with summer mean temperatures of 73.0° or above) had 17.00" or more fall precipitation in New York City. 2011 is probably the closest match in terms of precipitation and a nearly identical summer mean temperature. Mean fall precipitation for those 9 cases was 14.86". The median was 17.35". The 1991-2020 normal value is 12.27". The ENSO Region 1+2 anomaly was -0.2°C and the Region 3.4 anomaly was -0.3°C for the week centered around September 8. For the past six weeks, the ENSO Region 1+2 anomaly has averaged +0.22°C and the ENSO Region 3.4 anomaly has averaged -0.43°C. Neutral ENSO conditions will likely prevail through September. Afterward, La Niña conditions could begin to develop. The SOI was +14.50 today. The preliminary Arctic Oscillation (AO) figure was +0.279 today. On September 15 the MJO was in Phase 3 at an amplitude of 1.852 (RMM). The September 14-adjusted amplitude was 2.022 (RMM). Based on sensitivity analysis applied to the latest guidance, there is an implied 60% probability that New York City will have a warmer than normal September (1991-2020 normal). September will likely finish with a mean temperature near 70.4° (1.2° above normal).