donsutherland1
-
Posts
24,197 -
Joined
Content Type
Profiles
Blogs
Forums
American Weather
Media Demo
Store
Gallery
Everything posted by donsutherland1
-
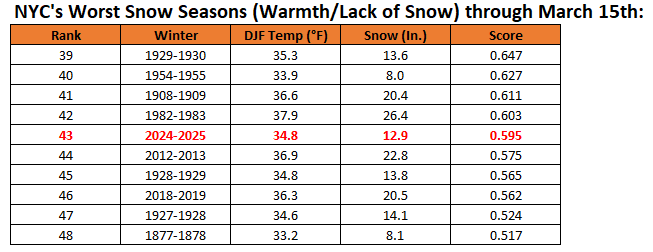
The rankings are from worst to best. Its higher ranking means that it was worse than the current winter.
-
Snow season ranking through March 15th:
-
A warming trend is now underway. Morning clouds--clouds that obscured the lunar eclipse in parts of the region--yielded to sunshine. The mercury rebounded into the lower and middle 50s. A mild weekend lies ahead. Tomorrow will be mainly cloudy with temperatures rising into the lower and middle 50s. The weekend could end with unseasonably warm temperatures in the lower and middle 60s. Rain will likely arrive on Sunday and continue into Monday. A thunderstorm is possible. A general 0.50"-1.50" rainfall is likely in and around New York City. In the wake of the rainstorm, the mild weather will continue. The long-range guidance has turned warmer for much of the remainder of March. As a result, there is an increasing prospect that New York City has seen its last measurable snowfall of the 2024-2025 season. The ENSO Region 1+2 anomaly was +1.6°C and the Region 3.4 anomaly was 0.0°C for the week centered around March 5. For the past six weeks, the ENSO Region 1+2 anomaly has averaged +0.68°C and the ENSO Region 3.4 anomaly has averaged -0.37°C. Neutral ENSO conditions have developed. Neutral ENSO conditions will likely continue into at least late spring. The SOI was +5.22 today. The preliminary Arctic Oscillation (AO) was -0.439 today. Based on sensitivity analysis applied to the latest guidance, there is an implied 93% probability that New York City will have a warmer than normal March (1991-2020 normal). March will likely finish with a mean temperature near 46.9° (4.1° above normal).
-
A warming trend will commence tomorrow. The weekend could end with unseasonably warm temperatures in the lower and middle 60s. In addition, rain will likely arrive on Sunday and continue into Monday. A general 0.50"-1.50" rainfall is likely in and around New York City. In the wake of the rainstorm, the mild weather will continue. The long-range guidance has turned warmer for much of the remainder of March. As a result, there is an increasing prospect that New York City has seen its last measurable snowfall of the 2024-2025 season. The ENSO Region 1+2 anomaly was +1.6°C and the Region 3.4 anomaly was 0.0°C for the week centered around March 5. For the past six weeks, the ENSO Region 1+2 anomaly has averaged +0.68°C and the ENSO Region 3.4 anomaly has averaged -0.37°C. Neutral ENSO conditions have developed. Neutral ENSO conditions will likely continue into at least late spring. The SOI was +12.35 today. The preliminary Arctic Oscillation (AO) was -1.369 today. Based on sensitivity analysis applied to the latest guidance, there is an implied 92% probability that New York City will have a warmer than normal March (1991-2020 normal). March will likely finish with a mean temperature near 46.9° (4.1° above normal).
-
Rain could arrive on Sunday and continue into Monday. The potential exists for a moderate to significant rainfall. The risk of a moderate (4" or more) in the New York City area remains low through at least the first three weeks of March. A significant or substantial snowfall in New York City is unlikely for the remainder of the 2024-2025 snow season. There is an increasing prospect that New York City has seen its last measurable snowfall of the 2024-2025 season. The strong PNA ridge that predominated for most of the second half of February dissipated during the first week of March. However, the peak magnitude of that previous PNA ridge suggests that the New York City area likely won't experience any major snowfalls for the remainder of the 2024-2025 snow season. The historic experience hints that the rising warmth of spring becomes too great to overcome by the time an otherwise favorable pattern for such snowfalls develops. The PNA reached +1.500 on February 19th and remained at or above +1.500 through February 23rd and at or above +1.000 through February 28th. In all 12 years that saw the PNA reach +1.500 or above on February 15 or later since 1950, the remainder of winter saw no 10" or greater snowstorms. If historic experience holds true yet again, that would make the 2024-2025 snow season the fourth consecutive snow season without a 10" or above snowstorm in New York City. The last time that happened was during 2016-2017 through 2019-2020. Most of the 12 cases cited above went on to see some additional measurable snowfall with a few seeing a 6"+ storm. The ENSO Region 1+2 anomaly was +1.6°C and the Region 3.4 anomaly was 0.0°C for the week centered around March 5. For the past six weeks, the ENSO Region 1+2 anomaly has averaged +0.68°C and the ENSO Region 3.4 anomaly has averaged -0.37°C. Neutral ENSO conditions have developed. Neutral ENSO conditions will likely continue into at least late spring. The SOI was +7.42 today. The preliminary Arctic Oscillation (AO) was -1.157 today. Based on sensitivity analysis applied to the latest guidance, there is an implied 90% probability that New York City will have a warmer than normal March (1991-2020 normal). March will likely finish with a mean temperature near 46.8° (4.0° above normal).
-
Tomorrow and Thursday will be cooler days. Highs tomorrow will reach the lower 50s. Readings on Thursday could top out in the middle and upper 40s. Nevertheless, a generally mild pattern continues and will last through at least the weekend. The March 10-17 period will see temperatures average much above normal across the Middle Atlantic and southern New England regions. Rain could arrive on Sunday and continue into Monday. The potential exists for a moderate to significant rainfall. The risk of a moderate (4" or more) in the New York City area remains low through at least the first three weeks of March. A significant or substantial snowfall in New York City is unlikely for the remainder of the 2024-2025 snow season. There is an increasing prospect that New York City has seen its last measurable snowfall of the 2024-2025 season. The strong PNA ridge that predominated for most of the second half of February dissipated during the first week of March. However, the peak magnitude of that previous PNA ridge suggests that the New York City area likely won't experience any major snowfalls for the remainder of the 2024-2025 snow season. The historic experience hints that the rising warmth of spring becomes too great to overcome by the time an otherwise favorable pattern for such snowfalls develops. The PNA reached +1.500 on February 19th and remained at or above +1.500 through February 23rd and at or above +1.000 through February 28th. In all 12 years that saw the PNA reach +1.500 or above on February 15 or later since 1950, the remainder of winter saw no 10" or greater snowstorms. If historic experience holds true yet again, that would make the 2024-2025 snow season the fourth consecutive snow season without a 10" or above snowstorm in New York City. The last time that happened was during 2016-2017 through 2019-2020. Most of the 12 cases cited above went on to see some additional measurable snowfall with a few seeing a 6"+ storm. The ENSO Region 1+2 anomaly was +1.6°C and the Region 3.4 anomaly was 0.0°C for the week centered around March 5. For the past six weeks, the ENSO Region 1+2 anomaly has averaged +0.68°C and the ENSO Region 3.4 anomaly has averaged -0.37°C. Neutral ENSO conditions have developed. Neutral ENSO conditions will likely continue into at least late spring. The SOI was +10.29 today. The preliminary Arctic Oscillation (AO) was -0.729 today. Based on sensitivity analysis applied to the latest guidance, there is an implied 85% probability that New York City will have a warmer than normal March (1991-2020 normal). March will likely finish with a mean temperature near 46.3° (3.5° above normal).
-
I don’t have daily data from there.
-
I'm not sure what was going on to explain the differences. However, I had previously run a regression equation contrasting the amounts with snowfall at Philadelphia. The Central Park site had a stronger correlation and smaller error. My hypothesis is that the Battery Park measurements were inflated at times due to drifting (stronger winds coming in off New York Harbor).
-
Under bright sunshine, the temperature surged into the middle 60s across the New York City area. Through March 10th, New York City has a monthly mean temperature of 42.3°. Since 2000, there have been 11 cases with a March 1-10 mean temperature of 42.0° or above. In 10 (91%) of cases, March wound up with a warmer than normal monthly average. In six (55%) of cases, March had a monthly temperature anomaly of 3° or more above normal. The generally unseasonably mild weather will likely continue through the remainder of the week even as Wednesday and Thursday will be briefly cooler days. The March 10-17 period will see temperatures average much above normal across the Middle Atlantic and southern New England regions. Parts of the region will likely experience their warmest weather so far this season during the warm spell. Rain could arrive on Sunday and continue into Monday. The risk of a moderate (4" or more) in the New York City area remains low through at least the first three weeks of March. A significant or substantial snowfall in New York City is unlikely for the remainder of the 2024-2025 snow season. There is an increasing prospect that New York City has seen its last measurable snowfall of the 2024-2025 season. The strong PNA ridge that predominated for most of the second half of February dissipated during the first week of March. However, the peak magnitude of that previous PNA ridge suggests that the New York City area likely won't experience any major snowfalls for the remainder of the 2024-2025 snow season. The historic experience hints that the rising warmth of spring becomes too great to overcome by the time an otherwise favorable pattern for such snowfalls develops. The PNA reached +1.500 on February 19th and remained at or above +1.500 through February 23rd and at or above +1.000 through February 28th. In all 12 years that saw the PNA reach +1.500 or above on February 15 or later since 1950, the remainder of winter saw no 10" or greater snowstorms. If historic experience holds true yet again, that would make the 2024-2025 snow season the fourth consecutive snow season without a 10" or above snowstorm in New York City. The last time that happened was during 2016-2017 through 2019-2020. Most of the 12 cases cited above went on to see some additional measurable snowfall with a few seeing a 6"+ storm. The ENSO Region 1+2 anomaly was +1.6°C and the Region 3.4 anomaly was 0.0°C for the week centered around March 5. For the past six weeks, the ENSO Region 1+2 anomaly has averaged +0.68°C and the ENSO Region 3.4 anomaly has averaged -0.37°C. Neutral ENSO conditions have developed. Neutral ENSO conditions will likely continue into at least late spring. The SOI was +6.17 today. The preliminary Arctic Oscillation (AO) was -0.850 today. Based on sensitivity analysis applied to the latest guidance, there is an implied 81% probability that New York City will have a warmer than normal March (1991-2020 normal). March will likely finish with a mean temperature near 46.0° (3.2° above normal).
-
The lunar eclipse will occur during the night of March 13th. The rain won't arrive until Sunday. Cloud cover could still be an issue in parts of the region.
-
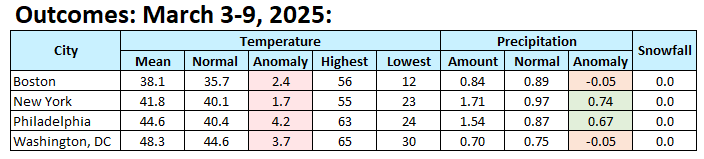
The final results:
-
Milder air streamed into the region this afternoon, boosting readings into the lower 50s in parts of the area. It will turn noticeably milder tomorrow. The unseasonably mild weather could then continue through the remainder of the week. The March 10-17 period will see temperatures average much above normal across the Middle Atlantic and southern New England regions. Parts of the region will likely experience their warmest weather so far this season during the warm spell. Rain could arrive on Sunday and continue into Monday. The risk of a moderate (4" or more) in the New York City area remains low through at least the first three weeks of March. A significant or substantial snowfall in New York City is unlikely for the remainder of the 2024-2025 snow season. The strong PNA ridge that predominated for most of the second half of February dissipated during the first week of March. However, the peak magnitude of that previous PNA ridge suggests that the New York City area likely won't experience any major snowfalls for the remainder of the 2024-2025 snow season. The historic experience hints that the rising warmth of spring becomes too great to overcome by the time an otherwise favorable pattern for such snowfalls develops. The PNA reached +1.500 on February 19th and remained at or above +1.500 through February 23rd and at or above +1.000 through February 28th. In all 12 years that saw the PNA reach +1.500 or above on February 15 or later since 1950, the remainder of winter saw no 10" or greater snowstorms. If historic experience holds true yet again, that would make the 2024-2025 snow season the fourth consecutive snow season without a 10" or above snowstorm in New York City. The last time that happened was during 2016-2017 through 2019-2020. Most of the 12 cases cited above went on to see some additional measurable snowfall with a few seeing a 6"+ storm. The ENSO Region 1+2 anomaly was +1.1°C and the Region 3.4 anomaly was -0.2°C for the week centered around February 26. For the past six weeks, the ENSO Region 1+2 anomaly has averaged +0.35°C and the ENSO Region 3.4 anomaly has averaged -0.52°C. La Niña conditions will likely give way to neutral ENSO conditions during early spring. The SOI was +6.17 today. The preliminary Arctic Oscillation (AO) was -1.177 today. Based on sensitivity analysis applied to the latest guidance, there is an implied 81% probability that New York City will have a warmer than normal March (1991-2020 normal). March will likely finish with a mean temperature near 46.1° (3.3° above normal).
-
I agree. Hopefully, the forecast rain for next weekend on the guidance will materialize.
-
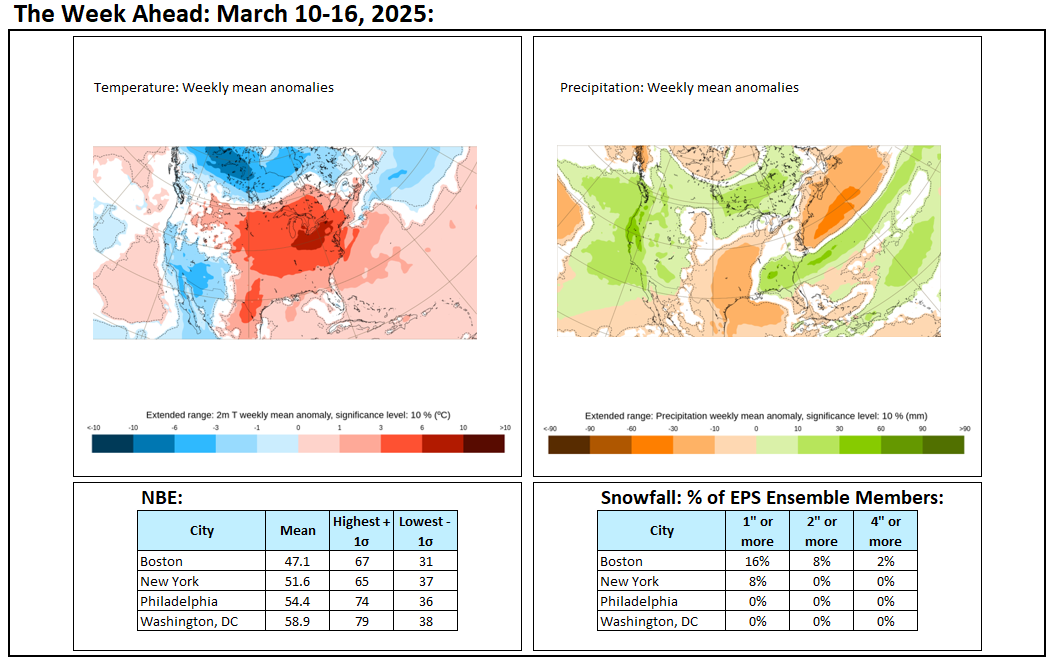
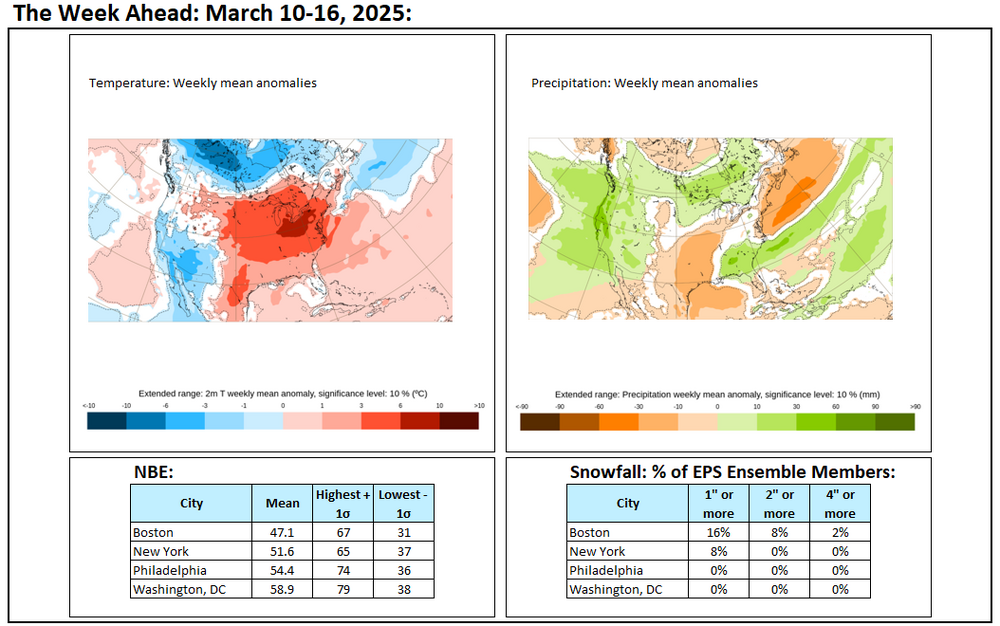
The week ahead: Generally much warmer than normal.
-
It will turn noticeably milder early next week. Parts of the region could experience their warmest temperatures so far this spring during the warm spell. The unseasonably mild weather could then continue through the remainder of next week. The weekend and week ahead will also be mainly dry. The risk of a moderate (4" or more) or larger snowfall in the New York City area remains low through at least the first half of March. The March 10-17 period could feature a bout of much above normal temperatures. The strong PNA ridge that predominated for most of the second half of February dissipated during the first week of March. However, the peak magnitude of that previous PNA ridge suggests that the New York City area likely won't experience any major snowfalls for the remainder of the 2024-2025 snow season. The historic experience hints that the rising warmth of spring becomes too great to overcome by the time an otherwise favorable pattern for such snowfalls develops. The PNA reached +1.500 on February 19th and remained at or above +1.500 through February 23rd and at or above +1.000 through February 28th. In all 12 years that saw the PNA reach +1.500 or above on February 15 or later since 1950, the remainder of winter saw no 10" or greater snowstorms. If historic experience holds true yet again, that would make the 2024-2025 snow season the fourth consecutive snow season without a 10" or above snowstorm in New York City. The last time that happened was during 2016-2017 through 2019-2020. Most of the 12 cases cited above went on to see some additional measurable snowfall with a few seeing a 6"+ storm. The ENSO Region 1+2 anomaly was +1.1°C and the Region 3.4 anomaly was -0.2°C for the week centered around February 26. For the past six weeks, the ENSO Region 1+2 anomaly has averaged +0.35°C and the ENSO Region 3.4 anomaly has averaged -0.52°C. La Niña conditions will likely give way to neutral ENSO conditions during early spring. The SOI was +10.96 today. The preliminary Arctic Oscillation (AO) was -0.909 today. Based on sensitivity analysis applied to the latest guidance, there is an implied 80% probability that New York City will have a warmer than normal March (1991-2020 normal). March will likely finish with a mean temperature near 46.1° (3.3° above normal).
-
It will take time to research all of the storms. But yes, it can be done.
-
There were some snow flurries in Larchmont.
-
Intervals in days or between storms?
-
I thought the question concerned consecutive days without 6" or more snow. Obviously, the intervals between 6"+ storms is shorter
-
A cool but not exceptionally cold weekend lies ahead. The chill will be short-lived. It will turn noticeably milder early next week. Parts of the region could experience their warmest temperatures so far this spring during the warm spell. The unseasonably mild weather could then continue through the remainder of next week. The risk of a moderate (4" or more) or larger snowfall in the New York City area remains low through at least the first half of March. The March 10-17 period could feature a bout of much above normal temperatures. The strong PNA ridge that predominated for most of the second half of February has dissipated. However, the peak magnitude of that previous PNA ridge suggests that the New York City area likely won't experience any major snowfalls for the remainder of the 2024-2025 snow season. The historic experience hints that the rising warmth of spring becomes too great to overcome by the time an otherwise favorable pattern for such snowfalls develops. The PNA reached +1.500 on February 19th and remained at or above +1.500 through February 23rd and at or above +1.000 through February 28th. In all 12 years that saw the PNA reach +1.500 or above on February 15 or later since 1950, the remainder of winter saw no 10" or greater snowstorms. If historic experience holds true yet again, that would make the 2024-2025 snow season the fourth consecutive snow season without a 10" or above snowstorm in New York City. The last time that happened was during 2016-2017 through 2019-2020. Most of the 12 cases cited above went on to see some additional measurable snowfall with a few seeing a 6"+ storm. The ENSO Region 1+2 anomaly was +1.1°C and the Region 3.4 anomaly was -0.2°C for the week centered around February 26. For the past six weeks, the ENSO Region 1+2 anomaly has averaged +0.35°C and the ENSO Region 3.4 anomaly has averaged -0.52°C. La Niña conditions will likely give way to neutral ENSO conditions during early spring. The SOI was +9.48 today. The preliminary Arctic Oscillation (AO) was +0.487 today. Based on sensitivity analysis applied to the latest guidance, there is an implied 80% probability that New York City will have a warmer than normal March (1991-2020 normal). March will likely finish with a mean temperature near 46.3° (3.5° above normal).
-
December 13-14, 1917 saw a 9.5" snowstorm. Then there were no more 6" or above snowstorms until February 4-7, 1920 when a storm dumped 17.5".
-
Through March 5th, Boston has had 28.1" of snow. Normal through March 5th is 41.0". Boston is more than 30% below normal. I wouldn't describe its current snowfall as being "slightly below normal."
-
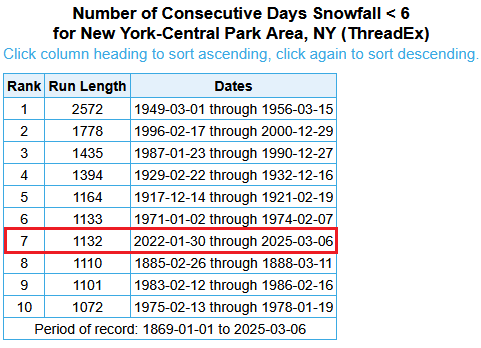
NYC is still far from its record:
-
It will be cooler tomorrow through the weekend. However, it will turn noticeably milder early next week. Parts of the region could experience their warmest temperatures so far this spring. The unseasonably mild weather could then continue through the remainder of next week. The risk of a moderate (4" or more) or larger snowfall in the New York City area remains low through at least the first half of March. The March 10-17 period could feature a bout of much above normal temperatures. The strong PNA ridge that predominated for most of the second half of February has now broken down. However, the peak magnitude of that previous PNA ridge suggests that the New York City area likely won't experience any major snowfalls for the remainder of the 2024-2025 snow season. The historic experience hints that the rising warmth of spring becomes too great to overcome by the time an otherwise favorable pattern for such snowfalls develops. The PNA reached +1.500 on February 19th and remained at or above +1.500 through February 23rd and at or above +1.000 through February 28th. In all 12 years that saw the PNA reach +1.500 or above on February 15 or later since 1950, the remainder of winter saw no 10" or greater snowstorms. If historic experience holds true yet again, that would make the 2024-2025 snow season the fourth consecutive snow season without a 10" or above snowstorm in New York City. The last time that happened was during 2016-2017 through 2019-2020. Most of the 12 cases cited above went on to see some additional measurable snowfall with a few seeing a 6"+ storm. The ENSO Region 1+2 anomaly was +1.1°C and the Region 3.4 anomaly was -0.2°C for the week centered around February 26. For the past six weeks, the ENSO Region 1+2 anomaly has averaged +0.35°C and the ENSO Region 3.4 anomaly has averaged -0.52°C. La Niña conditions will likely give way to neutral ENSO conditions during early spring. The SOI was +1.15 today. The preliminary Arctic Oscillation (AO) was +1.700 today.