donsutherland1
-
Posts
24,197 -
Joined
Content Type
Profiles
Blogs
Forums
American Weather
Media Demo
Store
Gallery
Everything posted by donsutherland1
-
It will turn colder tomorrow. Another storm will bring a period of snow changing to rain during the weekend. A 1"-3" accumulation is likely in and around New York City. A few places could see some slightly higher amounts. The precipitation will likely begin on Saturday and continue into Sunday. A general 1"-2" of precipitation is likely from Washington, DC to New York City. Some locally higher amounts are possible. The temperature could surge into the 50s in New York City and lower 60s in Washington, DC on Sunday. In the wake of the storm, it will turn sharply colder on Monday. Temperatures could fall into the teens on Tuesday morning from Baltimore northward into New England. The cold will likely persist through the remainder of the week. A storm could bring snow to parts of the East Coast after the middle of next week. Overall, generally colder outcome is likely during the second half of February. Precipitation will likely be near or somewhat above normal. The ENSO Region 1+2 anomaly was +0.1°C and the Region 3.4 anomaly was -0.6°C for the week centered around February 5. For the past six weeks, the ENSO Region 1+2 anomaly has averaged -0.10°C and the ENSO Region 3.4 anomaly has averaged -0.72°C. La Niña conditions are underway and will likely persist into the start of spring. The SOI was -5.43 today. The preliminary Arctic Oscillation (AO) was -3.663 today. Based on sensitivity analysis applied to the latest guidance, there is an implied 93% probability that New York City will have a colder than normal February (1991-2020 normal). February will likely finish with a mean temperature near 32.4° (3.5° below normal).
-
January 2026 wasn't on the list.
-
It didn't. It got 1.1" in 1983.
-
February 1989 is on the list; February 1983 is not.
-
No. I'm just illustrating that the range of possible outcomes is very large using Norfolk as an example.
-
The 12z GGEM shows > 10" snow in Norfolk and 1.5" for NYC. Since 1895, there have been 11 snowstorms that brought 10" or more snow to Norfolk. Eight (73%) had < 1" in New York City. The three (27%) with 1" or more, all had 6" or more. The most recent such storm was the Boxing Day Blizzard of 2010.
-
Here are the maps:
-
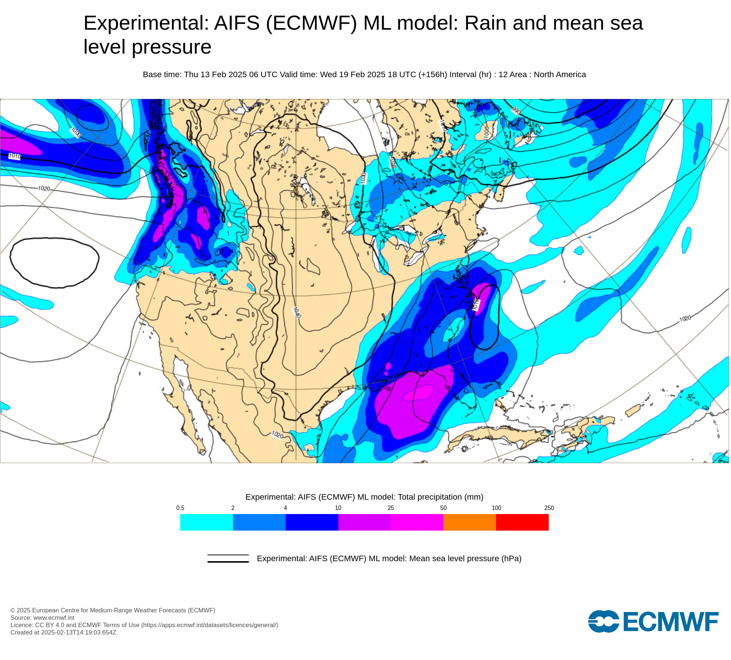
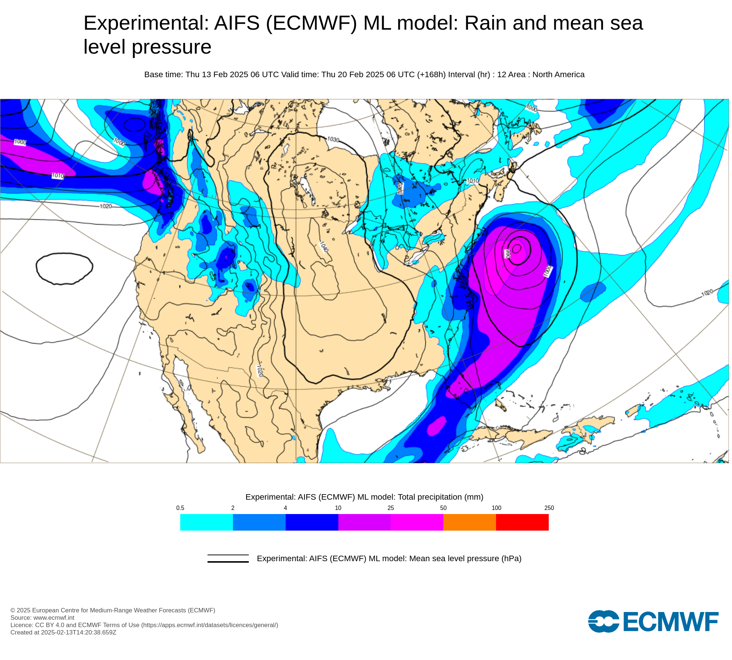
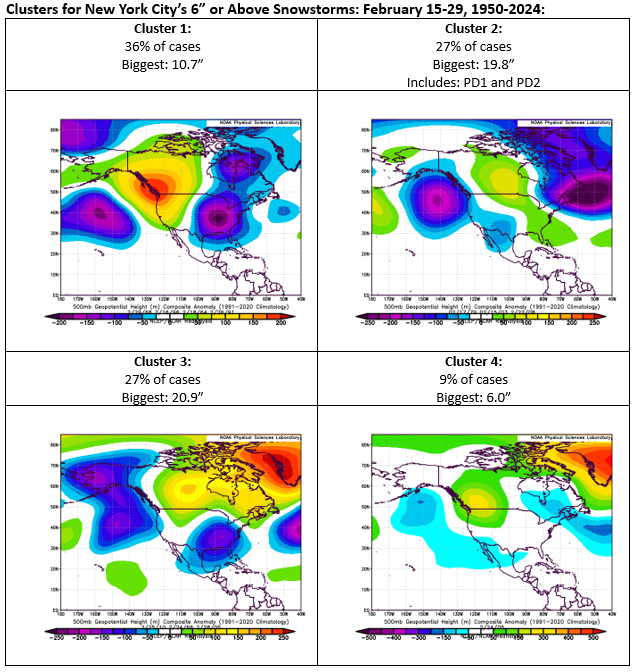
Social Media is the "Wild West" of forecasting. Anyone can put up an account and forecast. Many do. No verification is provided. Thus, there's no forecasting accountability. Moreover, the existing model is engagement-based and hype draws engagement. If one is looking for a major to blockbuster snowstorm, Cluster 2 is what one wants to see. It's that cluster that has seen storms bring significant to major snowfalls from Washington, DC to Boston during the second half of February. Below is the composite for KU snowstorms from February 8-29 (1950-2024): All the storms were Category 4 storms on the NESIS scale with only the February 2006 storm being a Category 3. Key Themes: 1. Cluster 2 and the more expansive timeframe both feature a deep trough in the vicinity of the Gulf of Alaska/off the Pacific Northwest and one over northeastern North America. 2. Cluster 2 and the more expansive timeframe also have a trough in the southern Plains. Synoptic details, whether one is looking for surface features or 500 mb vorticity, are really not reliable beyond 3 days (and sometimes fewer days). Thus, posted snowfall maps from 7-8 days out are really not very useful. Ensembles are more skillful. The ensembles suggest that the potential for snow exists for next week somewhere in the Middle Atlantic and/or southern New England regions. Pattern differences, including differences from the Clusters shown above, and the differences among the individual ensemble members suggest that it is far too soon to know whether there will be a moderate, significant, or major snowstorm, much less where the heaviest snows would fall were such a storm to materialize. Acknowledging the uncertainty and highlighting the limits of what is currently known does not generate excitement/engagement on Social Media. That reality, even as it is good forecasting practice, is exploited by those who hype without accountability. Finally, I'd like to see less ridging out in the Pacific Northwest region. With the shorter wave lengths, the kind of ridging that can work well in January can lead to more suppressed solutions during the second half of February.
-
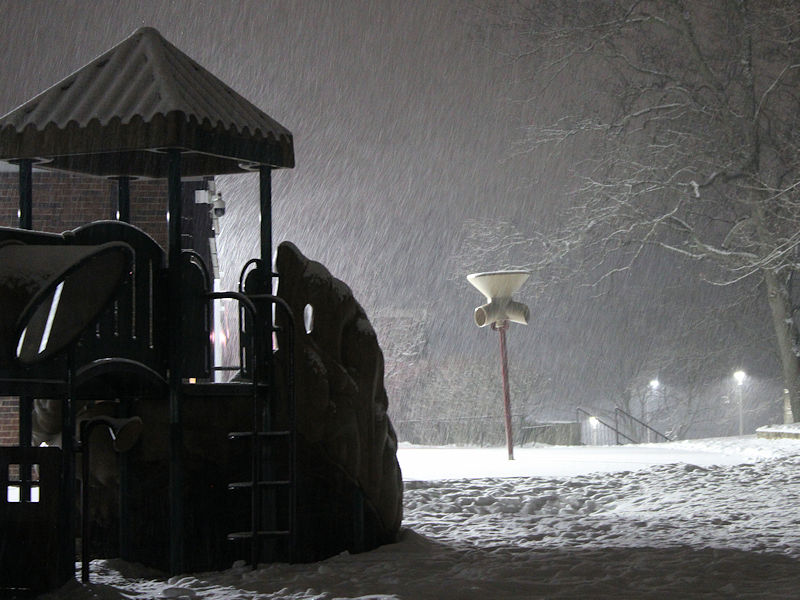
Light snow with small flakes in Larchmont, but temperatures are above freezing and the snow is not sticking as of now.
-
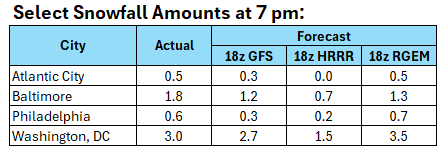
Overnight, a storm passing well south of the region brought a light snowfall to the region. Snowfall amounts included: Atlantic City: 7.8" Baltimore: 3.8" Bridgeport: 2.0" New York City-Central Park: 1.5" New York City-JFK Airport: 1.8" New York City-LaGuardia Airport: 1.5" Newark: 1.5" Philadelphia: 3.1" Washington, DC: 6.4" The storm was Washington, DC's second 6" or greater snowstorm this winter. The last time a winter had two such storms was Winter 2013-2014. Another system will follow closely behind. This system will bring another light snowfall followed by a fairly quick changeover to sleet and then rain tomorrow. Little or no accumulation is likely in New York City. After mid-month, a period of much below normal temperatures is likely. A generally colder outcome is likely during the second half of February. Precipitation will likely be near or somewhat above normal. The ENSO Region 1+2 anomaly was +0.1°C and the Region 3.4 anomaly was -0.6°C for the week centered around February 5. For the past six weeks, the ENSO Region 1+2 anomaly has averaged -0.10°C and the ENSO Region 3.4 anomaly has averaged -0.72°C. La Niña conditions are underway and will likely persist into the start of spring. The SOI was +0.14 today. The preliminary Arctic Oscillation (AO) was -3.009 today. Based on sensitivity analysis applied to the latest guidance, there is an implied 86% probability that New York City will have a colder than normal February (1991-2020 normal). February will likely finish with a mean temperature near 32.7° (3.2° below normal).
-
It's not a slam dunk either way. Some of the lagged composites have some cold that gives way to milder conditions. There are MJO cases (amplitude 1.0 or above) that have gone both ways. With wave lengths shortening and the seasonal transition getting underway, I'd be especially cautious about making firm conclusions (warm or cold) this far out, especially as MJO forecast skill also drops off markedly beyond 10-14 days.
-
If the numbers verify, Winter 2024-25 would have a seasonal mean temperature of 34.1° in New York City. That would be the coldest winter since 2014-15, which had a mean temperature of 31.7°.
-
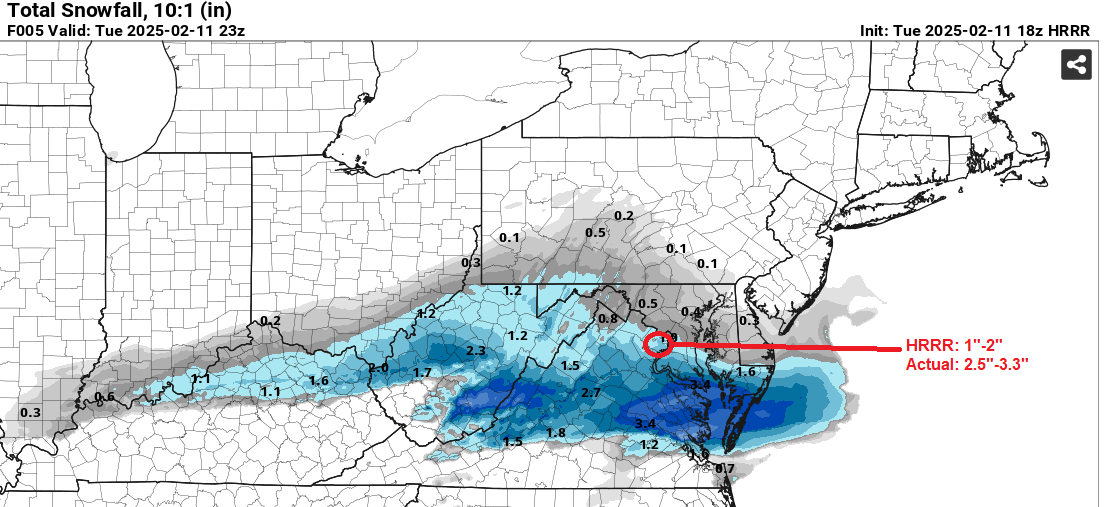
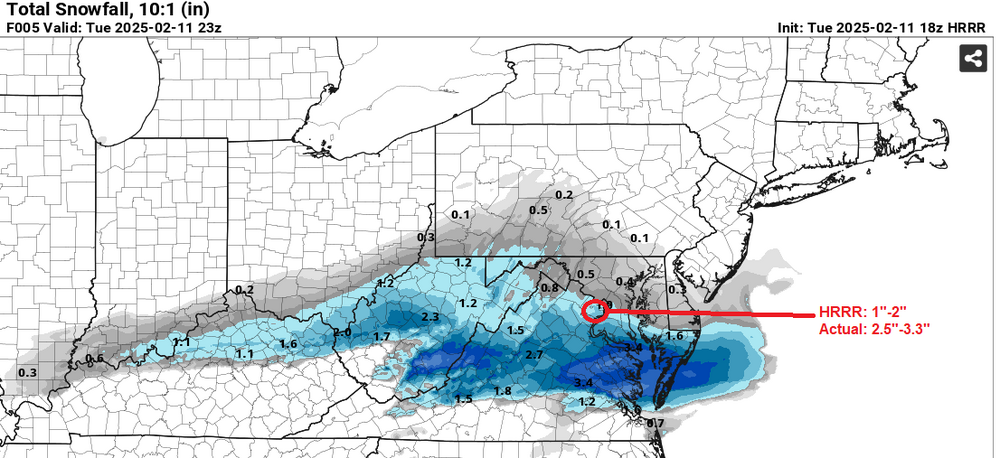
That's an early PNS before the snow stopped falling on Long Island. All in all, it looks as if the storm was well forecast. The HRRR did badly, but that isn't a big surprise, as it was well off track by early yesterday evening.
-
There are some 3" amounts (including a 3.1" amount) on Long Island taken by NWS employees in Suffolk County. Those reports will likely be in the next PNS.
-
Washington, DC picked up 6.3" of snow. This was the second 6" or above snowstorm this winter. The last time that happened was Winter 2013-2014.
-
Washington, DC has received 4" or more snow for the second time this winter. The last time that occurred was during Winter 2014-2015.
-
Early on, the HRRR seems to be faring poorly in and around the Washington, DC area. It remains to be seen how this will translate farther north. Nevertheless, I'm still comfortable with the idea of a 1"-3" snowfall in and near New York City with perhaps 2"-4" on the south shore of Long Island.
-
As of 4:40 pm, it was snowing moderately in Washington, DC and lightly in Baltimore. Flurries had just moved into Philadelphia and Atlantic City. The first snow will reach New York City early tonight. Light snow is likely in New York City and its nearby suburbs into tomorrow. A general 1"-3" snowfall is likely in New York City and nearby suburbs by the time the snow ends on Wednesday. The south shore of Long Island could pick up 2"-4" of snow. The highest amounts will be south of the City. Amounts will rapidly fall off in the Hudson Valley. Washington, DC will likely see 4"-8" of snow. If Washington reaches 6" or more, that would be its second 6" or above snowstorm this winter for the first time since Winter 2013-2014. Another system will follow closely behind. This system will likely bring another light snowfall followed by a fairly quick changeover to sleet and then rain on Thursday. Little or no accumulation is likely in New York City. After mid-month, a period of much below normal temperatures is likely. A generally colder outcome appears more likely than not during the second half of February. Precipitation will likely be near or somewhat above normal. The ENSO Region 1+2 anomaly was +0.1°C and the Region 3.4 anomaly was -0.6°C for the week centered around February 5. For the past six weeks, the ENSO Region 1+2 anomaly has averaged -0.10°C and the ENSO Region 3.4 anomaly has averaged -0.72°C. La Niña conditions are underway and will likely persist into the start of spring. The SOI was +5.04 today. The preliminary Arctic Oscillation (AO) was -2.782 today. Based on sensitivity analysis applied to the latest guidance, there is an implied 86% probability that New York City will have a colder than normal February (1991-2020 normal). February will likely finish with a mean temperature near 32.7° (3.2° below normal).
-
There are no cases during the timeframe where the AO was at or below -1 while the NAO was positive.
-
For reference, clusters for New York City's 6" or greater snowstorms during the second half of February since 1950: With shortening wave lengths, it is perhaps not surprising that the biggest storms have featured a deep trough extending from just off Pacific Northwest into the Gulf of Alaska.
-
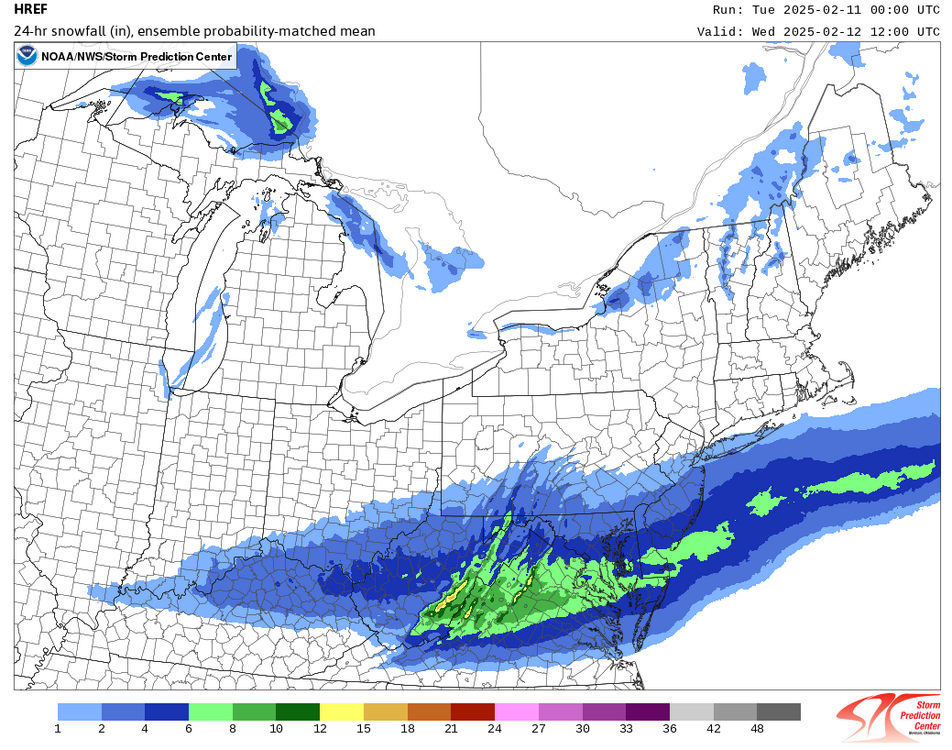
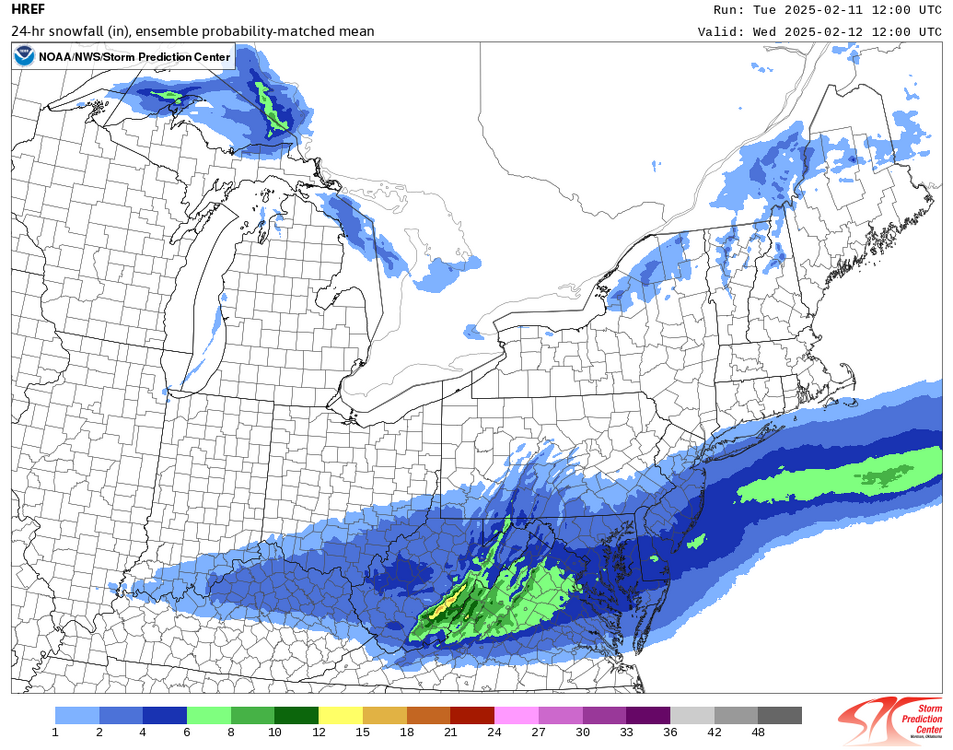
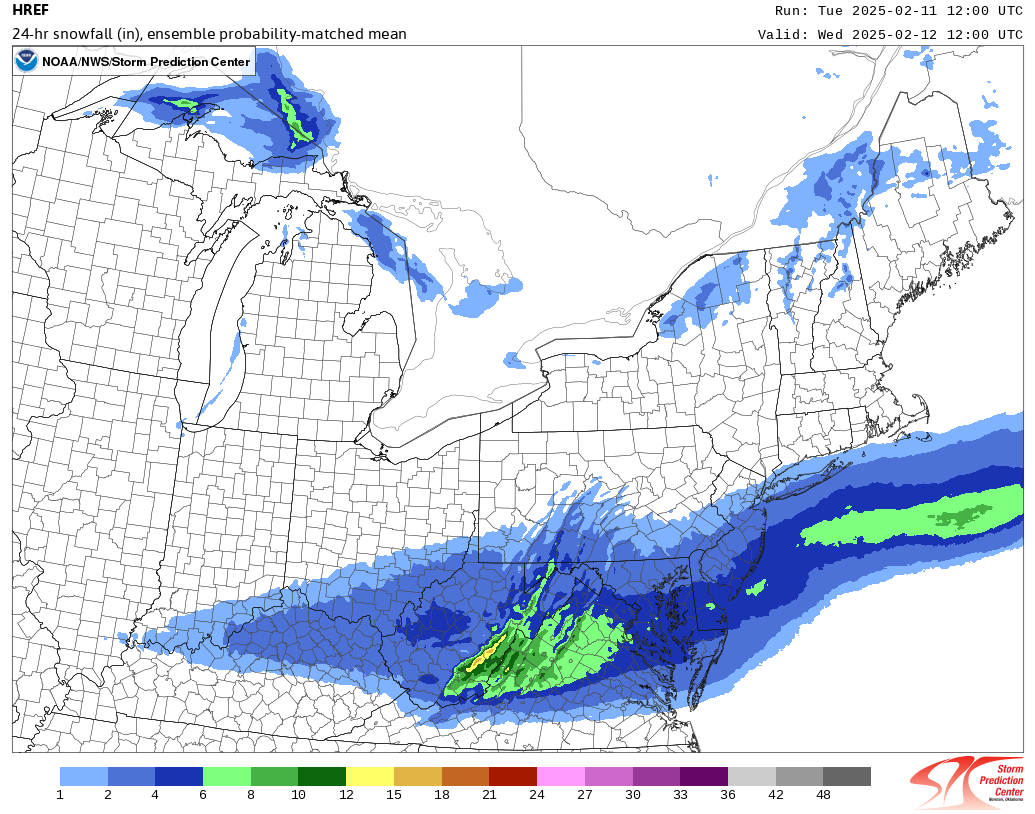
The HREF remains relatively unchanged for SE Pennsylvania to NYC/Long Island. There's actually some improvement for the South Shore of Long Island. 2/11 0z: 2/11 12: