OSUmetstud
-
Posts
16,433 -
Joined
-
Last visited
Content Type
Profiles
Blogs
Forums
American Weather
Media Demo
Store
Gallery
Everything posted by OSUmetstud
-
https://journals.ametsoc.org/doi/10.1175/JCLI-D-16-0132.1 Interesting findings I thought. This was also posted in the mid Atlantic winter thread.
-
-
Upstate/Eastern New York
OSUmetstud replied to BuffaloWeather's topic in Upstate New York/Pennsylvania
I didn't say that anywhere. -
Upstate/Eastern New York
OSUmetstud replied to BuffaloWeather's topic in Upstate New York/Pennsylvania
Basically. -
Upstate/Eastern New York
OSUmetstud replied to BuffaloWeather's topic in Upstate New York/Pennsylvania
Buffalo's 7 ft in mid November 2014 says hello. But el Nino as a whole is not great for western ny, unless it's weak, then there's been some good ones. -
Upstate/Eastern New York
OSUmetstud replied to BuffaloWeather's topic in Upstate New York/Pennsylvania
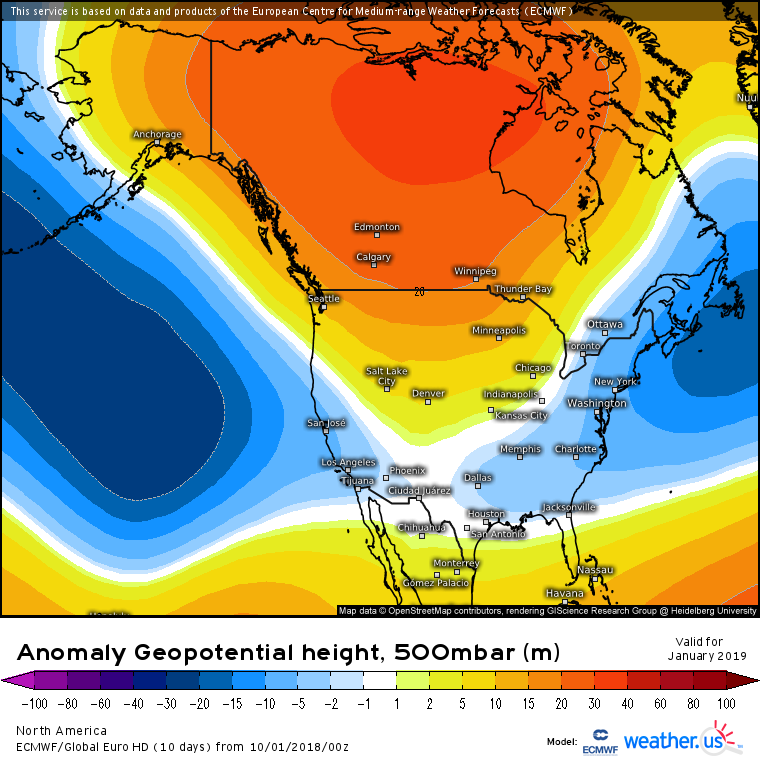
This isn't exactly true. Sometimes in El Nino years the PAC flow can invade AK and Canada so that theres warmth across much of the northern tier. November and December wave lengths are shorter than Jan Feb and March. This is my analog set for December, for example: Considerable improvement in Jan through March as the north PAC low sinks south towards Hawaii.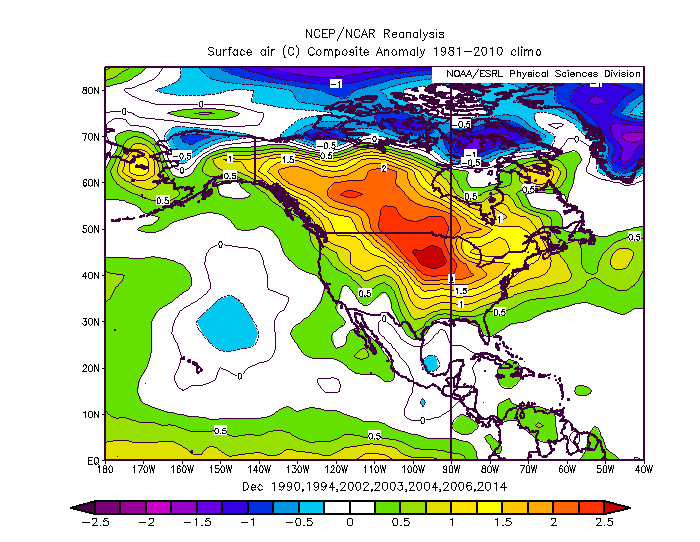
.png.f6286855c5b00a568aeeaf53e1aa4f42.png)
-
Upstate/Eastern New York
OSUmetstud replied to BuffaloWeather's topic in Upstate New York/Pennsylvania
Yeah its a bit counterintuitive in some respects. Its just that the "stakes" are higher in the winter and the sensible impacts to a poor forecast tend to be larger. -
Upstate/Eastern New York
OSUmetstud replied to BuffaloWeather's topic in Upstate New York/Pennsylvania
Yes. For a single month. Overall ecmwf does just a bit better. -
Upstate/Eastern New York
OSUmetstud replied to BuffaloWeather's topic in Upstate New York/Pennsylvania
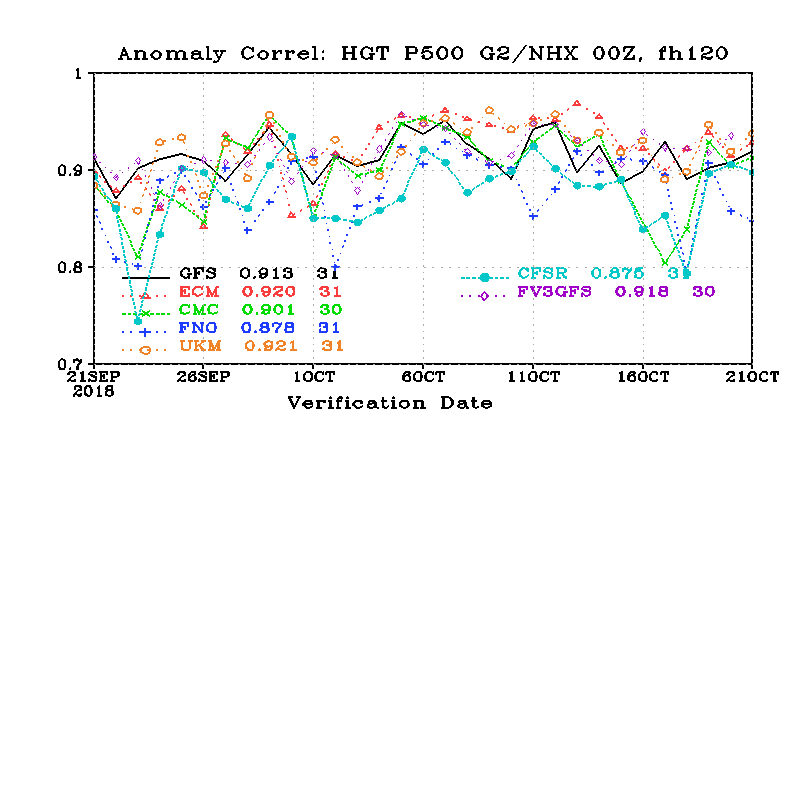
Yep. Its anomaly correlation so no percentage. It goes down in the summer and up in the winter. Predictability is worse in the summer because of weaker systems and shorter wave lengths. I can't seem to find the year to year improvement plot. -
Upstate/Eastern New York
OSUmetstud replied to BuffaloWeather's topic in Upstate New York/Pennsylvania
Yep. Enjoy. http://www.emc.ncep.noaa.gov/gmb/STATS_vsdb/ -
Upstate/Eastern New York
OSUmetstud replied to BuffaloWeather's topic in Upstate New York/Pennsylvania
Decent performance the past month...not too far under ecmwf/ukmet.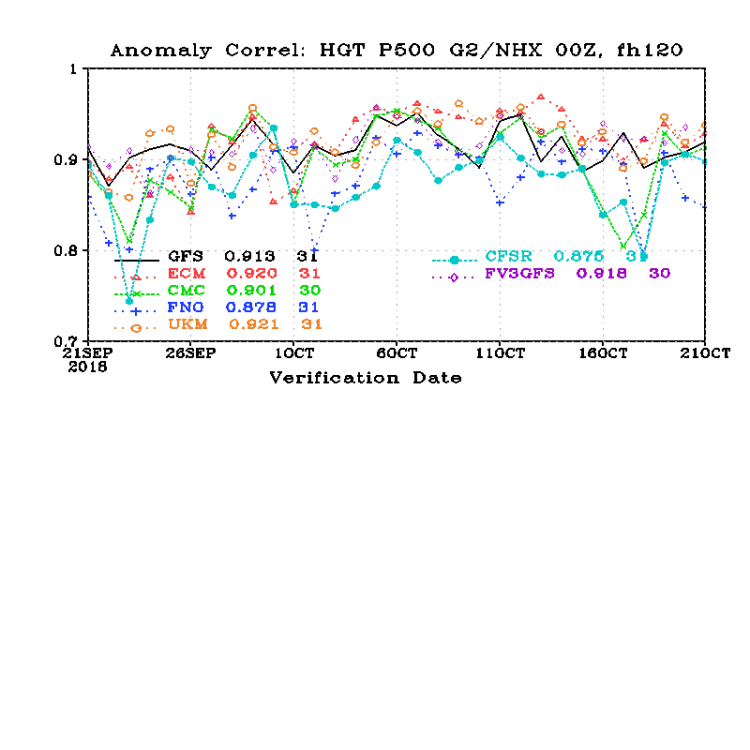
-
Upstate/Eastern New York
OSUmetstud replied to BuffaloWeather's topic in Upstate New York/Pennsylvania
Its skill scores are slightly higher than the existing gfs. It also doesn't over-intensify hurricanes, which of course the current one does. -
That paper isn't going to assess snow probabilities the best I think because it's focus is very intense lows. We know that we don't need overly intense lows to get a heavy snowstorm.
-
This is a cool paper. But I didn't see it make any sort of inference or correlation between fall nor'easters leading to winter ones. They just seem to be establishing a nor'easter climatology and then assessing risk via track and density based on different NAO and ENSO states.
-
Weak-Moderate El Nino 2018-2019
OSUmetstud replied to AfewUniversesBelowNormal's topic in Weather Forecasting and Discussion
That is true. Last year was the worst -
Weak-Moderate El Nino 2018-2019
OSUmetstud replied to AfewUniversesBelowNormal's topic in Weather Forecasting and Discussion
Yeah I was talking about the euro seasonal. -
Weak-Moderate El Nino 2018-2019
OSUmetstud replied to AfewUniversesBelowNormal's topic in Weather Forecasting and Discussion
Thanks. The October run last year actually did great for Dec, Jan, and Feb here. March failed because of the Feb strat warm event that caused a completely unpredicted pattern reversal. -
Qgis is free. We use it at the office. I'm not a GIS guy so there's a bit of a learning curve but you can make some really professional looking maps with it.
-
Weak-Moderate El Nino 2018-2019
OSUmetstud replied to AfewUniversesBelowNormal's topic in Weather Forecasting and Discussion
How did u get those plots from last fall? They aren't in the dropdown menu. -
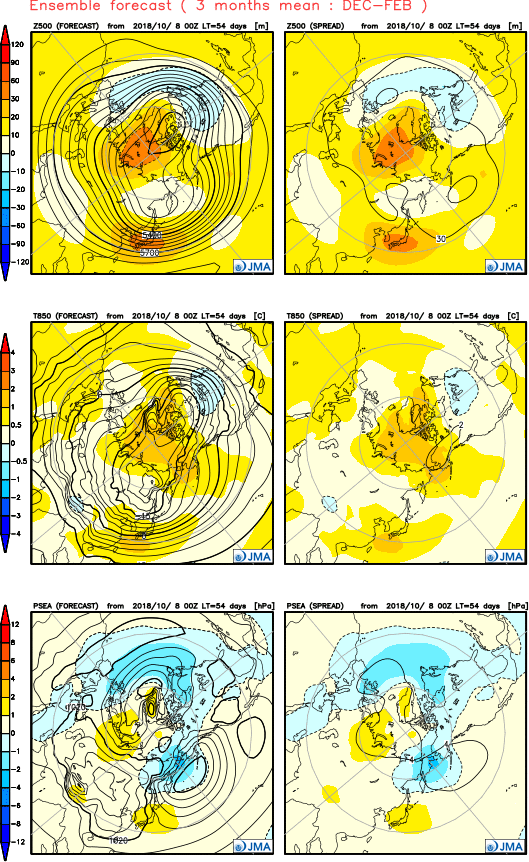
New jma is out. Looks really nice overall. Probably not quite as cool as the ukmet and ecmwf given the lack of ridging in ak and the pna region seen on the European guidance. December has the Aleutian low into the Bering which isn't as ideal as some other guidance. Looks better in Jan though.
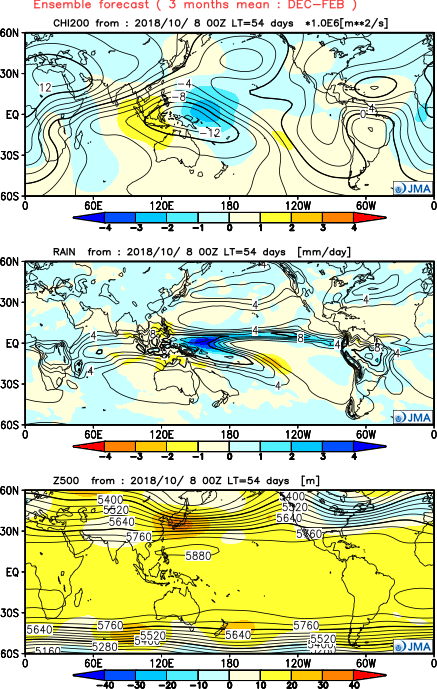
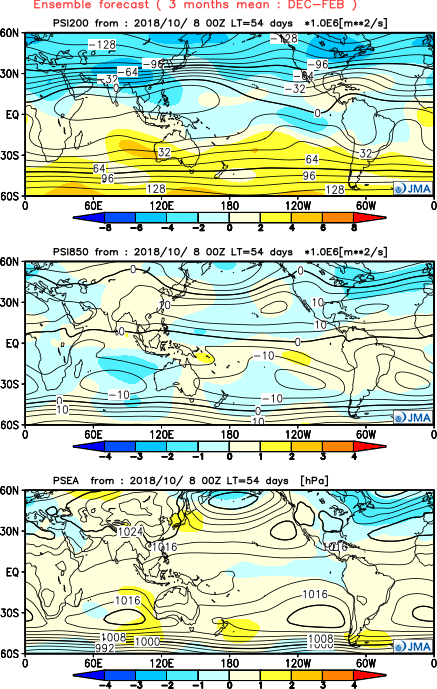
.thumb.png.e3bdfb8b123c5e38606ff1d522568bd1.png)
-
Is Tropical Storm Michael a threat to New England???????
OSUmetstud replied to USCAPEWEATHERAF's topic in New England
One of our guys out on the waq south of ns had a nice stinger last night from post-michael. 73g86kt at 60m. They were in that warm IR area south of the edge of the comma head.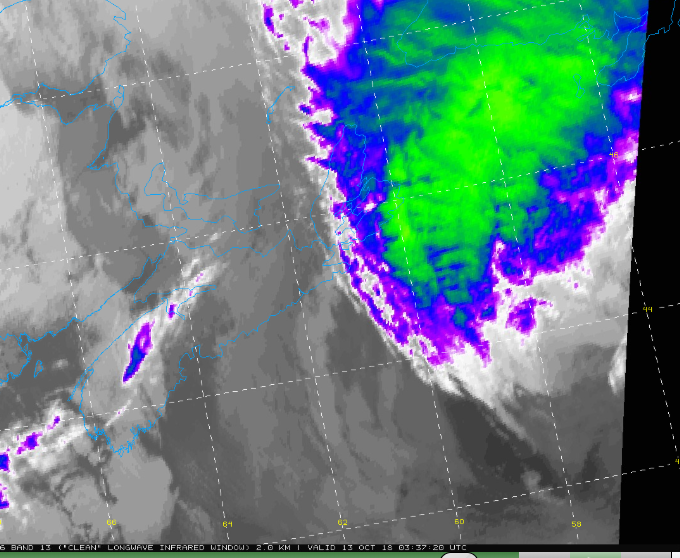
-
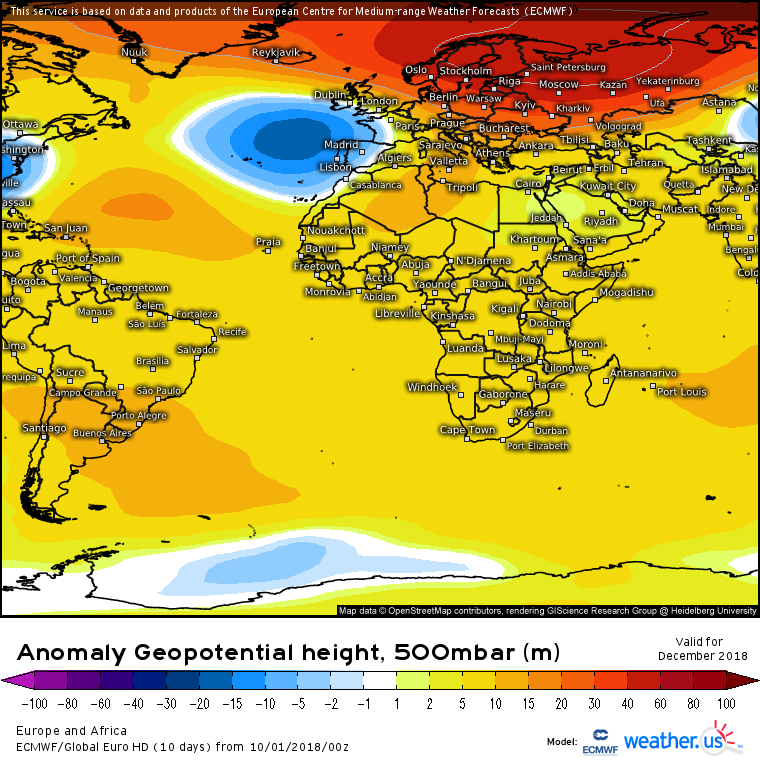
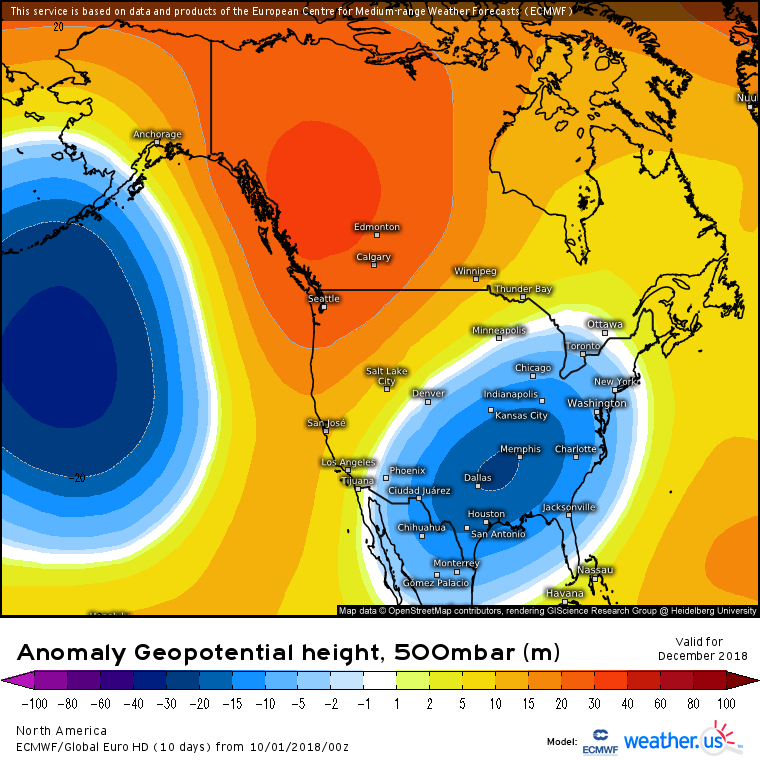
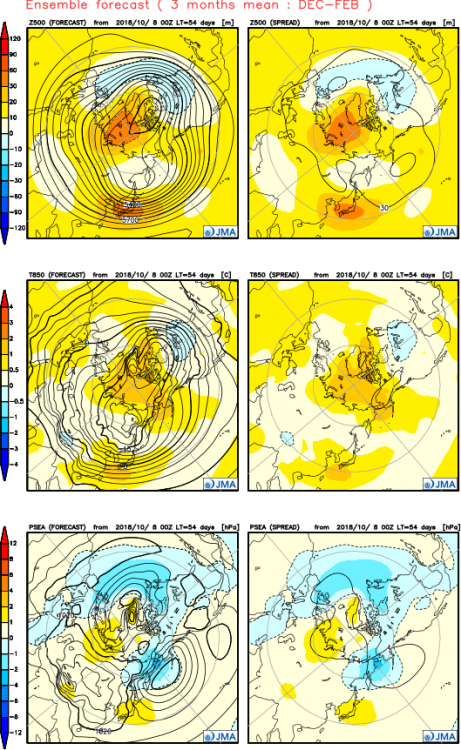
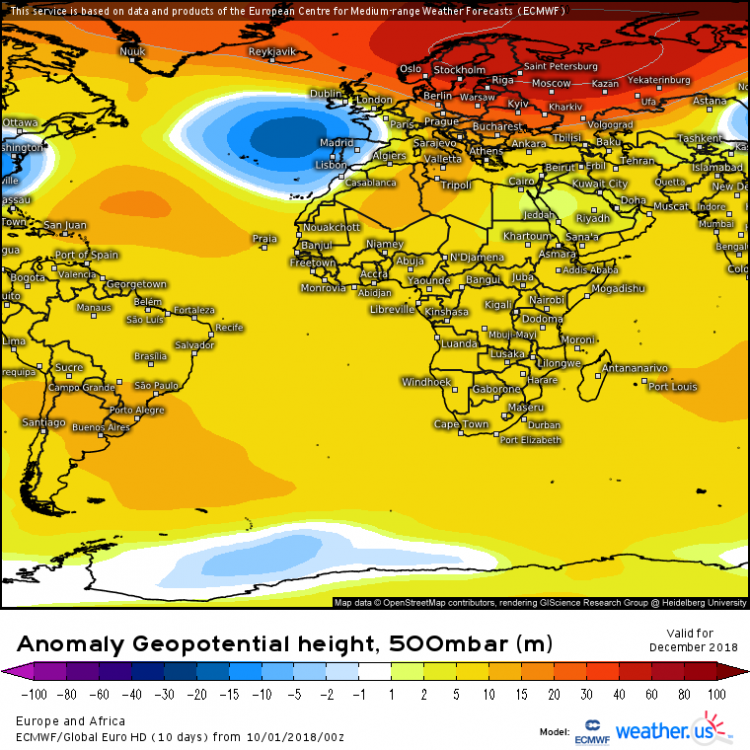
I'd call that probably a weak -nao overall in the means. Looks stronger but east based in December. You don't get low pressures and low heights over NL in a strong -NAO. The Aleutian low appears to stay west enough to not flood north america with PAC air.
-
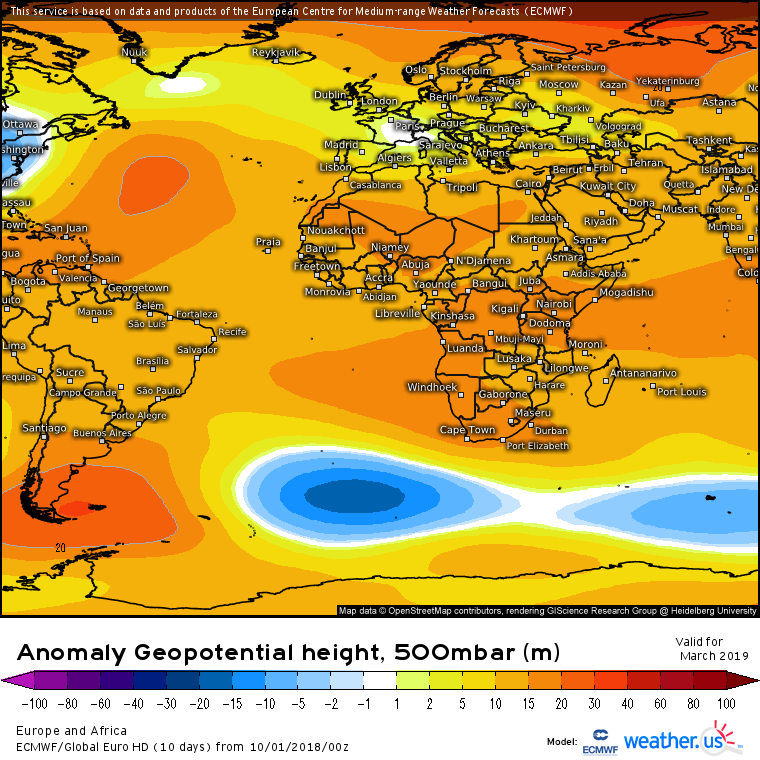
Its a free site. You can click around to get the area you want. This is Europe and Africa which does give you a good section of NAO domain.

-
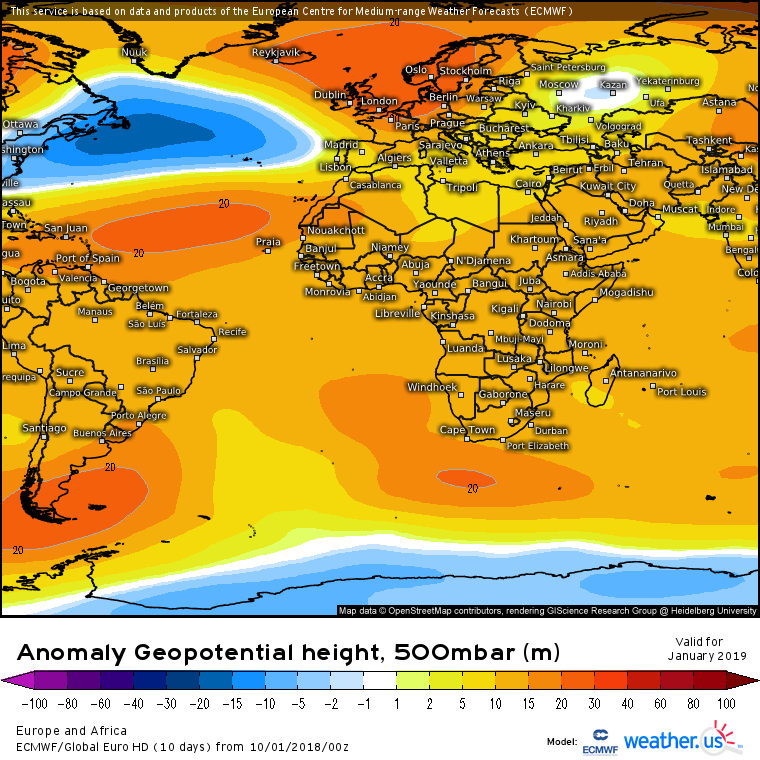
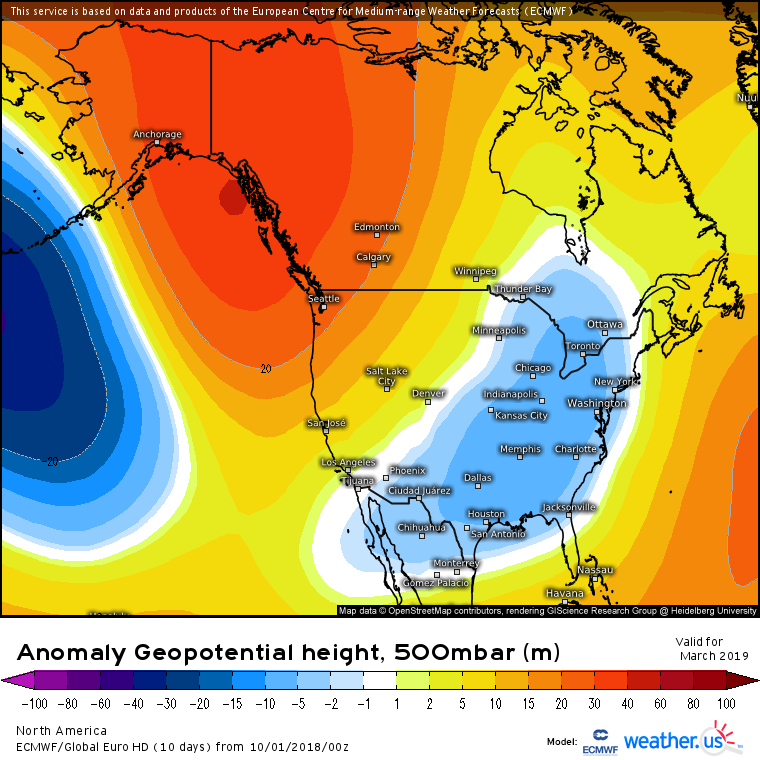
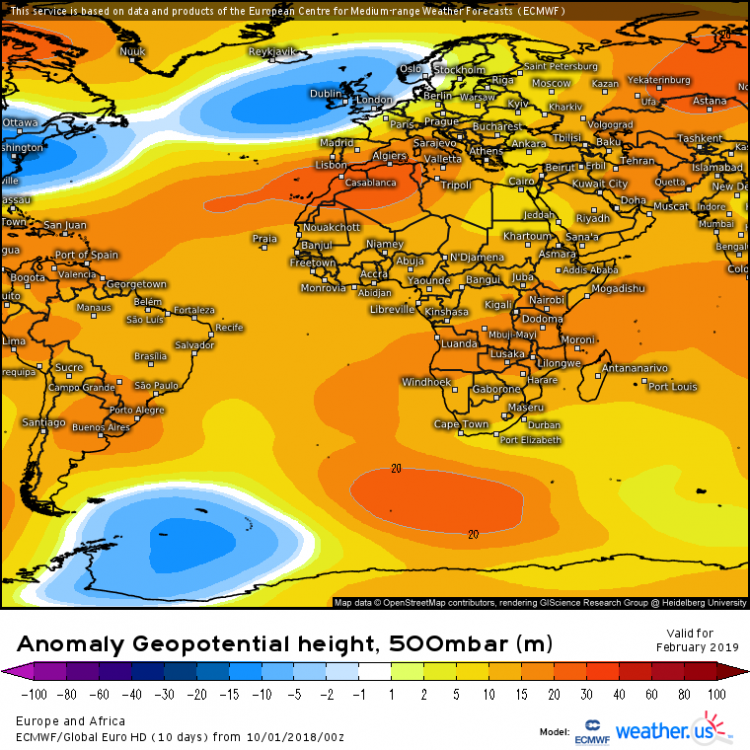
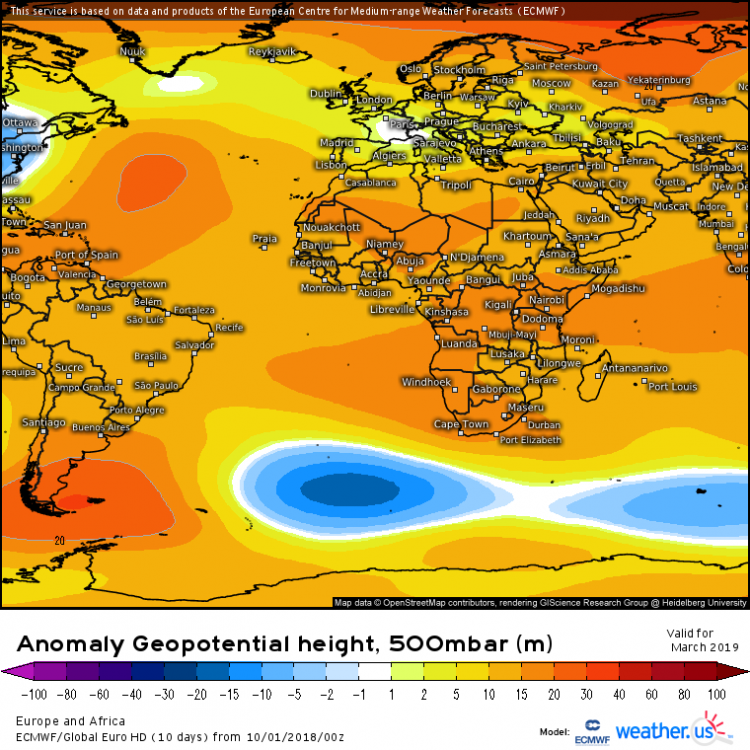
New ecmwf seasonal is out on weather.us looks pretty sexy for all id say. Above normal precipitation for the I 95 corridor aside Jan.
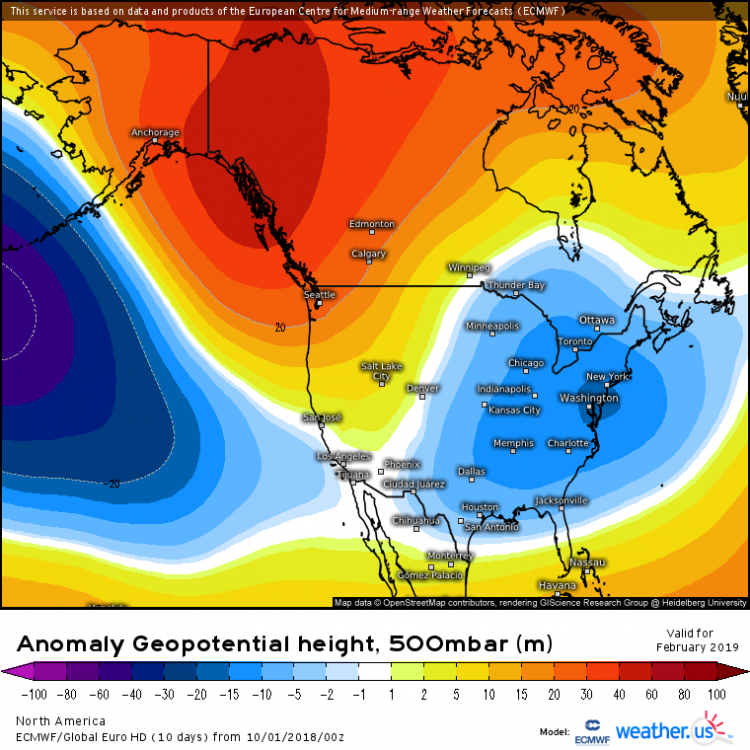


-
Yeah ukmet was definitely pretty nice


.png.e604a56644894b0ac97e99332e37aea1.png)