OSUmetstud
-
Posts
16,433 -
Joined
-
Last visited
Content Type
Profiles
Blogs
Forums
American Weather
Media Demo
Store
Gallery
Everything posted by OSUmetstud
-
raindance becomes rainstorm
-
August September NAO does have a correlation with Jan Feb (albeit weak). That's why I posted it yesterday.
-
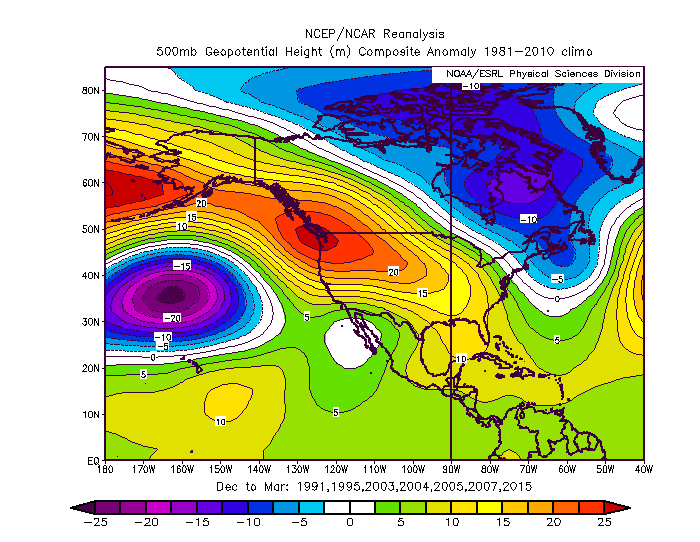
That plot looks pretty similar to the march forecast from September https://weather.us/monthly-charts/euro/north-america/anomaly-geopot-500hpa/20190301-0000z.html
-
Canadian seems to be the worst that. 500mb anomalies that def leads to cold weather and the 2m temps still looks torchy.
-
Weather.us updates on the 11th...probably have to wait until then. We get the NMME and the JMA on the 8th for your viewing pleasure.
-
You don't get to act like youre engaging in fruitful discussion all the while calling someone's method lazy. Plus it wasn't the only reasoning.
-
No I'm just starting there are valid reasons to find fault with any supposed analog year. Theres always going to be differences. You can throw out 94-95 and the neither thr 500mb height anomalies nor the surface temperature anomalies change much. I feel pretty confident on a DJFM positive NAO in the means...we've been in a 6 year impressive cycle with that as the CPC graph shows above. The main reason I didn't use the 60s and 70s is being I don't think there will be negative nao like then. I didnt go looking for an argument. I'm not any sort of long range expert. I'm just posting my thoughts, if you don't like them then so be it.
-
I think there's pretty good evidence of an overall positive NAO (it doesn't mean there can't be bouts of negative.) You can use similar rationale to throw out the blockbusters of the 60s and 70s Ninos given the difference of the atmosphere and climo. You can look at a season like maybe 86-87 or 94-95 to see evidence of lackluster Atlantic blocking during weak Ninos. I don't think any of us are experts on the subject per say...its mostly a stab in the dark.

-
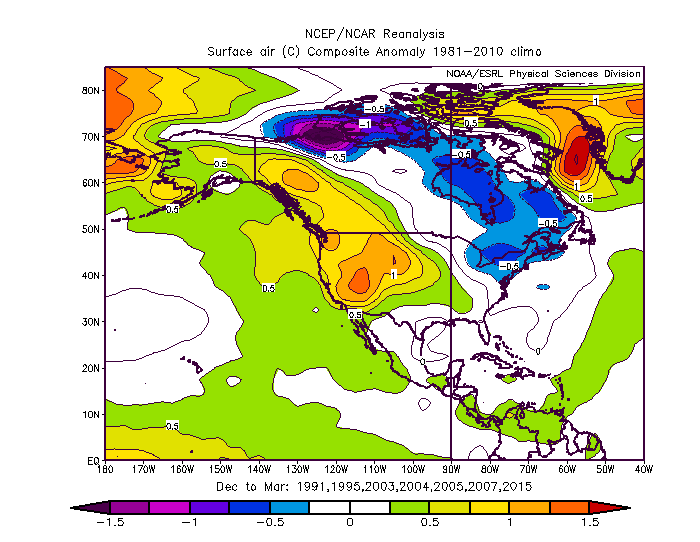
I'm going 90-91, 94-95, 02-03, 03-04, 04-05, 06-07, 14-15 for my winter analogs. I don't like anything with negative Naos in the means. Even so, there's a fairly large amount of variation across the data set from winter to winter. -Nick
-
North American snow cover was well above normal on Rutgers for September but Eurasia was closer to normal or even below.
-
Yeah I can see that. (Hopefully minus the central Atlantic ridge from hell.)
-
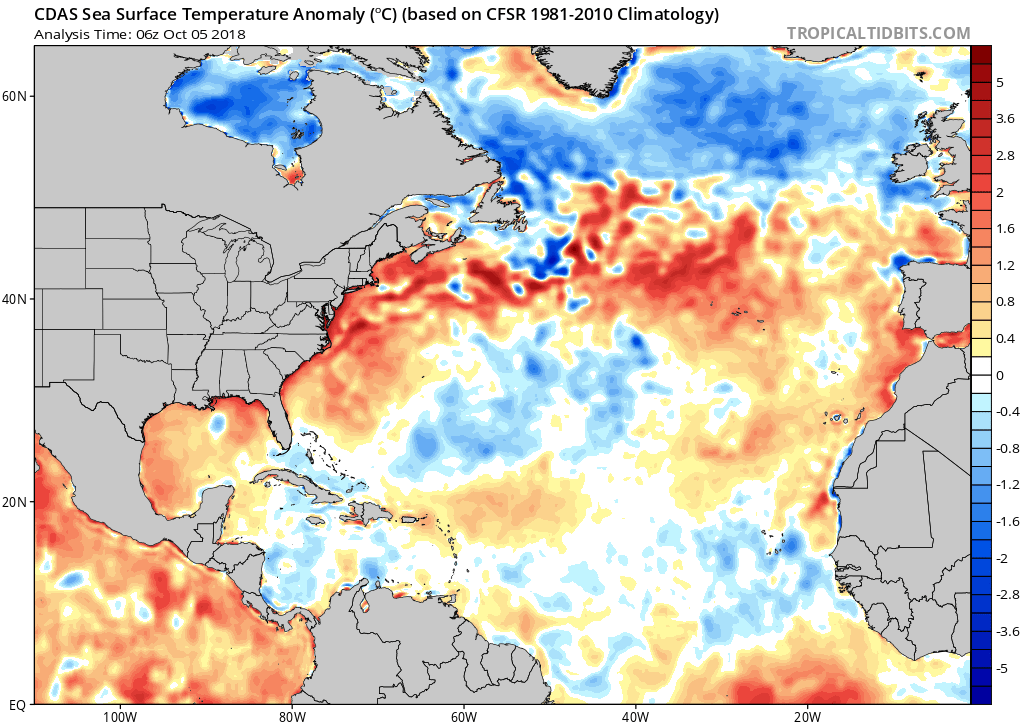
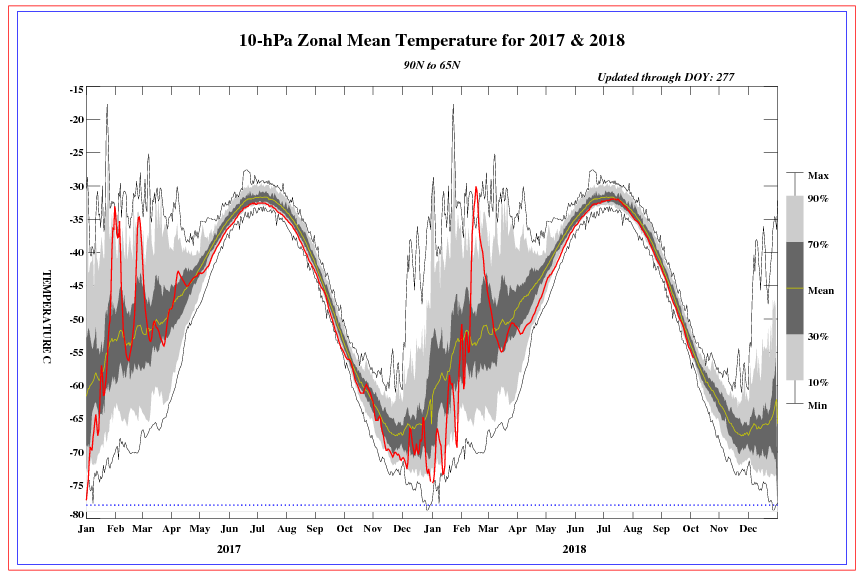
Any thoughts on the NAO? Its been so positive lately basically going back to 2011. The Atlantic SST distribution supports positive in the winter and the Strat temps are very cold from 1 to 10mb. El Nino and low solar support negative.
-
I was promised death and destruction!
-
Major Hurricane Florence: STORM MODE THREAD
OSUmetstud replied to stormtracker's topic in Tropical Headquarters
Bringing out the big guns. -
Major Hurricane Florence: STORM MODE THREAD
OSUmetstud replied to stormtracker's topic in Tropical Headquarters
The opposite is true actually -
Major Hurricane Florence: STORM MODE THREAD
OSUmetstud replied to stormtracker's topic in Tropical Headquarters
Could just bit instrument error (on the first or second dropsonde) I'm not sure what the standard accuracy is. -
Major Hurricane Florence: STORM MODE THREAD
OSUmetstud replied to stormtracker's topic in Tropical Headquarters
There's always a bit of parallax error on the SAT overlays. -
Major Hurricane Florence: STORM MODE THREAD
OSUmetstud replied to stormtracker's topic in Tropical Headquarters
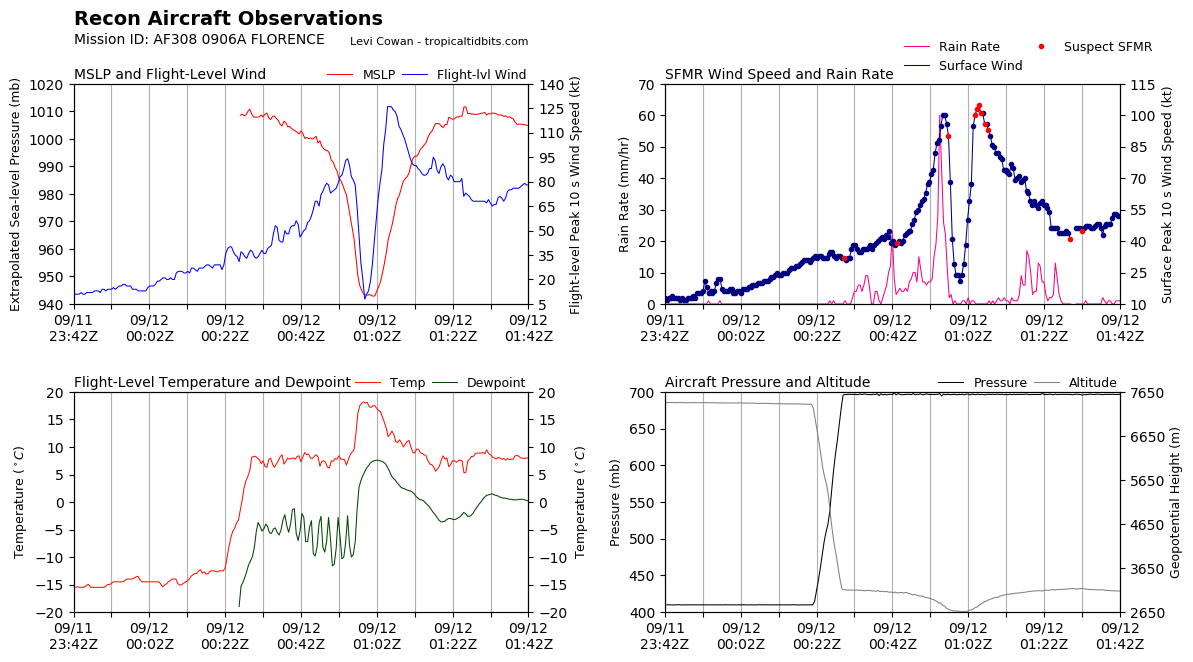
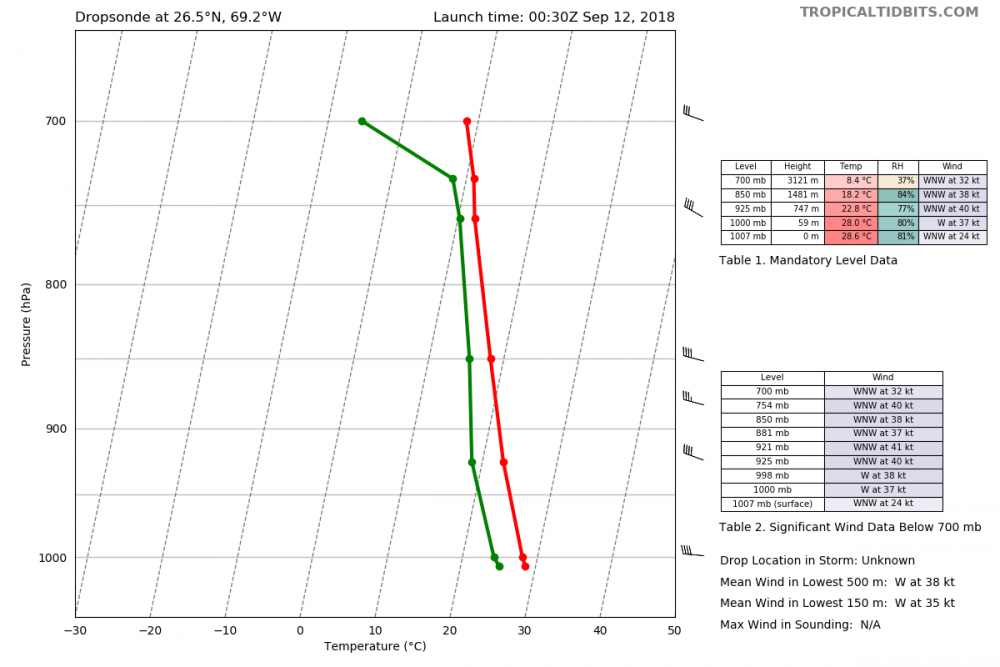
It was a 948mb dropsonde. The winds were around 10 kt. -
Major Hurricane Florence: STORM MODE THREAD
OSUmetstud replied to stormtracker's topic in Tropical Headquarters
Storm is very NE quad heavy. Flight level winds are barely hitting 100kts in the other quads. Not true surprising with solid forward motion currently. Looks pretty steady-state despite the improved appearance form last night. -
Major Hurricane Florence: STORM MODE THREAD
OSUmetstud replied to stormtracker's topic in Tropical Headquarters
It's all good -
Major Hurricane Florence: STORM MODE THREAD
OSUmetstud replied to stormtracker's topic in Tropical Headquarters
I wonder if the NHC will start to acknowledge the less than ideal environment. This storm is undergoing effects beyond the Erc. Im no expert but i l think it's been clear on satellite for much of the day. -
Major Hurricane Florence: STORM MODE THREAD
OSUmetstud replied to stormtracker's topic in Tropical Headquarters
I could see 110 kt for sure. But that's 3 lol. -
Major Hurricane Florence: STORM MODE THREAD
OSUmetstud replied to stormtracker's topic in Tropical Headquarters
Mean lowest 150 m wind doesn't support it. Maybe it's a gust. -
Major Hurricane Florence: STORM MODE THREAD
OSUmetstud replied to stormtracker's topic in Tropical Headquarters
Anyone notice that the whole SW quad had really large 700mb dewpoint depressions? 37 percent RH on the first dropsonde too.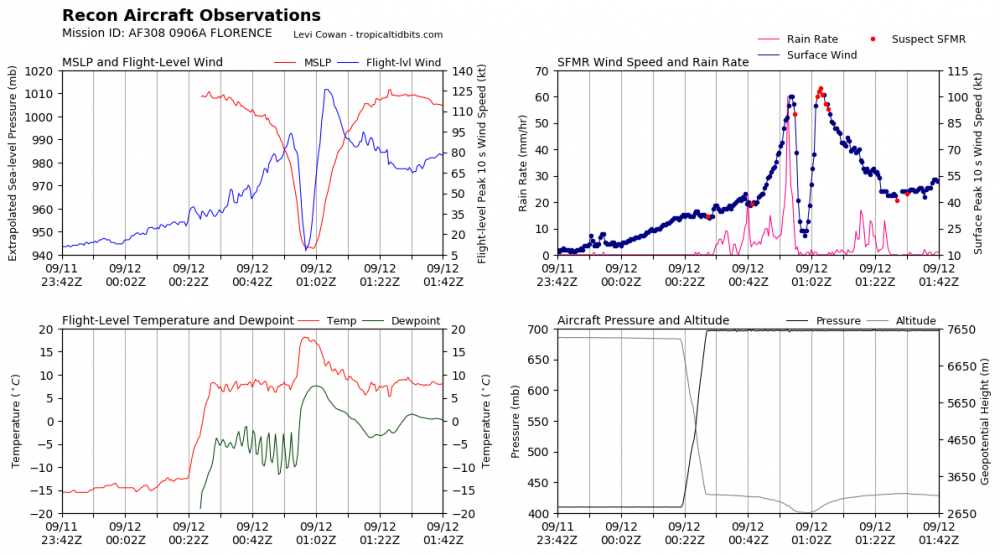
-
Gfs pressures are not trustworthy...if anyone wasn't aware.