OSUmetstud
-
Posts
16,433 -
Joined
-
Last visited
Content Type
Profiles
Blogs
Forums
American Weather
Media Demo
Store
Gallery
Everything posted by OSUmetstud
-
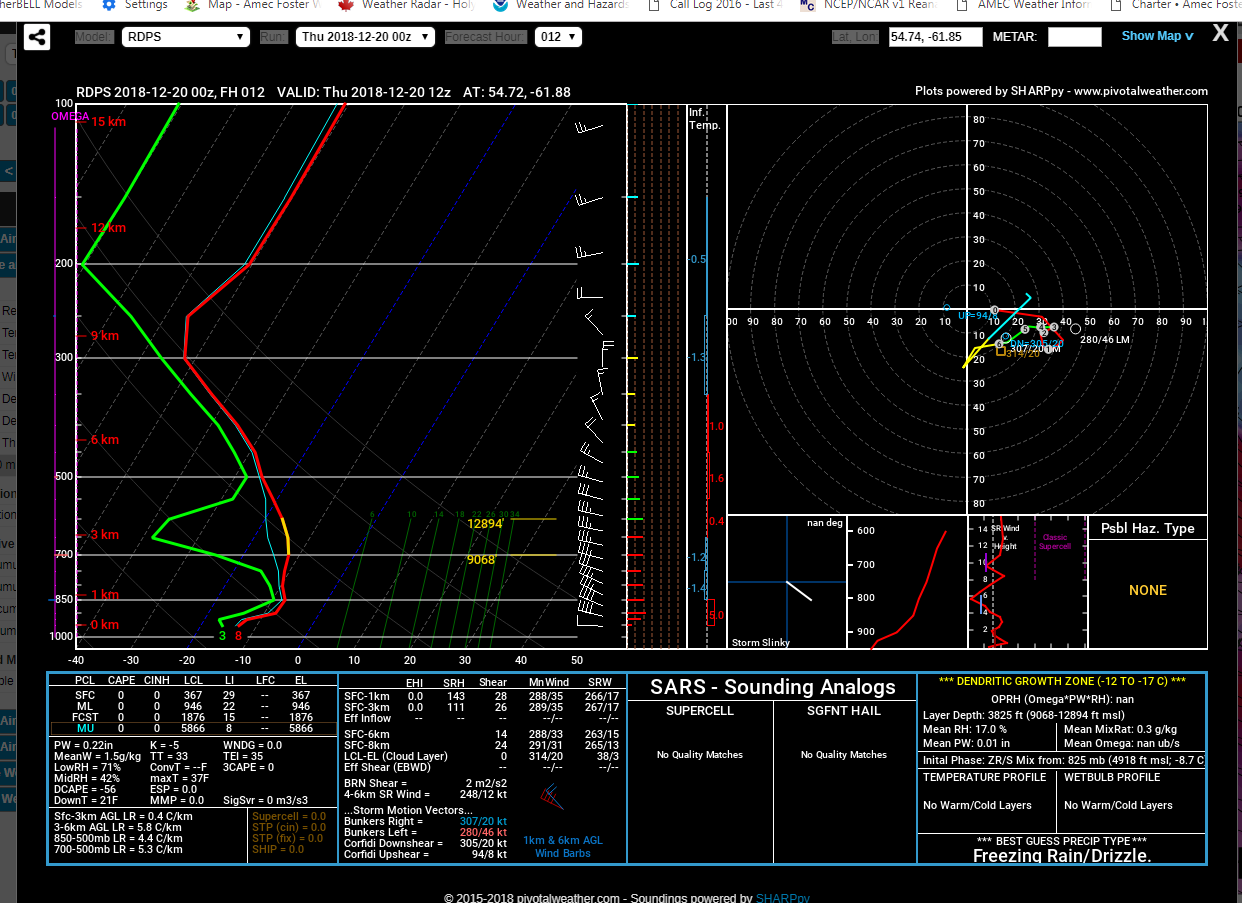
I dont know if you guys noticed, but pivotalweather now has soundings available for anywhere in north america for the rdps, nam, gfs, fv3 gfs, and GDPS. Pretty cool. GDPS and RDPS soundings have notoriously been hard to come by. http://www.pivotalweather.com/model.php?m=rdps&p=sfcwind_mslp&rh=2018122000&fh=12&r=ca_e&dpdt=&mc=

-
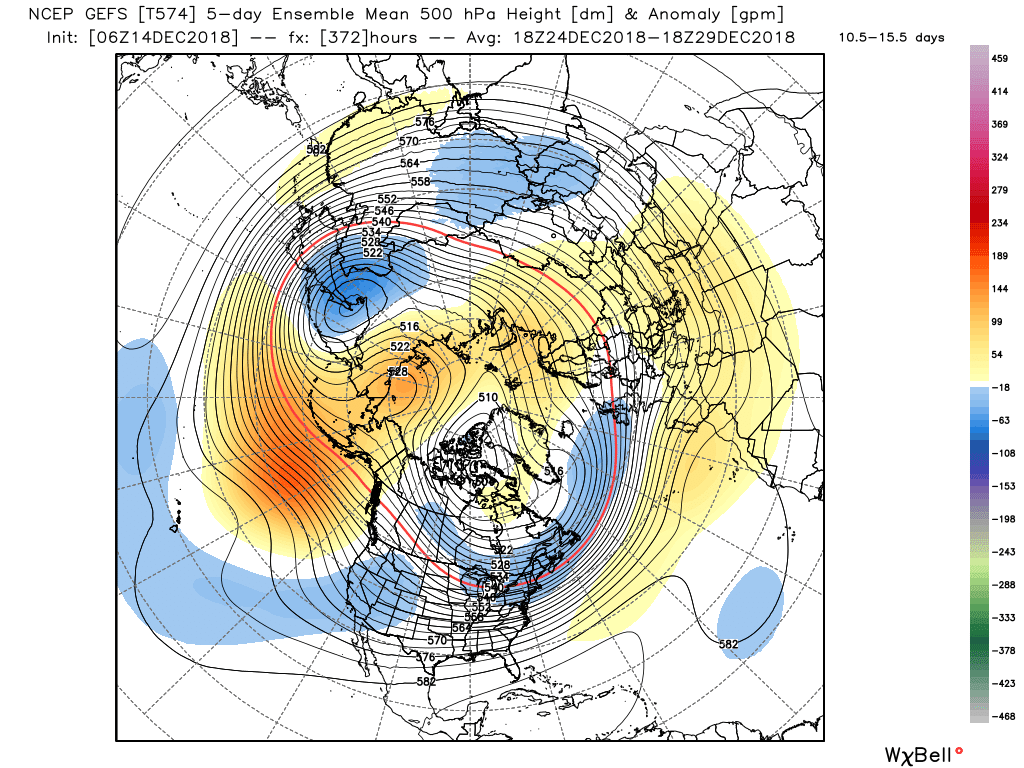
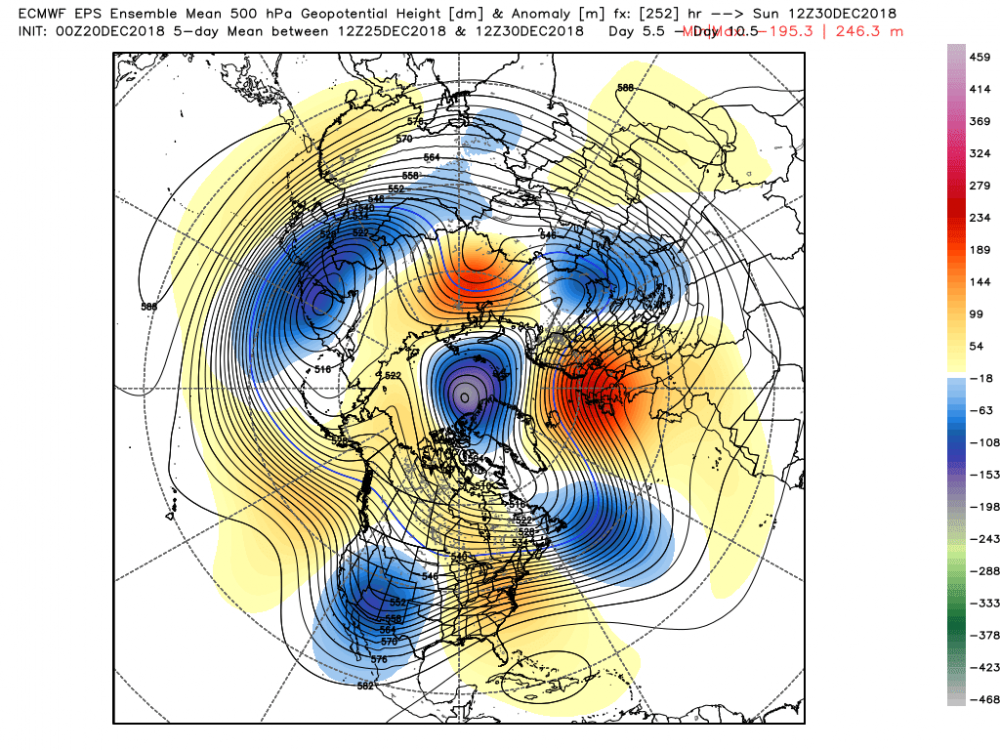
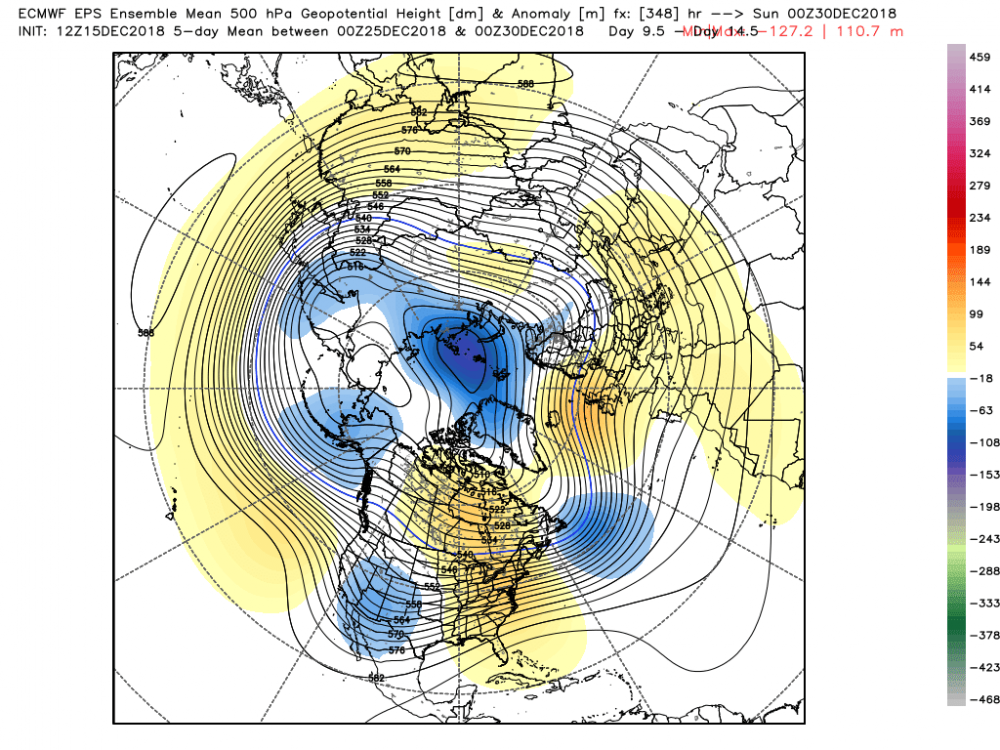
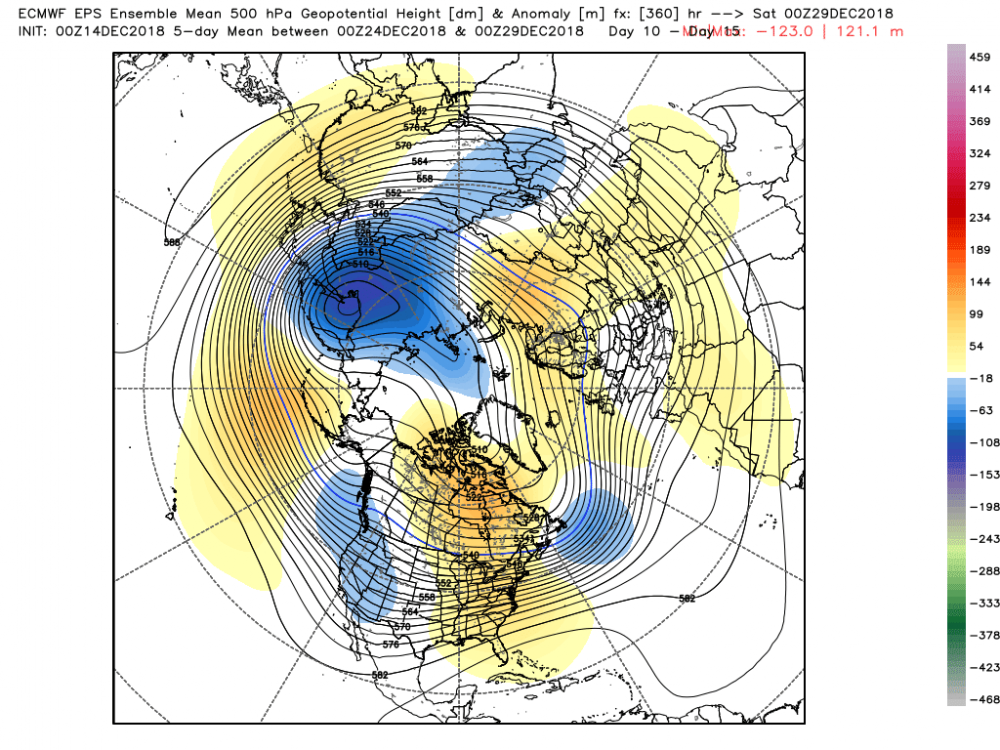
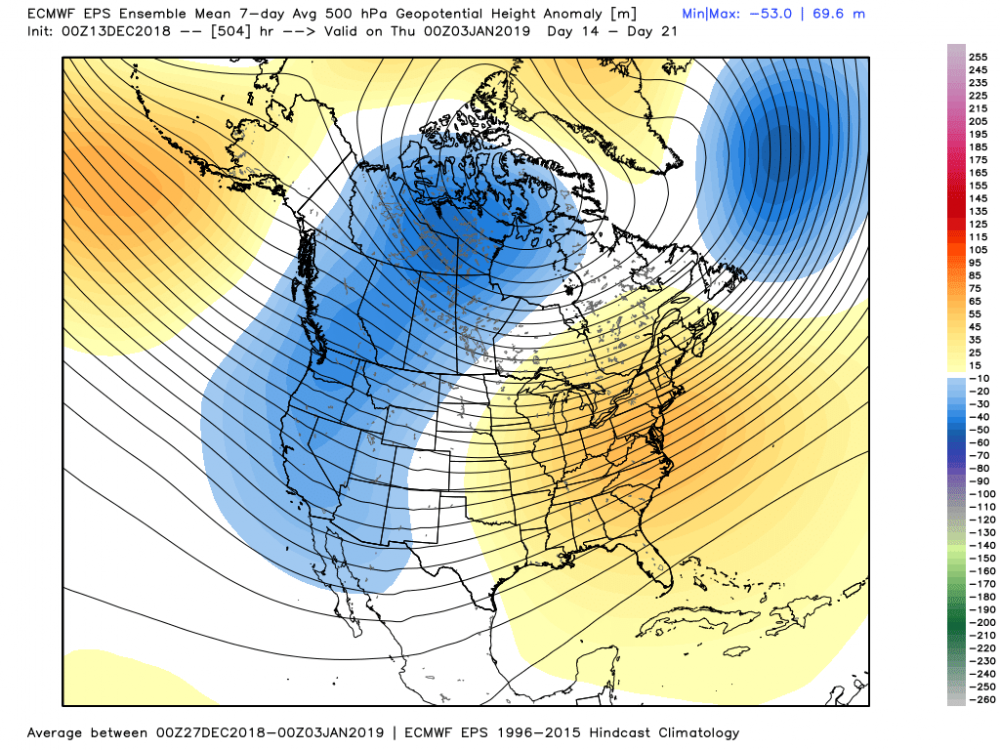
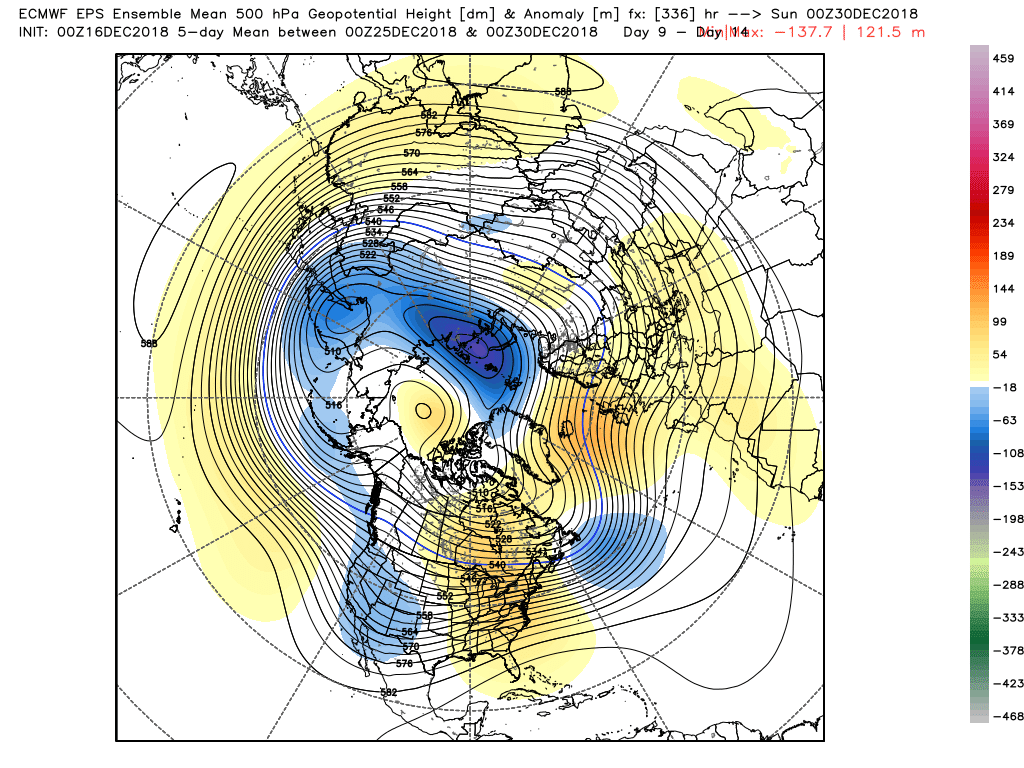
Idk, the -NAO looks fairly real to me on the 500mb charts, but its just east-based. The lower heights over Greenland may be hurting the calculation a bit.
-
Moncton NB managed 63.4 inches from jan 31st to Feb 2nd 1992. Really cool looking evolution.
.thumb.png.071d93aeb425484b1c0b103290211b7f.png)
-
I was wondering about those numbers on the wxbell site. Like have they derived some sort of model climatology for the snow being forecasted? Or is it just a thing that throws out number that we just accept to have meaning?
-
Weak-Moderate El Nino 2018-2019
OSUmetstud replied to AfewUniversesBelowNormal's topic in Weather Forecasting and Discussion
Any year can mimic another year for a little while. The hemispheric state is very different than 97 98. This Nino is pretty weak. That one was the strongest of all time by some measures. It was also the most east-based. Look at the GoAK trough so far in 97 98 compared to now. This is what happened the rest of the winter in 97 98. A very east based GoAK vortex flooding the US with PAC flow as a result of the strong east based Nino forcing. 12DEC2018 23.4 0.8 26.1 1.0 27.7 1.1 29.7 1.2 10DEC1997 26.7 4.2 28.7 3.6 29.2 2.7 29.4 0.9 Given these anomalies it seems pretty unlikely that Nino 1 2 will produce sustained tropical convection (greater than 26c) through the winter to force such an east PAC trough.
-
maybe you guys should start a fun panic room thread like they do in the MA.
-
for **** sake. It doesnt look good before christmas, have you looked at anything to make the judgement about afterwards?
-
ffs. you're in maine. The pattern looks pretty nice post-christmas.
-
EPS has now gotten a better the last two cycles from christmas onward, a bit less troughing in AK, slightly more negative east -NAO.

-
It torches Nain. Chuck is a joke.
-
You can the change on the Atlantic side. I think that could save the pattern into something pretty decent.
.thumb.png.80b20519ddcd1e44953ba7e8f980cf74.png)
.thumb.png.dbe7ca6a1f3ac18d49cff46875399c9a.png)
-
EPS looked a bit better on the Atlantic side with some east -NAO stuff with confluence south of Greenland.
-
None of this is true
-
The confluence being modeled isn't close to that period is what I'm getting at. Could change, of course.
-
Strong confluence over Greenland really helped that period.
-
eventually it will get into the more favorable phases again lol. Werent some of the more favorable looks when it dove into the circle of death?
-
There's a lot of datasets out there, so the SST data can be pretty confusing. The CPC data shows a decidely Nino-state. It's pretty weak as everyone knows, so I'm not sure we should be seeing some crazy departures anyway, right? 05DEC2018 23.1 0.8 26.2 1.1 27.6 1.0 29.7 1.2
-
the weekly data is like +1c in all regions and it has been for some time now.
-
Versus this.

-
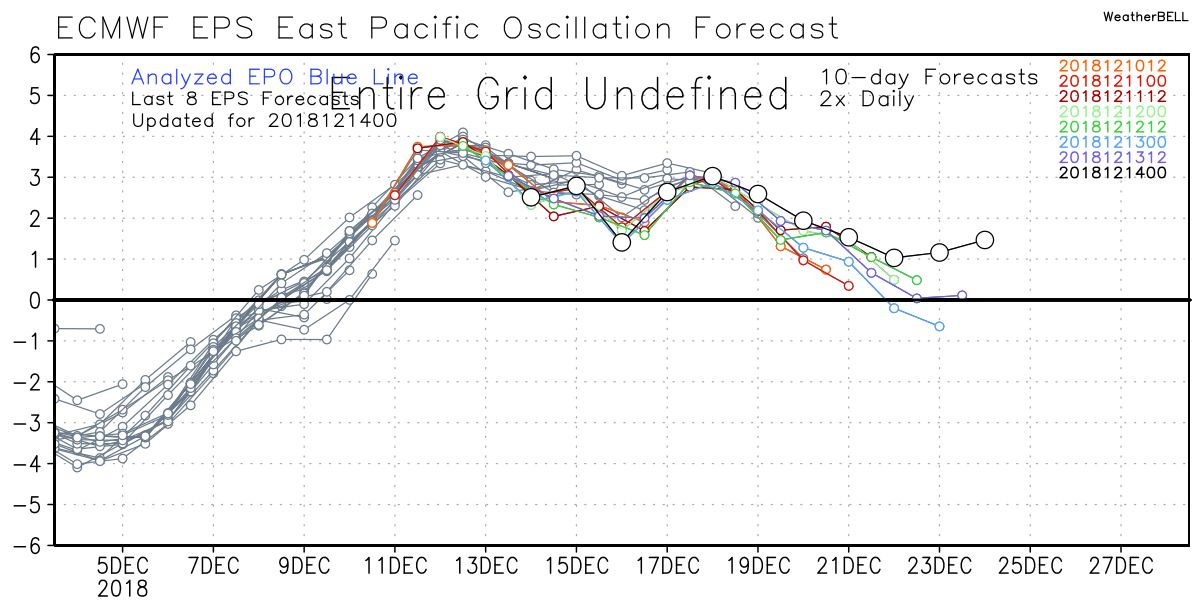
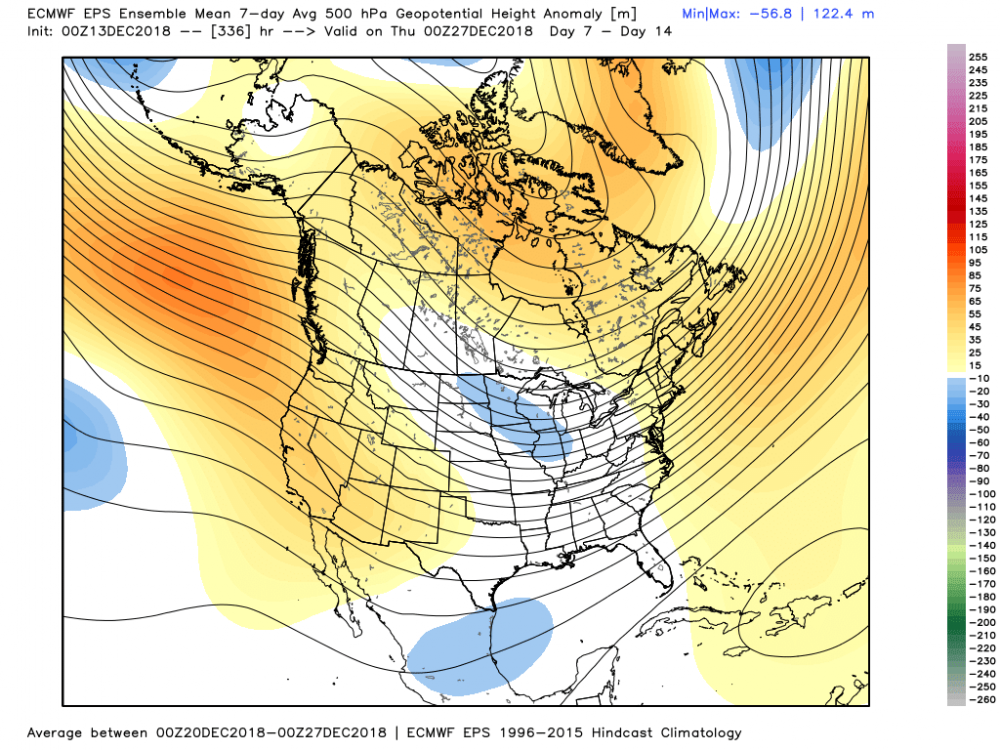
The eps doesn't have an -EPO from what I can see. You have any thought on that?

-
You haven't added a single substantive post since you joined here as a "newb." Maybe try to add something instead of only trolling and being an ass?
-
The EPO ridging is better on the gefs than the eps. 11 to 15 is a lot colder on the gefs than the eps because of this.
-
No probably not.
-
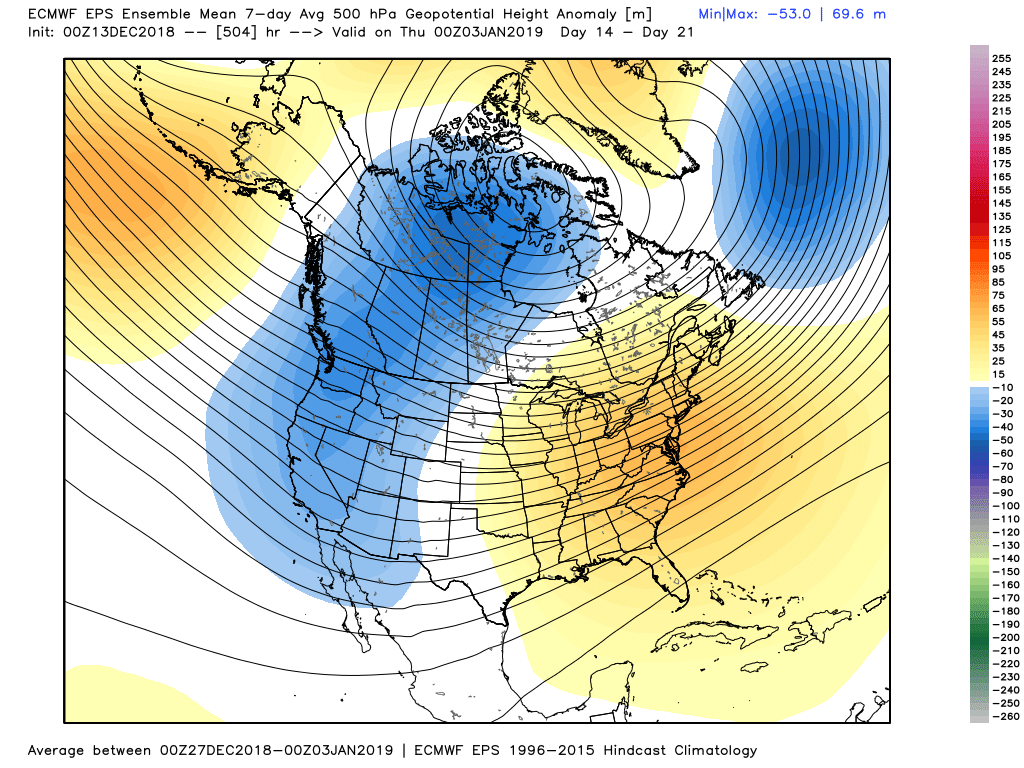
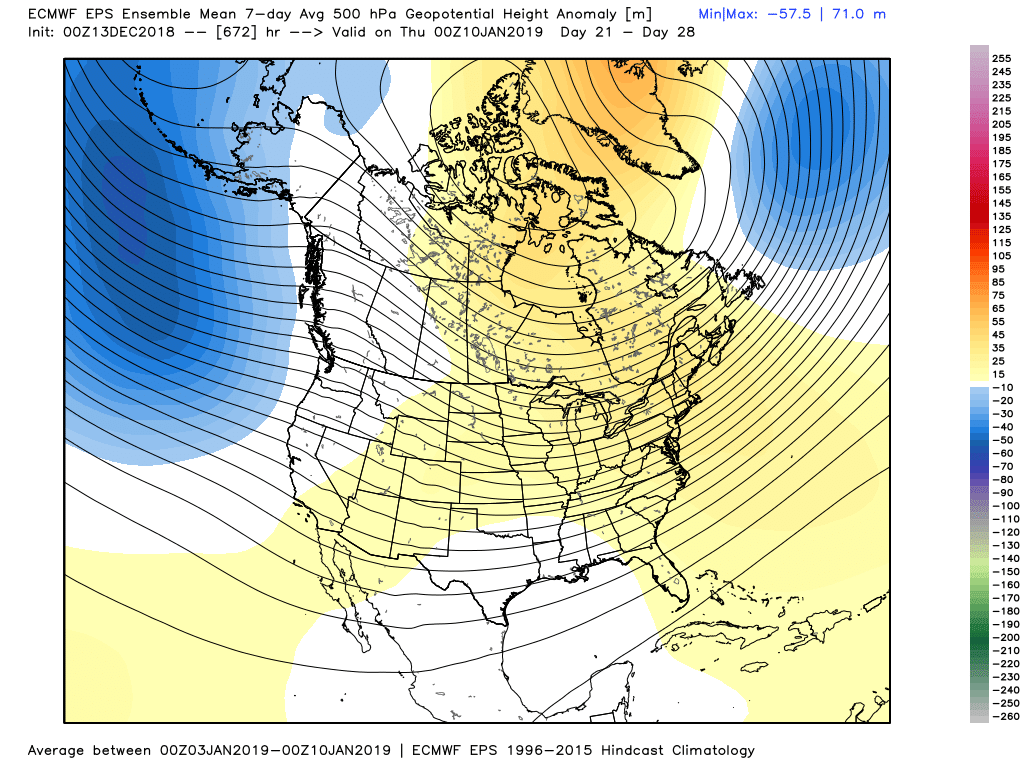
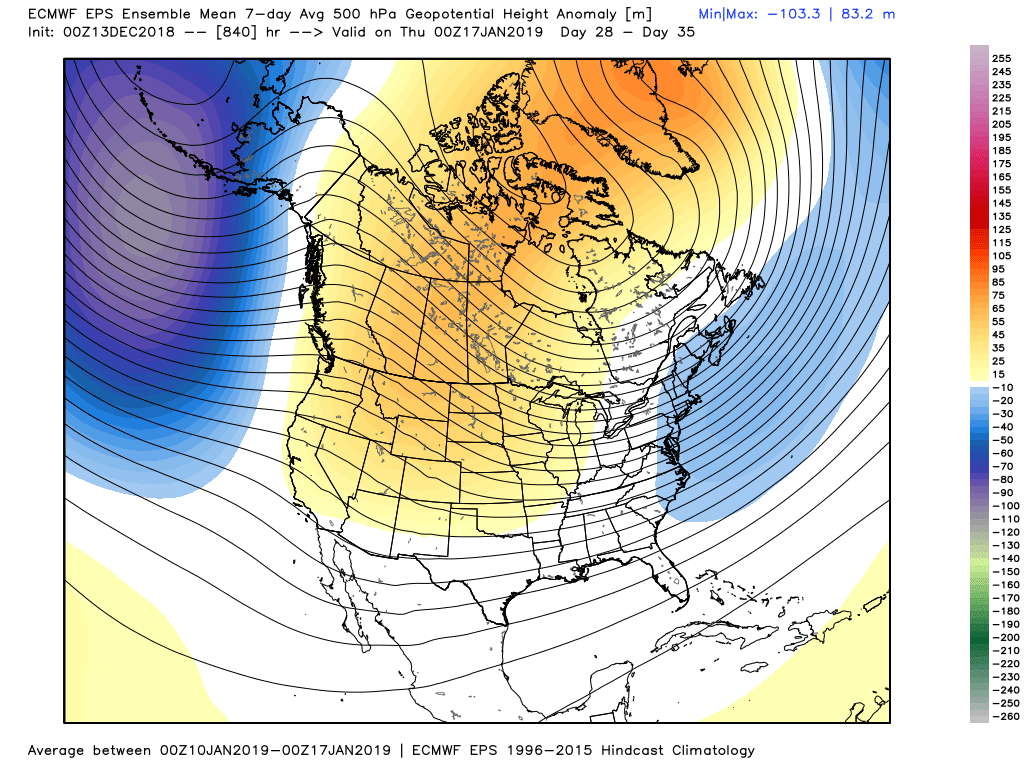
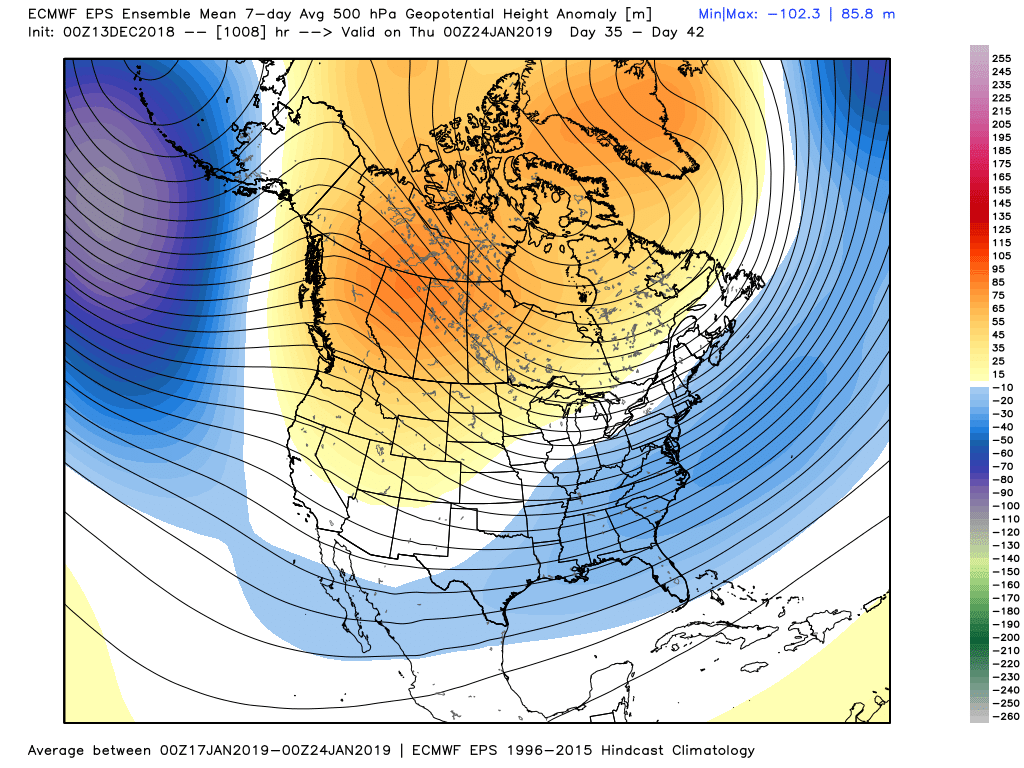
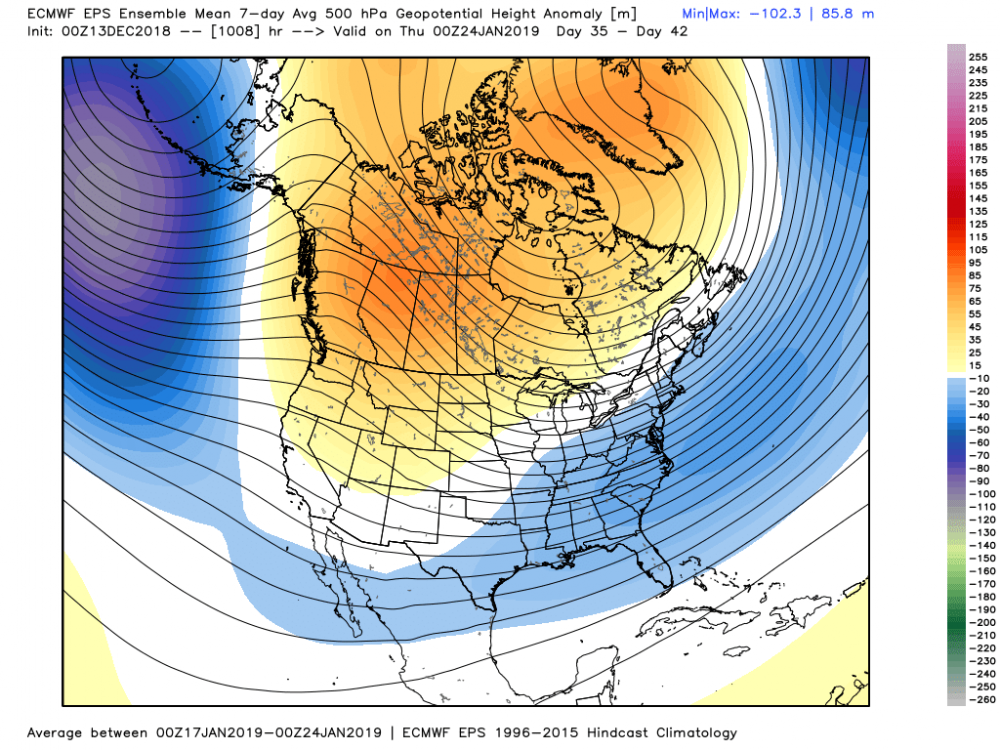
The 850s and 2m are warmer than normal until the day 39 to 46 frame. The gradient look is a bit meager since the ridging in ak/-epo isnt pronounced. The weak -nao as shown could save the pattern without super chilly air in Canada.
-


.png.204e835ee810eab6f53d8b33306e6e98.png)

.png.ad8fb0697546fd43e25701f1841463b4.png)
.png.f2611bfe41070facd006c06c457c8527.png)