

Roger Smith
-
Posts
5,927 -
Joined
-
Last visited
Content Type
Profiles
Blogs
Forums
American Weather
Media Demo
Store
Gallery
Everything posted by Roger Smith
-
The Arpege has a fairly good reputation in Europe and often tips what the later EURO (ECM) will do, so if it's looking good at this point that's a good sign. I have the feeling that the GFS is out on a limb and the interaction of the significant upper trough with anomalous warm water will seal the deal. Think the odds are 3:1 for a big storm for most of NE.
-
January 28-29, 2022 Miller abcdefu Storm Threat
Roger Smith replied to WxUSAF's topic in Mid Atlantic
GEM looks fairly similar to NAM, a big hit for the coastal regions, some snow back to west of DC, probably in the 3-6" range for DC, 6-8" BAL, 10-20" DMV. Can't see all this energy interacting with the warm water to produce a GFS result, seems to ignore the development at 500 mb. If there were extra upper air obs they weren't plotted on the 00z CMC maps by the way. In the past when I've heard about these extra obs, they show up in the investigation zone on the maps. I think if the ECM is not a clone of the GFS then the GFS will have to be taken as dubious guidance, if ECM looks like GFS then we wait for a decision tomorrow. -
January 28-29, 2022 Miller abcdefu Storm Threat
Roger Smith replied to WxUSAF's topic in Mid Atlantic
It's creating a March 1980 seVA blizzard scenario. Not sure if I buy it, but verbatim this gives most of the Delmarva 2-3 feet of snow, rapid decrease west of the Bay. Small changes in this would mean large changes in snow, but this run is just a stall and deepen special. Imagine it wanders off towards Cape Cod eventually. -
January 28-29, 2022 Miller abcdefu Storm Threat
Roger Smith replied to WxUSAF's topic in Mid Atlantic
Light to moderate snow in parts of OK, close to the developing 500 mb trough. Some energy is trying to get going, just an inverted trough feature for now. No sign of warm advection anywhere west of FL. -
January 28-29, 2022 Miller abcdefu Storm Threat
Roger Smith replied to WxUSAF's topic in Mid Atlantic
What is snow? -
January 28-29, 2022 Miller abcdefu Storm Threat
Roger Smith replied to WxUSAF's topic in Mid Atlantic
My theory is that it snowed in 1888 because they didn't have weather models. Change my mind. -
January 28-29, 2022 Miller abcdefu Storm Threat
Roger Smith replied to WxUSAF's topic in Mid Atlantic
Beyond that line I am in charge, don't go there. I think he left out F Here be Dragons -
January 28-29, 2022 Miller abcdefu Storm Threat
Roger Smith replied to WxUSAF's topic in Mid Atlantic
At the end of the day, the weather can let us down, just like politics or life in general, but then we have this: so to the GFS, the Euro, the GEM, NAM and the rest I say Beethoven, Mozart, Bach, Schubert and Mendelsohn ... deal with it. Fix up your craft and reach the stars. -
January 28-29, 2022 Miller abcdefu Storm Threat
Roger Smith replied to WxUSAF's topic in Mid Atlantic
One reason for optimism is that the last storm shifted west relative to much of the guidance and NAM had a better handle on that. So if the same thing happens this time, it's a better outcome than many of these recent model runs would have you believe. I still think that very warm Atlantic is going to play a role and that has to be a factor in favor of a coastward shift. -
Predict the temperature anomalies (F deg) relative to 1991-2020 normal values for DCA _ NYC _ BOS __ ORD _ ATL _ IAH ___ DEN _ PHX _ SEA Contest deadline before late penalties 06z Tuesday Feb 1st 2022.
-
There's a 1012 mb low in south central NM. Nothing but E-NE winds ahead of it. That is probably a good sign. And wasn't the NAM the best model for the last storm that ended up going a lot further west than many other models were saying it would? Bet the Euro comes in with another rocking solution tonight. That warm Atlantic water is just sitting there waiting for its time to do battle. It argues for a west solution, tuck, and stall potential. http://www.spc.noaa.gov/exper/mesoanalysis/s15/sfcmap.pdf
-
January 28-29, 2022 Miller abcdefu Storm Threat
Roger Smith replied to WxUSAF's topic in Mid Atlantic
GGEM snow potential is moderate rather than heavy, but better than GFS. Would say 3-6" DCA, 6-8" BWI-PHL on GGEM. 10-15" NYC and 20-30" New England. It is not a blockbuster storm but solid. However if the Euro-NAM blend proves more accurate then I would double most of those numbers (30-40" NE). -
January 28-29, 2022 Miller abcdefu Storm Threat
Roger Smith replied to WxUSAF's topic in Mid Atlantic
GGEM looks better though. Not following the GFS but closer to the NAM. -
January 28-29, 2022 Miller abcdefu Storm Threat
Roger Smith replied to WxUSAF's topic in Mid Atlantic
You would think with all those submarines the Germans would know about the warm water off the coast? This is why I think the storm will ride as far west as possible, the thermocline. I must hide now. -
no more hot dogs for me since that run.
-
Just amazed at the potential from this storm if it follows the GEM evolution, that much rapid deepening with very cold air interacting with anomalously warm ocean temperatures suggests some very high snowfall totals are possible, perhaps March 1888 needs to be considered as part of analogue set (if there is an outcome like these model runs are suggesting). Think also there was a storm March 1-2 1914 that combined very low pressures, strong winds and heavy snow. That one from historical weather maps was a bit closer to NYC than the track of the Blizzard of 1888. My first call on this would be 18-24 inches NYC metro, 24-48 inches Long Island and parts of CT, 12-18 n NJ. Wind gusts 70-90 mph seem possible. This could create emergency situation for much of the region and most of New England. Still time for models to change but I see the nucleus of the storm already over UT, CO and WY.
-
Late January and February Medium/Long Range Discussion
Roger Smith replied to WinterWxLuvr's topic in Mid Atlantic
It snowed at TLH in the formative stages of the Blizzard of 1899 so that Florida snow is not a bad sign. The only other snow I can recall in FL was in Jan 1977 during an epic cold spell. That being said, I could see this evolution changing run to run for quite some time, none of these moving parts look set, but there is plenty of cold air available and a recent history of deep upper lows tracking through the southeast, so given peak climo and the land-ocean gradient likely to exist, why not this sort of result? -
Late January and February Medium/Long Range Discussion
Roger Smith replied to WinterWxLuvr's topic in Mid Atlantic
Just about 250 years after the Washington-Jefferson storm and 100 years after the Knickerbocker.- 4,130 replies
-
- 4
-

-
- prime climo
- cold canada
- (and 1 more)
-
Mid-Atlantic winter 2021-22 snowfall contest
Roger Smith replied to AnEndlessMaze's topic in Mid Atlantic
If that 18z GFS is onto something, we have a long way to go yet. -
Since you have already compared the DCA data to other U.S. locations I won't bother to crunch the numbers for NYC then. Just thinking about any possible cause for this, especially as it clearly was not a component of the climate before 1980. (it may have been for some interval in the past, will check on that). Also it seems to transfer across the Atlantic or occurs almost simultaneously on both sides of the Atlantic. That would point to an external source, if it were a teleconnection, you would expect a lag of several days. The slightly earlier pulse at Toronto is probably due to that city being further west and the effect likely has to do with waves coming in from the Pacific, so the direction of travel of these signals may be WNW-ESE. Perhaps there is a sympathetic response wave in the eastern Atlantic. I have noted in some of my research that a spike in temperatures in eastern North America often appears either simultaneously or within 3-5 days in the British weather data. There are numerous (non-random in frequency) examples of similar dates of warm and cold records. But it is not a guaranteed 1:1 relationship. For example, the 1936 heat wave in North America never showed any sign of transferring across the Atlantic at all. If it is an external signal, the only plausible place to look would be in the Sun-galaxy interactions. A solar-planetary tidal phenomenon, while plausible for rotating sectors of about this magnitude, would not stay centered on any given part of the calendar year. A Sun-galaxy interaction would do so. January 12-13 is roughly two weeks after the Sun has crossed the galactic equator and there does seem to be a bit of a temperature spike in late December, but what would cause a two week lag for this? Possibly it has some effect on the Pacific circulation which takes some time to organize a response to send downstream. It seems like a process like that should be more spread out at random over 2-3 weeks however. Anyway, continuing to think about this. Something happens in this recent era that did not happen routinely in the past. As you say, it is getting beyond the bounds of being "one of those things" that statistical variability can produce, and more towards a semi-permanent feature.
-
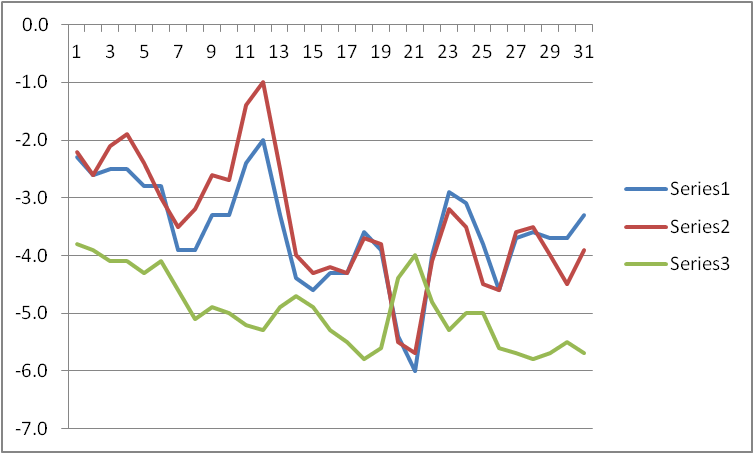
This is the same graph as above, with the 1840-1980 averages added. Of course that interval was generally a bit colder too due to climate change and urban heat island growth. However, the trends are much different with respect to the 12th spike in temperature: MEAN DAILY TEMPS (TORONTO CITY) red _ 1991-2021 ... blue _ 1981-2021 ... green _ 1840-1980 ... note that the 1840-1980 temperatures show basically a gradual decline interrupted by the "January thaw" signal.
-
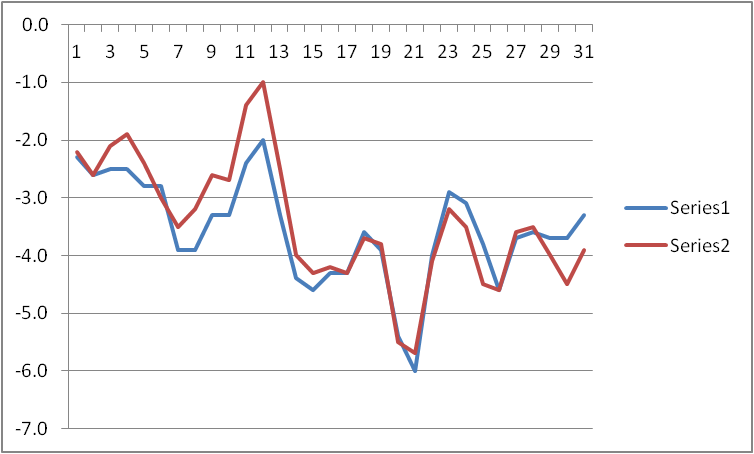
In the Central England Temperature data, the period 12th to 14th Jan has become milder in recent decades while the 19th to 21st have become colder. For 1991-2020 averages, the 12th-14th were 5.2 C, 5.4 C and 5.2 C then the coldest day of the month is the 22nd (3.9 C). This is similar although less amplified than the signal you found. However for 1981-2010 the warmest interval was 19th-21st. This has disappeared from the data, and since the two intervals have twenty shared years (1991-2010), the differential represents a shift from the 1980s to the 2010s. This also seems in line with your findings if not directly overlapping them. For Toronto, which has data from 1840 to present, I found that averages in January followed a similar trend to what you've described. Will post this and edit in a graph as it's on a different device. This is a graph of mean daily temps (in C) for Toronto for both 1981-2021 and 1991-2021. It can be seen that there is a spike in mean temperature around the 12th, and considerably lower values around the 21st. So this phenomenon is not confined to DCA. I would expect that I will find it also in the NYC data that I have (looking at that next). Will speculate on a cause after thinking about it for a while. This 12th to 21st drop in mean temperature does not show up very prominently before 1980 and there was a "January thaw" signal in earlier decades that has a remnant in that smaller spike around the 23rd.
-
I will look at some of my data sets to see what happens at other locations in this time frame. Did you spot any other similar anomalies during the rest of the year? I will post my findings in a few minutes, I already have the averages available for various periods, just need to check them.
-
January 2022 temperature forecast contest
Roger Smith replied to Roger Smith's topic in Weather Forecasting and Discussion
Final scoring for January 2022 Scoring in this table is based on final anomalies as shown. FORECASTER ____________DCA_NYC_BOS__east__ORD_ATL_IAH__cent_ c/e__DEN_PHX_SEA__west___ TOTAL Confirmed anomalies ___ -2.9 _-3.4 _-2.5 _______-4.6 _-0.3 _-1.0 ___________ -0.8 _+0.9 _-1.8 wxdude64 _______________ 58 _ 58 _ 92 __ 208 __ 62 _100_ 64__ 226 __ 434 __ 76 _ 84 _ 88 __ 248 ____ 682 Stormchaser Chuck ______ 92 _ 92 _80 __264 __ 58 _ 86 _ 80 __ 224 __ 488 __ 94 _ 68 _ 24 __ 186 ____ 674 wxallannj _________________54 _ 46 _ 66 __ 166 __ 52 _ 86 _ 68 __ 206 __ 372 __ 98 _ 88 _ 92 __ 278 ____ 650 so_whats_happening _____52 _ 44 _ 68 __ 164 __ 70 _ 82 _ 56 __ 208 __ 372 __ 88 _ 90 _100 __ 278 ____ 650 Tom ______________________40 _ 26 _ 42 __ 108 __ 46 _ 84 _ 98 __ 228 __ 336 __ 94 _ 96 _ 46 __ 236 ____ 572 hudsonvalley21 __________ 36 _ 30 _ 50 __ 116 ___64 _ 64 _ 38 __ 166 ___282 __ 98 _ 92 _ 88 __ 278 ____ 560 ____ Consensus __________ 36 _ 28 _ 46 __ 110 ___52 _ 72 _ 44 __ 168 __ 278 __ 94 _ 88 _ 82 __ 264 ____ 542 _____ Normal _____________ 42 _ 32 _ 50 __ 124 __ 08 _ 94 _ 80 __ 182 __ 306 __ 84 _ 82 _ 64 __ 230 ____ 536 BKViking _________________ 20 _ 14 _ 34 __ 068 __ 40 _ 70 _ 24 __ 134 __202 __ 98 _ 88 _ 70 __ 256 ____ 458 Roger Smith ______________36 _ 30 _ 40 __ 106 __ 28 _ 70 _ 30 __ 128 __ 234 __ 54 _ 70 _ 78 __ 202 ____ 436 DonSutherland1 __________ 30 _ 24 _ 52 __ 106 __ 60 _ 34 _ 30 __ 124 __ 230 __ 94 _ 76 _ 36 __ 206 ____ 436 RodneyS _________________ 22 _ 02 _ 22 __ 046 __ 18 _ 64 _ 40 __ 122 ___168 __ 86 _ 84 _ 94 __ 264 ____ 432 Scotty Lightning _________ 22 _ 12 _ 40 __ 074 __ 00 _ 64 _ 50 __ 114 ___ 188 __ 74 _ 92 _ 74 ___240 ____ 428 RJay _____________________ 22 _ 12 _ 30 __ 064 __ 38 _ 74 _ 20 __ 132 ___ 196 __ 84 _ 68 _ 64 __ 216 ____ 412 =========================================== EXTREME FORECAST REPORT _ DCA (-2.9) and NYC (-3.4) are wins for Stormchaser Chuck with lowest forecasts (-2.5, -3.0). _ BOS (-2.5) has ended up with a win for wxdude64 (-2.1) and a loss for Stormchaser Chuck (-3.5). _ ORD (-4.6) is confirmed to be a win for so_whats_happening (-3.1) with low forecast. _ ATL (-0.3) does not qualify as fourth coldest forecast has highest score. _ IAH (-1.0) is a win for Tom with coldest forecast (-0.9). _ DEN (-0.8) did not qualify with third and fourth coldest forecasts tied for highest scores. _ PHX (+0.9) did not qualify with fifth coldest forecast the highest score. _ SEA (-1.8) did not qualify for an extreme forecast as fourth coldest forecast is the highest score. Scoring summary after one month __ Stormchaser Chuck___ 2-1 so_whats_happening__ 1-0 Tom __________________ 1-0 wxdude64 ____________ 1-0 Five locations qualified for coldest and none for warmest. Best forecasts will appear in tabulated format next month You can check them in the scoring table (bold highlighted). Congrats to wxdude64 with top score for January. -
Thursday 1/20/22 Stat Padder Discussion and Observations
Roger Smith replied to stormtracker's topic in Mid Atlantic
Could over-perform, lots of cold air ready to undercut, good rates likely (12-15 : 1 ?), absence of actual low pressure may be putting some off, but 3-4" potential for all three airports and 5" locally southeast MD and parts of se VA. The trend is your friend.


