michsnowfreak
-
Posts
17,987 -
Joined
-
Last visited
Content Type
Profiles
Blogs
Forums
American Weather
Media Demo
Store
Gallery
Everything posted by michsnowfreak
-
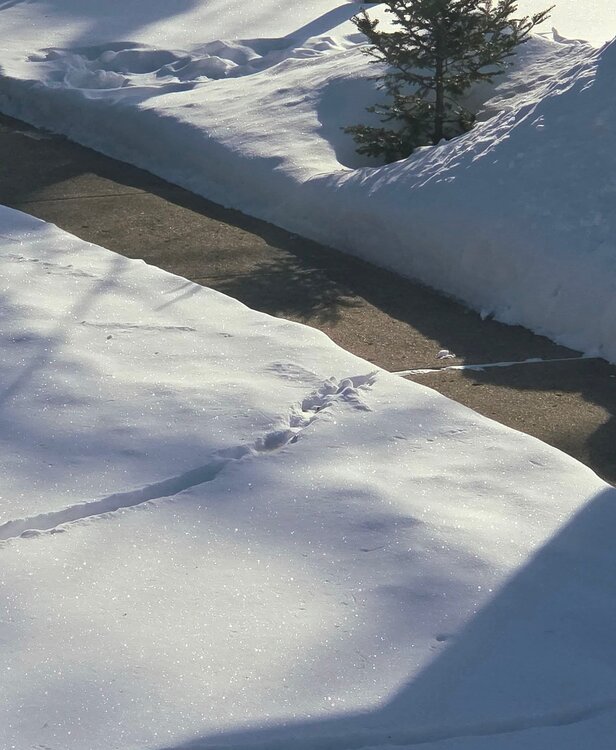
Cloudy all day but the sun was out first thing in the morning, making the snow glisten.
-

Winter 2025-26 Medium/Long Range Discussion
michsnowfreak replied to michsnowfreak's topic in Lakes/Ohio Valley
Deep cold definitely eroding but per the weeklies the persistent warmth looks to remain in the west. Since Thanksgiving, except for 2 brief thaws, we have been treated to a continuous fresh, clean and glistening snow blanket (none of that hoping the torch passes to preseve a crusty pack) with nonstop cold. Feels like a Winnipeg winter. But whats been lacking locally is a real big storm (biggest was 6.2"). With the eroding of the deep cold and the getting to that time of year when real dynamic late winter/early spring storms can develop, its the transition from deep winter to gambling time. More risk, more reward type. Might as well buckle up, what have we got to lose? -
2025-2026 ENSO
michsnowfreak replied to 40/70 Benchmark's topic in Weather Forecasting and Discussion
Excellent point. We all know the west is having a record warm winter. In fact, I have never, EVER seen the west get as much attention on this forum as it has during this very cold Great Lakes/northeast winter. But lets not forget the basics - outside of some extreme years, the common rule of thumb is west warm/east cool and vice versa. Its the very common result of ridging and troughing. Personally, I am not looking forward to the false spring but I have a hope. Since Thanksgiving, except for 2 brief thaws, we have been treated to a continuous fresh, clean and glistening snow blanket (none of that hoping the torch passes to preseve a crusty pack) with nonstop cold. Feels like a Winnipeg winter. But whats been lacking locally is a real big storm (biggest was 6.2"). With the eroding of the deep cold and the getting to that time of year when real dynamic late winter/early spring storms can develop, its the transition from deep winter to gambling time. More risk, more reward type. Might as well buckle up, what have we got to lose? -
Yeah deep winter here. Loving it but a thaw is overdue. Tons of nickel and dimes to keep the snow fresh. Two largest snowfalls here since mid January were 6.1" & 4.9".
-
After 24 consecutive days with snowfall, yesterday was the first day since January 13th that Detroit saw no snowfall.
-
2025-2026 ENSO
michsnowfreak replied to 40/70 Benchmark's topic in Weather Forecasting and Discussion
Fantastic pics! -
Omg I need that! I need an inhaler by the time I reach the top of a hill when sledding
-
Winter 2025-26 Medium/Long Range Discussion
michsnowfreak replied to michsnowfreak's topic in Lakes/Ohio Valley
Its been a fantastic winter for cold, snowfall, and snowcover. Just need the cherry on top (big storm). Would love to see that end of Feb or Mar. -
Winter 2025-26 Short Range Discussion
michsnowfreak replied to SchaumburgStormer's topic in Lakes/Ohio Valley
Michigan is probably just as LGBT friendly if not more than Illinois outside of Chicago. Chicago obviously is where it's at for the gay pride. I actually met @A-L-E-K at a baseball game years ago while i was in town and explored boystown after the game. -
2025-2026 ENSO
michsnowfreak replied to 40/70 Benchmark's topic in Weather Forecasting and Discussion
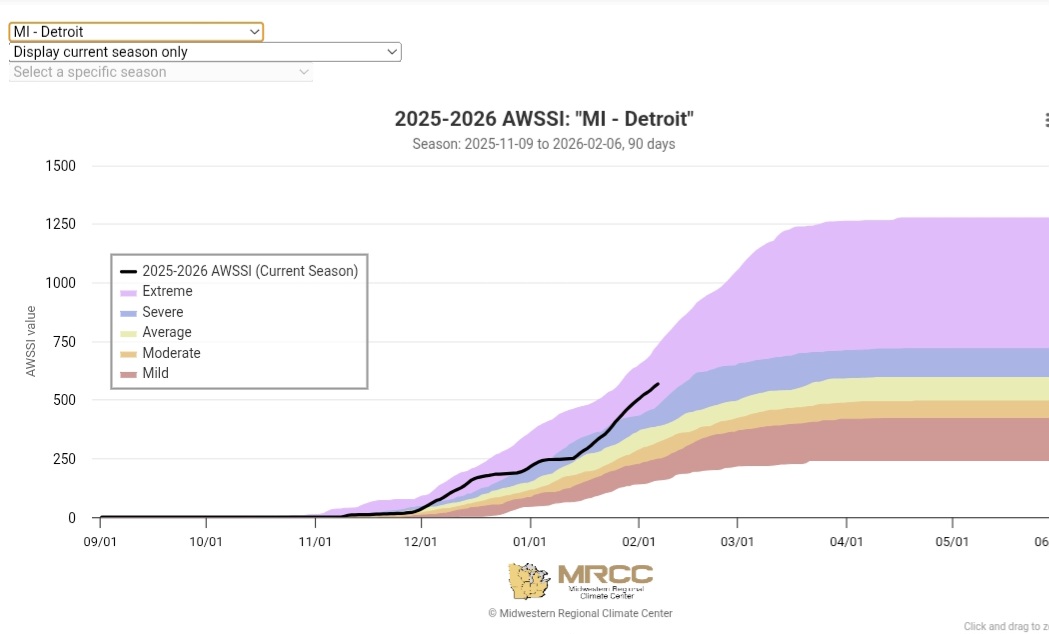
I've been a weather observer for 30 years. I live in an area that would be considered quite cold and snowy to the average American. The fact that the 3 climatologically coldest weeks of the year this year were the 3rd coldest on record IS impressive. The AWSSI winter severity index has this winter as "extreme". It doesn't change the warmth in other places which is oh so predictably constantly being brought up, it doesn't change cc, but I dont understand why weather forums suddenly become climate change lessons during times of regional cold. Why every arctic blast has to be scrutinized for its longevity or regional coverage. The hey day of weather forums as weather forums is LONG gone.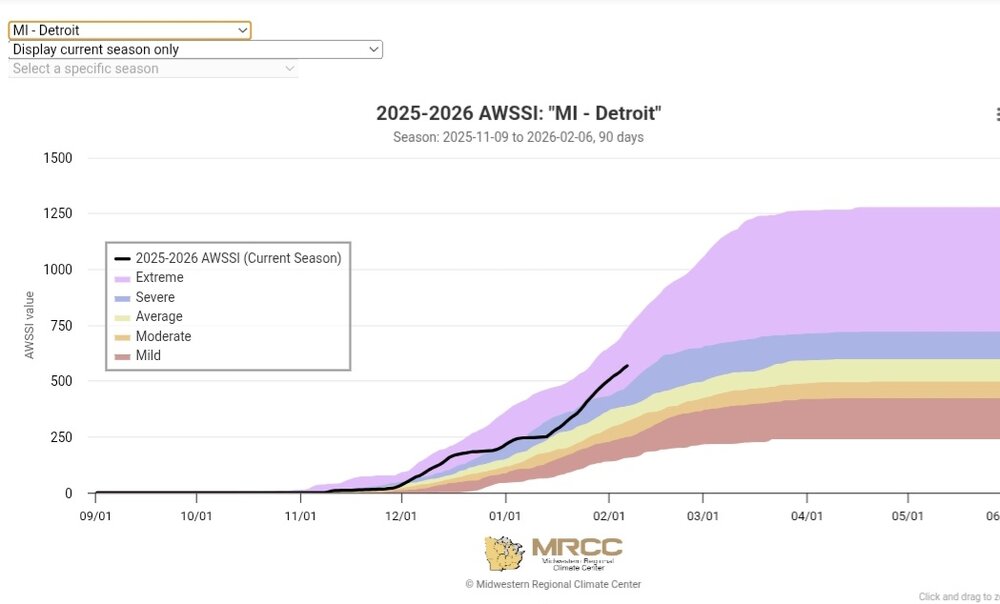
-
I always tell my brother. You want a mild winter? Say goodbye to the sun.
-
Cold winter days feature some of the deepest blue skies.
-
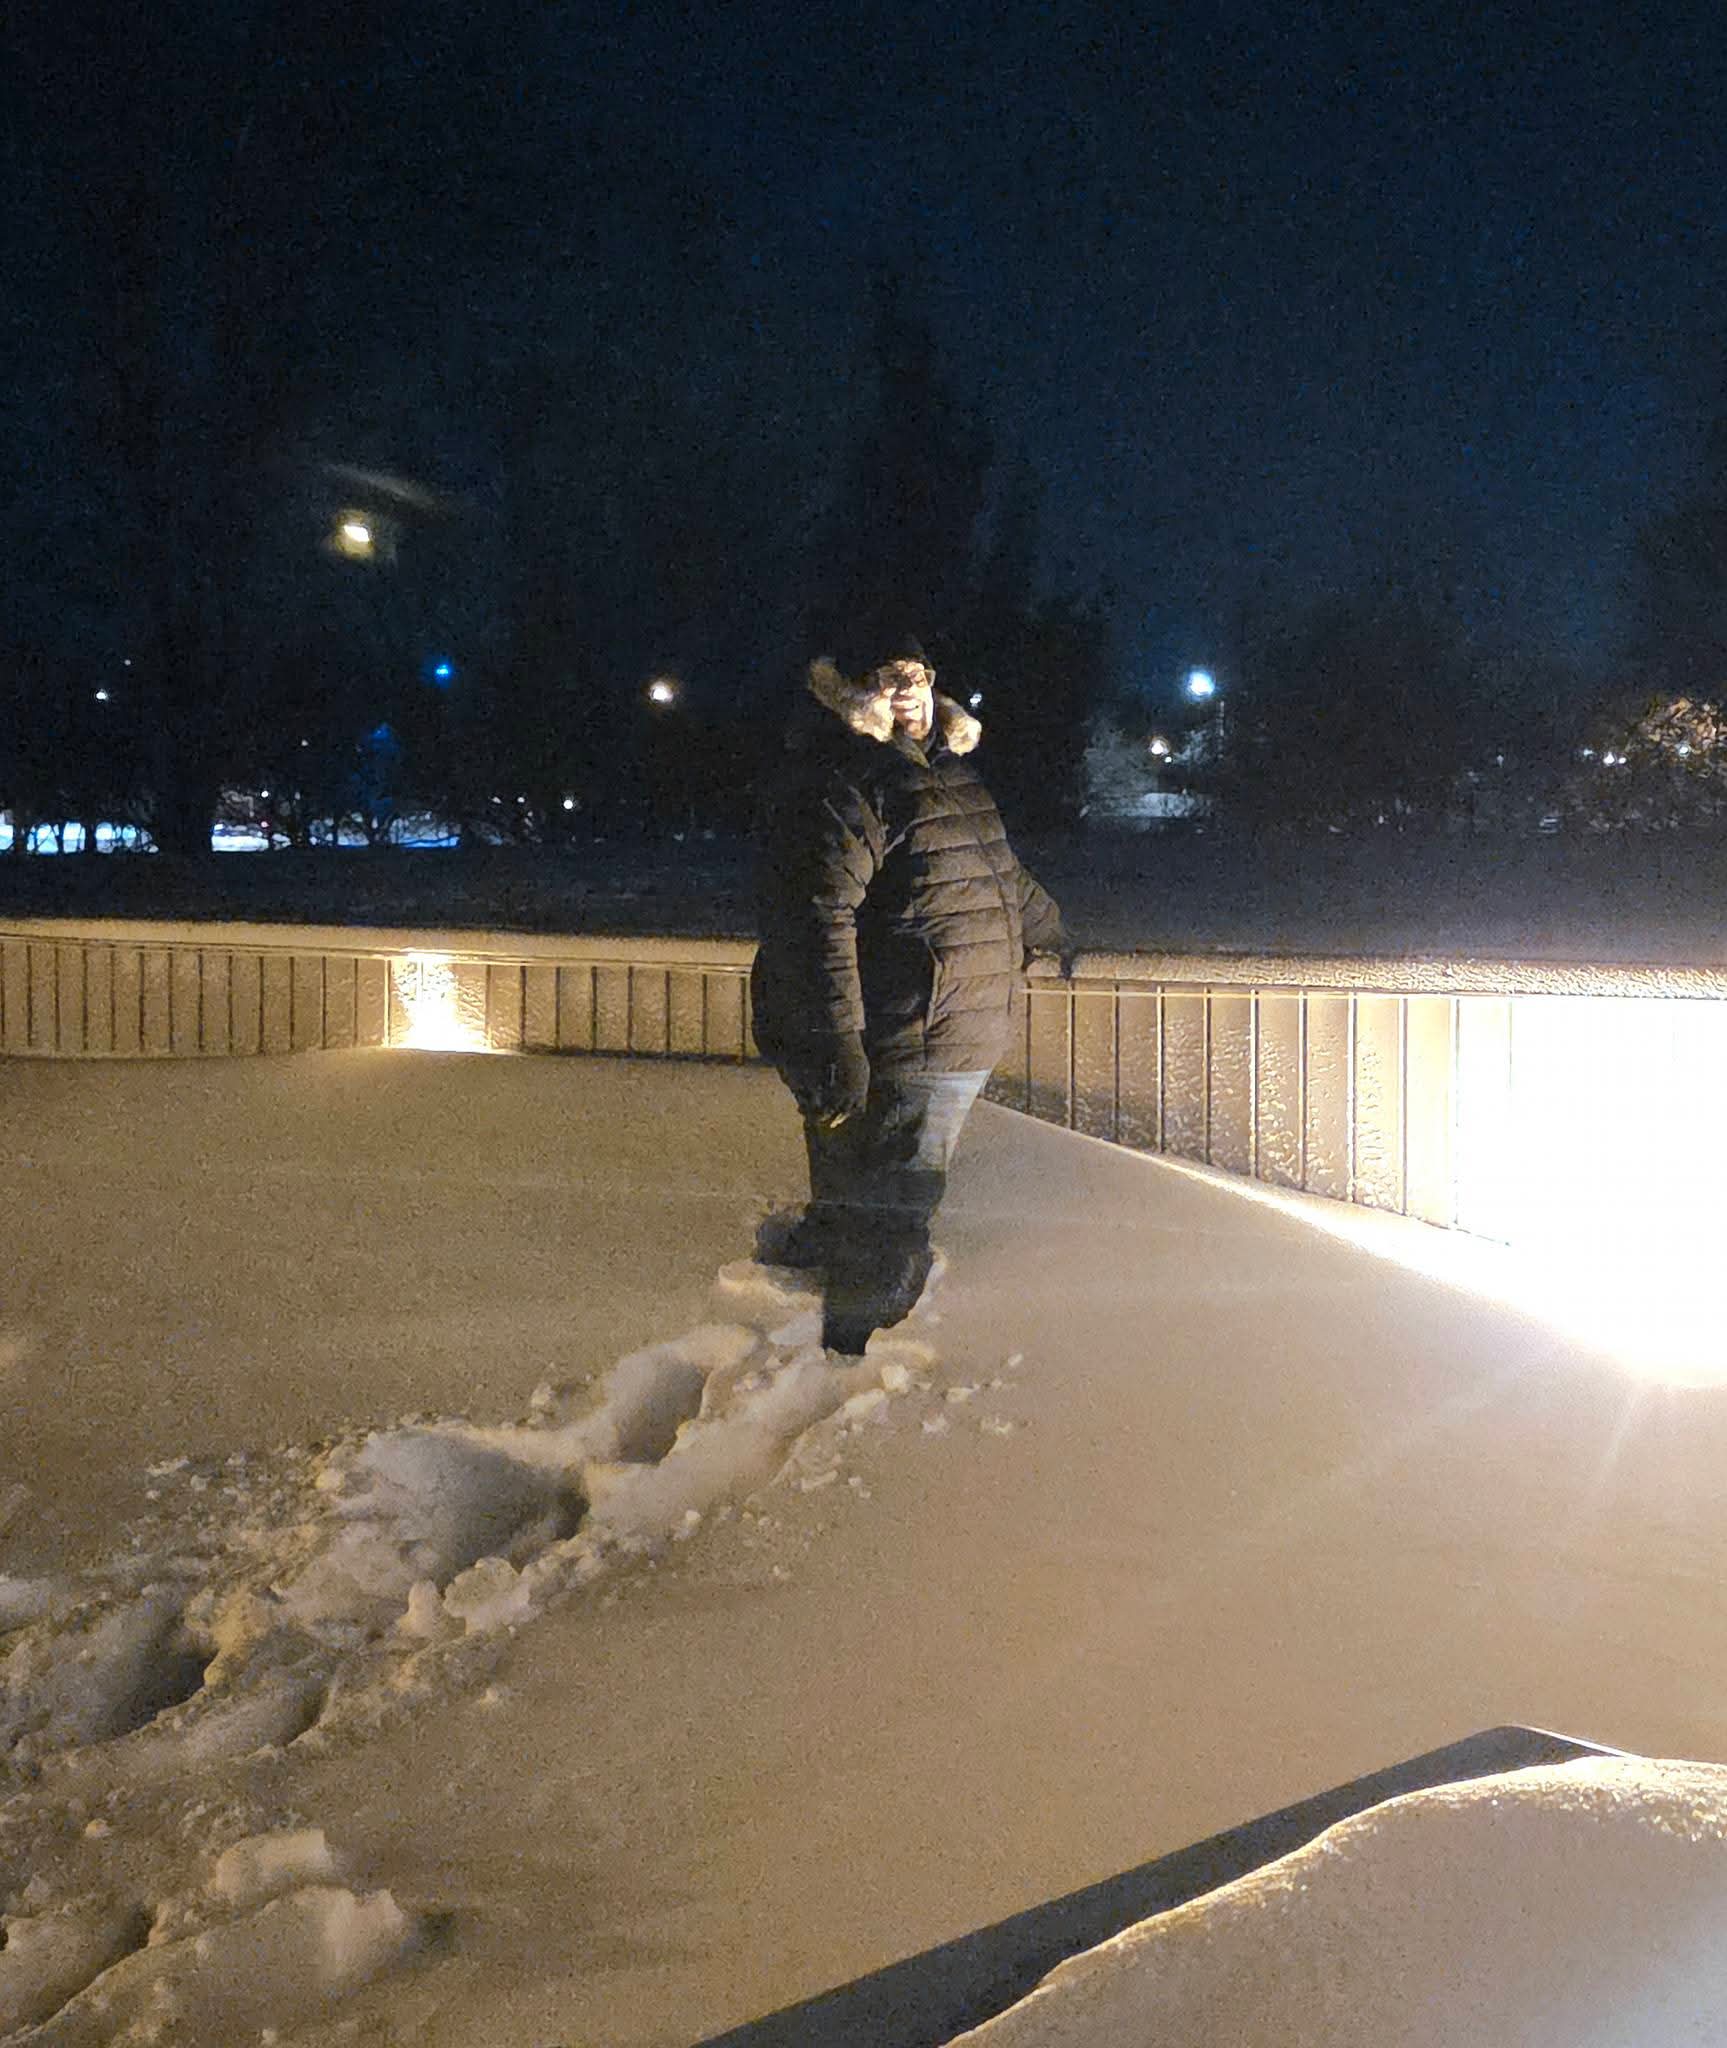
Went to a party at a boat club yesterday. 2nd floor patio. Closed for winter. But I couldn't resist checking out the snow drifts on it.

-
https://x.com/wxjerdman/status/2019729810914992195 I knew it was cold but didn't realize the impressive nature of it. January 15 - February 4 is the coldest 3 weeks of the year on avg to begin with. 2026 now ranks 3rd coldest for that 3 week stretch at Detroit in 153 years of record. Only 1918 & 1963 were colder.
-
2025-2026 ENSO
michsnowfreak replied to 40/70 Benchmark's topic in Weather Forecasting and Discussion
Wow thanks for posting this. I knew it was cold but didn't realize the impressive nature of it. @bluewave frequently mentions that cold anamolies are short in duration. This is the opposite. January 15 - February 4 is the coldest 3 weeks of the year on avg to begin with. 2026 now ranks 3rd coldest for that 3 week stretch at Detroit in 153 years of record. Only 1918 & 1963 were colder. Pittsburgh also ranks 3rd in 152 years of record. Cleveland 4th in 156 years. Toledo 6th in 153 years. And even NYC 17th in 158 years. @FPizz @mitchnick @MJO812 -
Our depths been hovering between 8-9" the last 10 days or so too.
-
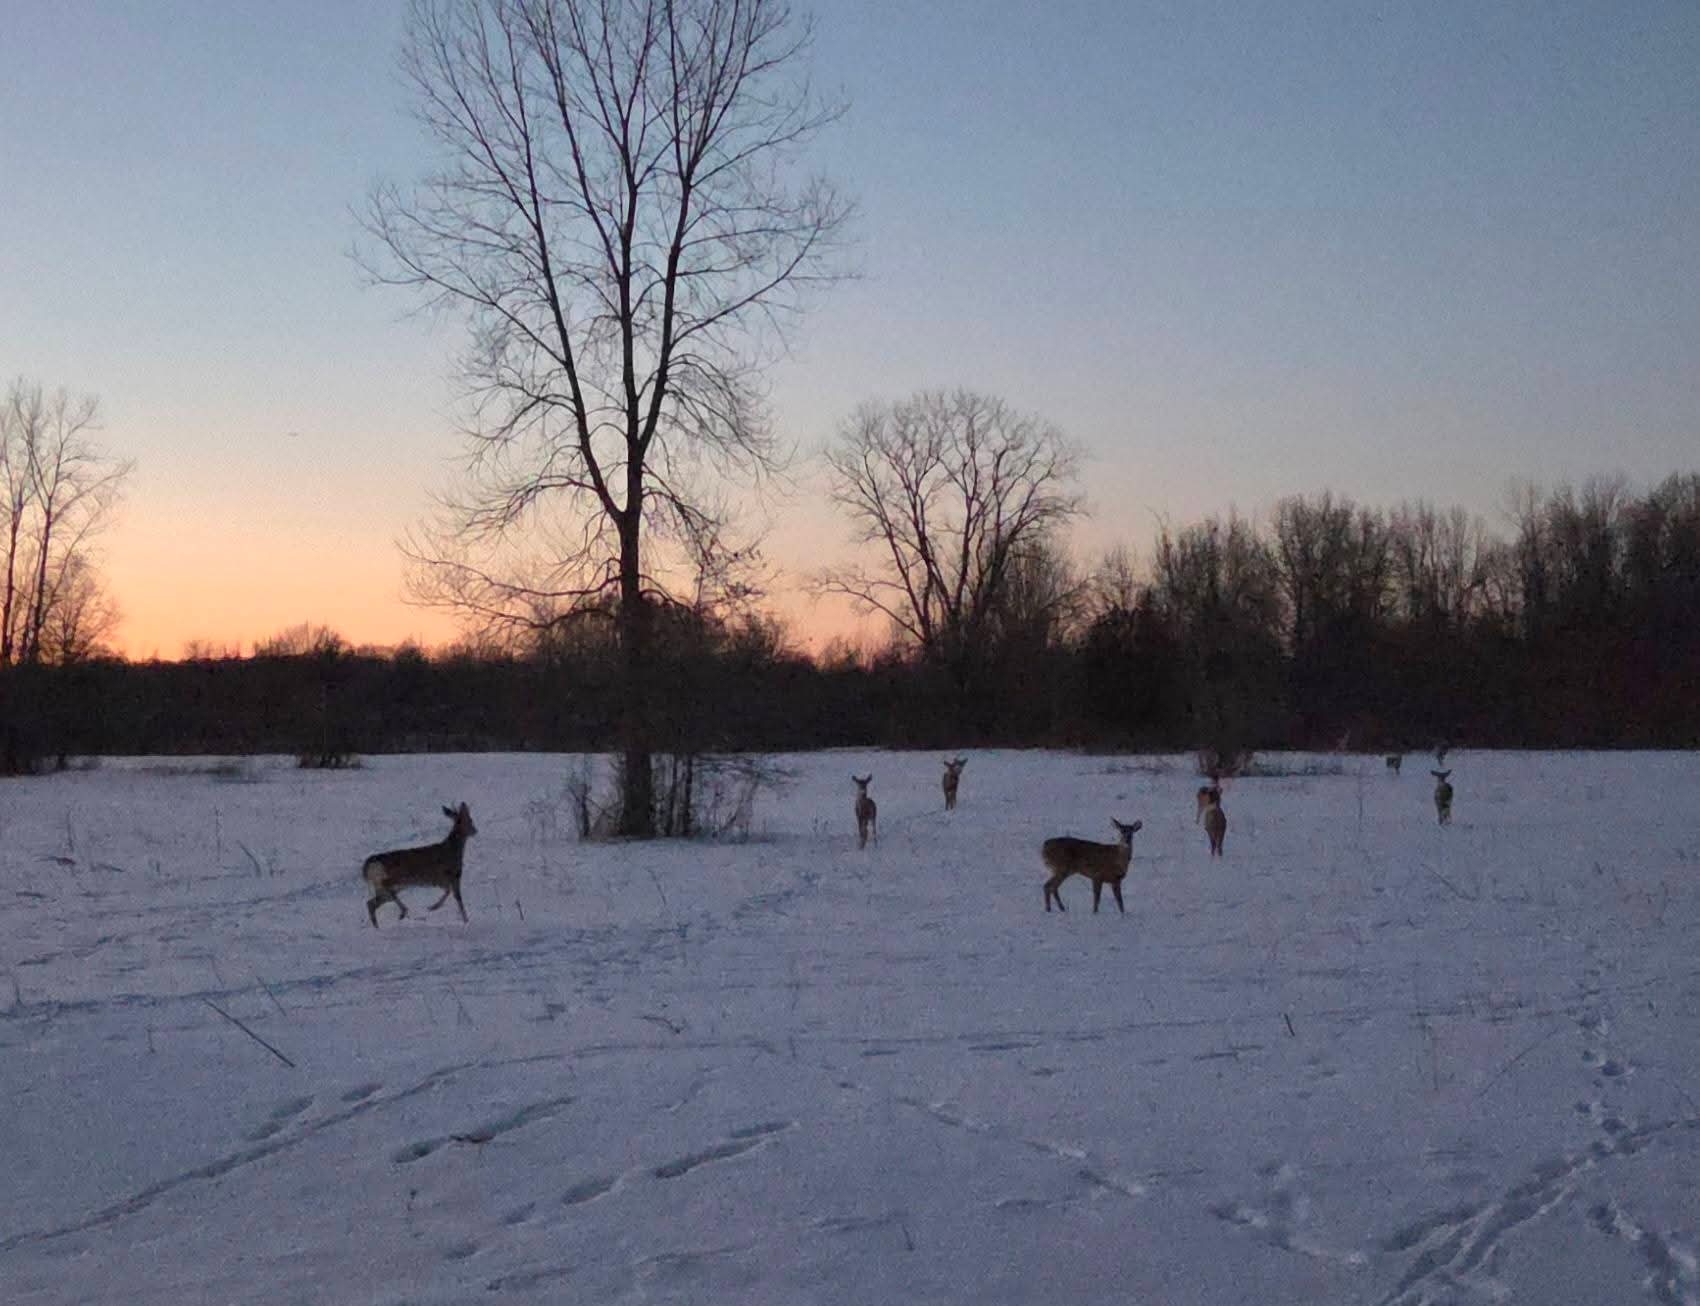
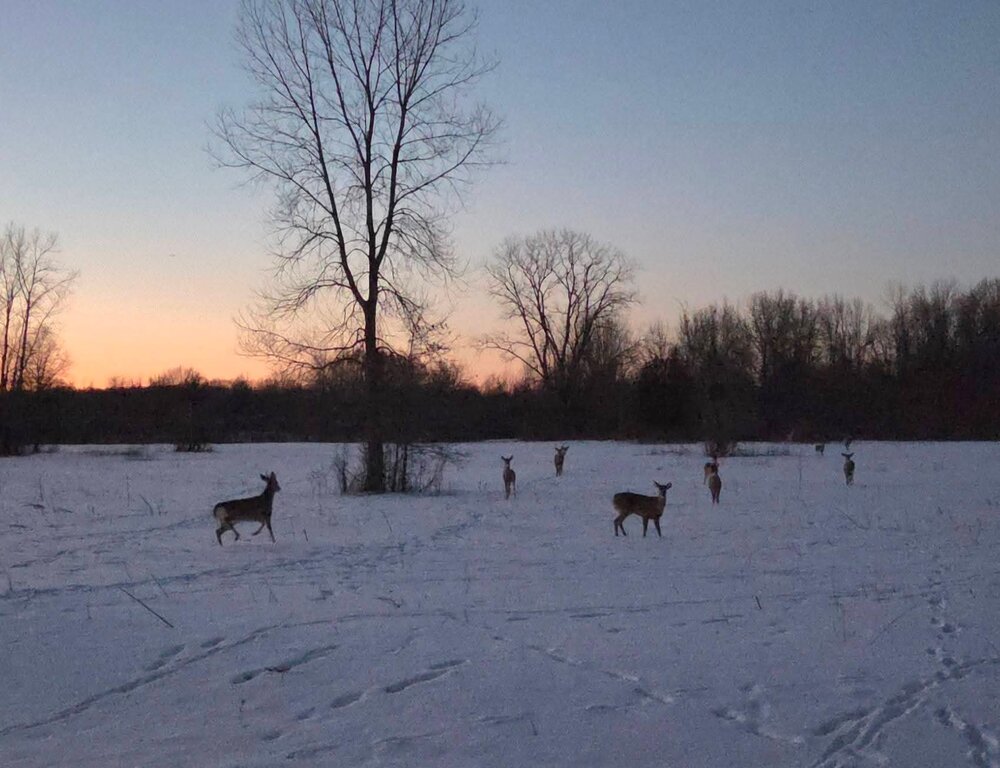
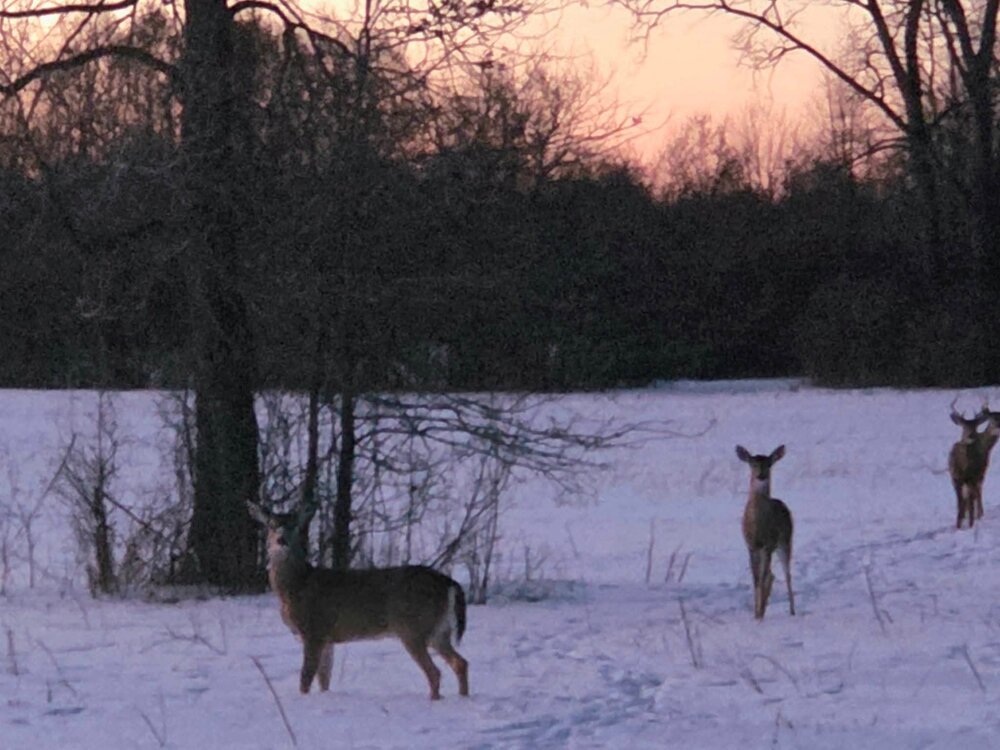
Forgot to post these guys yesterday. Dusk at the park means chow time.
-
2025-2026 ENSO
michsnowfreak replied to 40/70 Benchmark's topic in Weather Forecasting and Discussion
April is one of my least favorite months (Apr and Aug). I was recalling recent April snowfalls and frigid Opening Days moreso than the monthly temp departure. A closer look shows that in the last 10 Aprils, 4 were colder than avg, 1 avg, 5 warmer than avg. But regardless my stance remains. Calling for a torch month 2 months out with no basis other than a gut feeling is automatically wrong. I wouldn't have even responded if someone said "id lean warm for April". But torch? Ill wait and see. -
2025-2026 ENSO
michsnowfreak replied to 40/70 Benchmark's topic in Weather Forecasting and Discussion
Im the same lol, I want BN temps all year. Your area is undoubtedly beautiful...in fact...my mom and I always talk about a trip to Savannah but the heat is what turns us off....but you sound like you belong in the north haha. You would have absolutely froze up here in 2023-24. Like you said, everything is relative. -
2025-2026 ENSO
michsnowfreak replied to 40/70 Benchmark's topic in Weather Forecasting and Discussion
Recent Aprils have been cool more often than not. Looking back at La Nina Aprils, its a very wide variety of results, everything from near-record cold to near-record warm, although the colder ones outweighed the warm ones. CFS seasonal has a cold April. Euro seasonal has average. Cansips has cold in NE and avg to slightly mild midwest. Now, Im still waiting to hear what what we are basing a torch April on? I mean, torch implies at least what, top-10 warmth? -
Winter 2025-26 Short Range Discussion
michsnowfreak replied to SchaumburgStormer's topic in Lakes/Ohio Valley
A clipper in some form or another for Friday has been on the models for a solid week but they have handled it TERRIBLY, even as we get closer. No surprise. -
Winter 2025-26 Medium/Long Range Discussion
michsnowfreak replied to michsnowfreak's topic in Lakes/Ohio Valley
Solidly below avg temps, solidly above avg snowfall, and solidly above avg snowcover for Detroit. Been a great winter. But of course, the one thing missing is a huge storm. Im all for a March paste bomb. -
2025-2026 ENSO
michsnowfreak replied to 40/70 Benchmark's topic in Weather Forecasting and Discussion
Its way out, but I cannot see this as being a torch April. -
2025-2026 ENSO
michsnowfreak replied to 40/70 Benchmark's topic in Weather Forecasting and Discussion
Yes, everything is relative to climo. I take a 3-4 day trip to northern MI every year in mid-late February (usually the U.P., sometimes northern lower MI) and in Feb 2024 youd have thought it hadnt snowed at all the way the locals talked even though the area I was at was at like 80 inches on the season at that point. 2023-24 is my lowest snowfall since Ive kept track since 1995, at 21.4". After the gross 2023-24, 2024-25 was a good winter for MI in that it was cold and white, although snowfall was on the light side outside of the snowbelts. But 2025-26 has been a fantastic winter statewide with plentiful cold, snowfall, and snowcover. Today is the 50th day with 1"+ snowcover this season at Detroit. The depth is 8". The current 30-yr annual avg is 47 days, and the longterm avg is 49 days, so we have already eclipsed season avg in early Feb. -
Today is the 50th day with 1"+ snowcover this season at DTW. The depth is 8". The current 30-yr annual avg is 47 days, and the longterm avg is 49 days, so we have already eclipsed season avg in early Feb.