Terpeast
-
Posts
6,615 -
Joined
-
Last visited
Content Type
Profiles
Blogs
Forums
American Weather
Media Demo
Store
Gallery
Everything posted by Terpeast
-
Jan 18-19 Storm Threat: Bob Chill made me do it
Terpeast replied to stormtracker's topic in Mid Atlantic
Big difference on the same model -
Jan Medium/Long Range Disco 2: Total Obliteration is Coming
Terpeast replied to Jebman's topic in Mid Atlantic
I don’t think that is a coincidence, tbh. -
Never made it to 30 today. Topped out at 29.7 now down to 22
-
Mid-Atlantic Snow Totals Thread - Winter 2023-2024
Terpeast replied to mattie g's topic in Mid Atlantic
12/11: 0.5” 1/1: T 1/6: 0.2" (sleet/snow mix) 1/15-16: 4.8” Total so far: 5.5” -
Jan Medium/Long Range Disco 2: Total Obliteration is Coming
Terpeast replied to Jebman's topic in Mid Atlantic
Getting gusty, blowing snow. Gotta love it! -
Jan Medium/Long Range Disco 2: Total Obliteration is Coming
Terpeast replied to Jebman's topic in Mid Atlantic
Nice! Seems models are getting in better agreement -
Snowing again lightly
-
Jan Medium/Long Range Disco 2: Total Obliteration is Coming
Terpeast replied to Jebman's topic in Mid Atlantic
Another 4 inches on top of the 4 inches already OTG? I take -
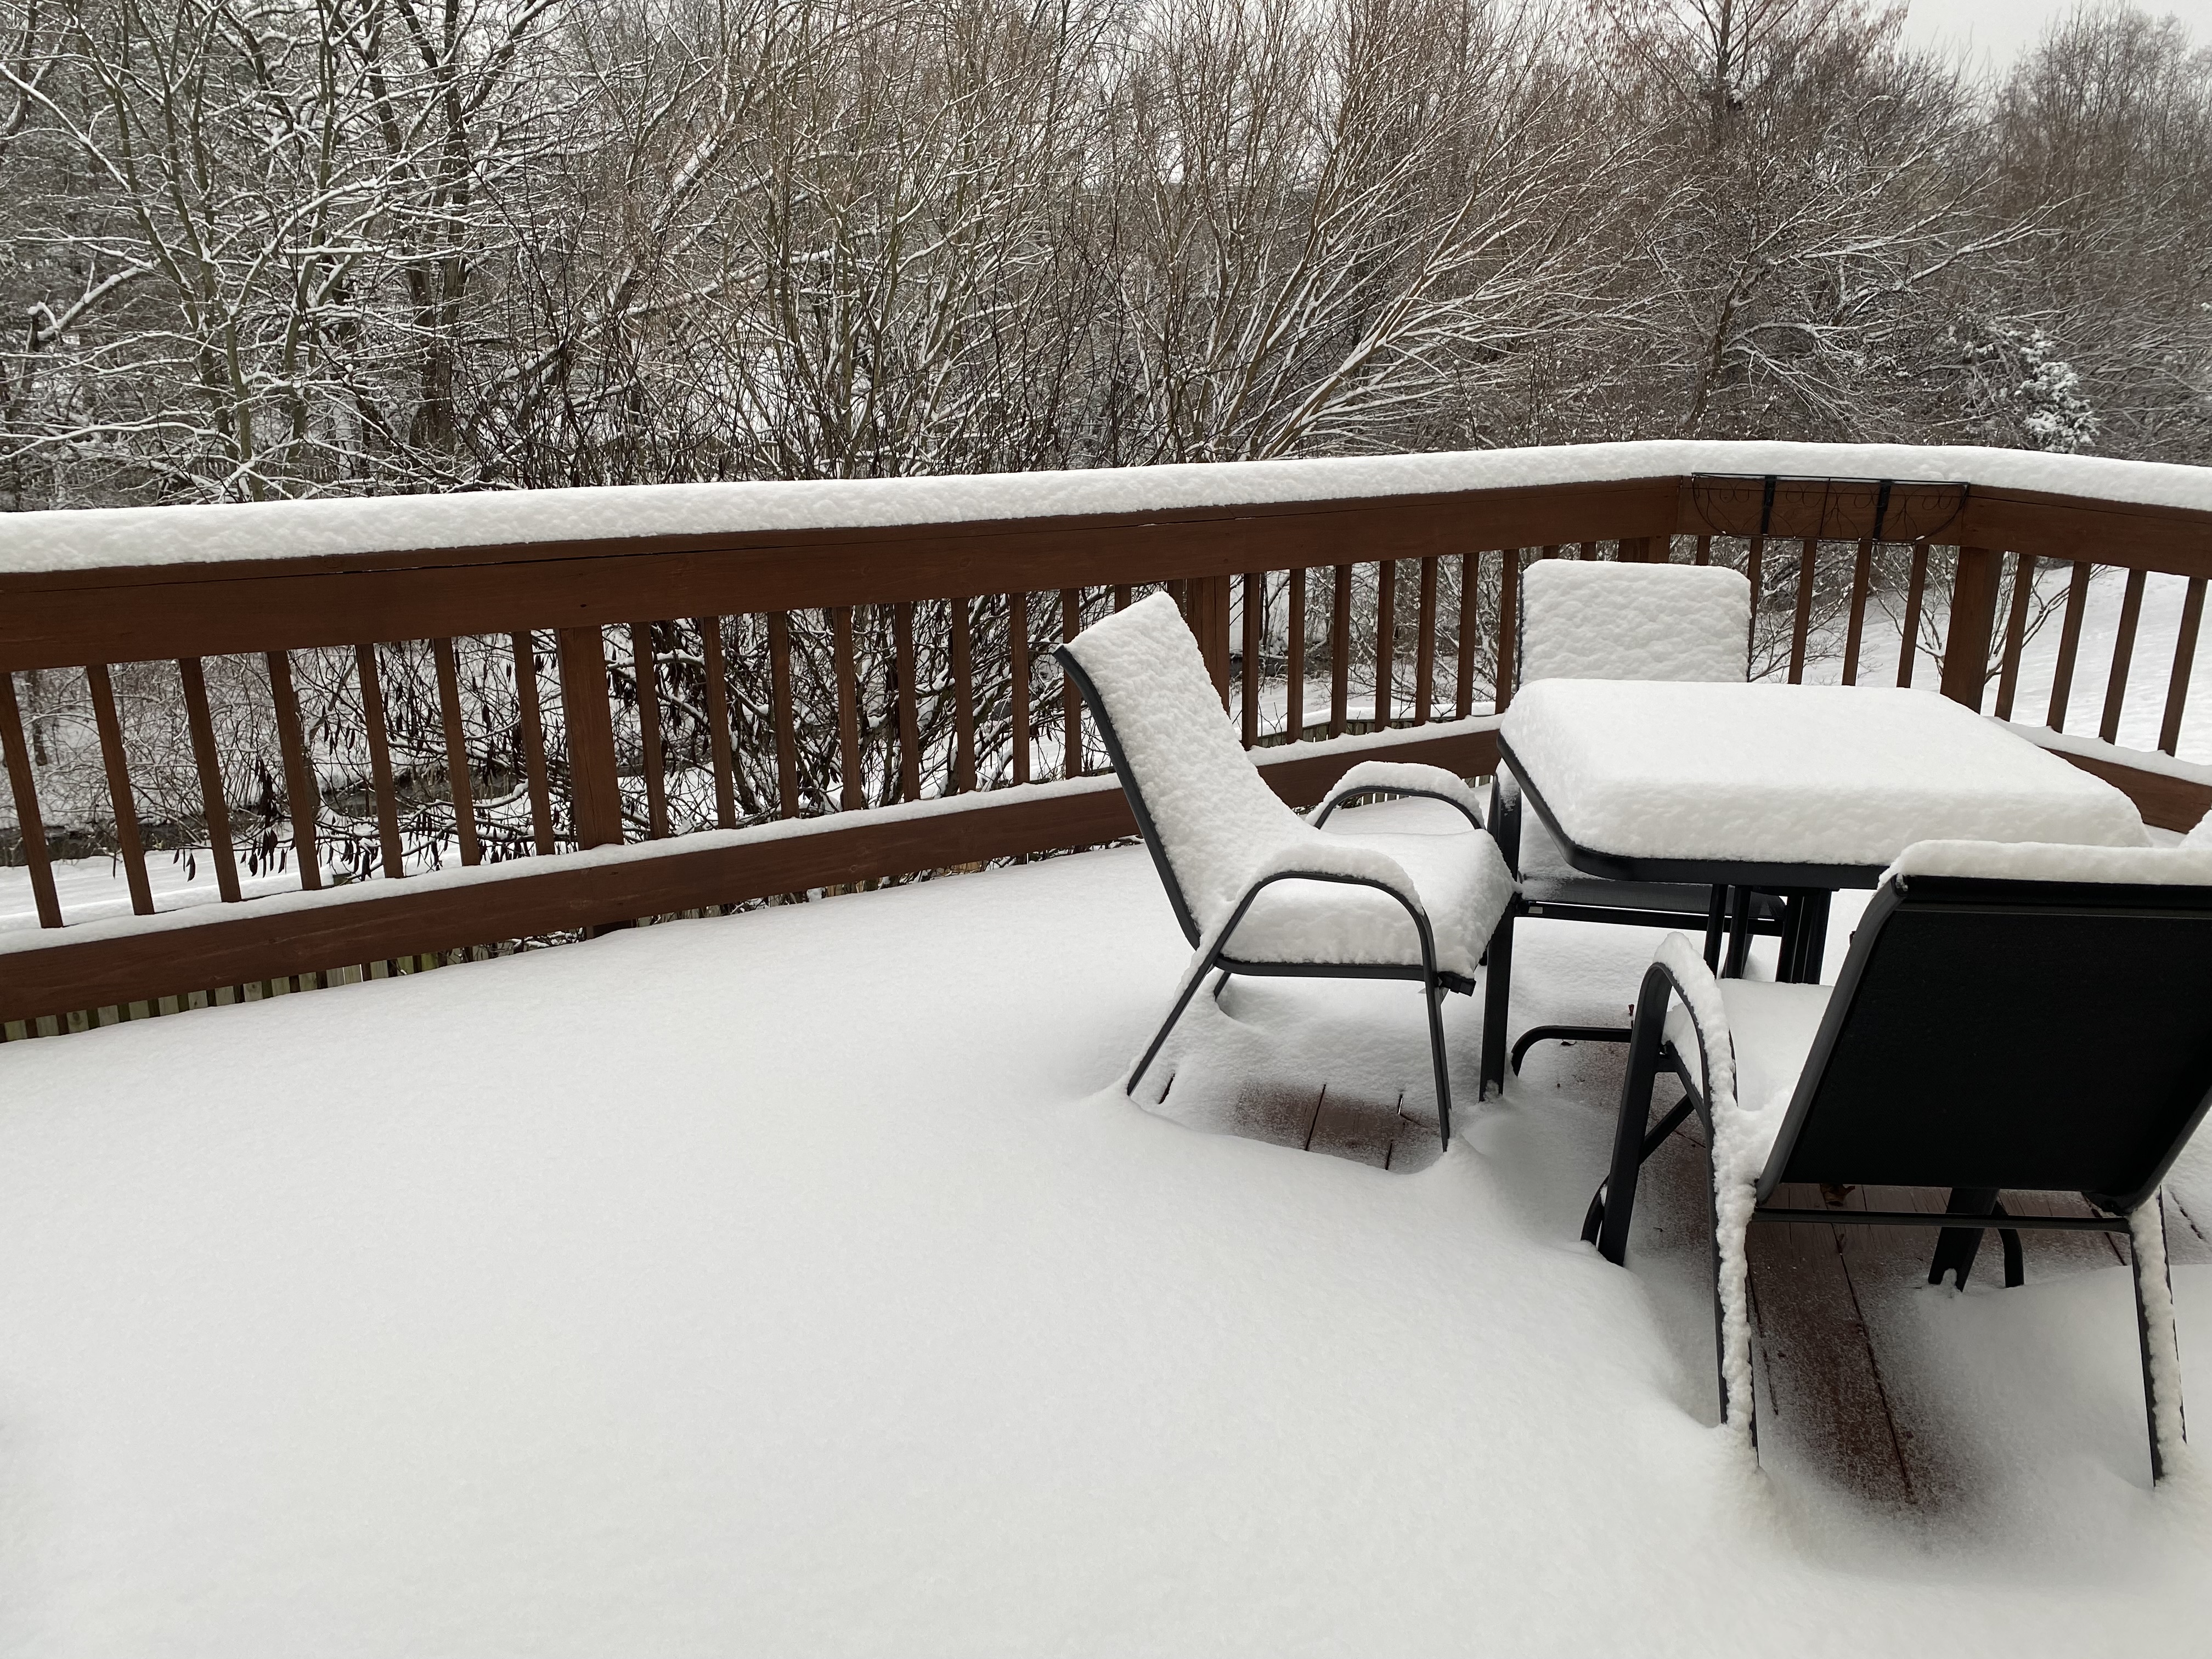
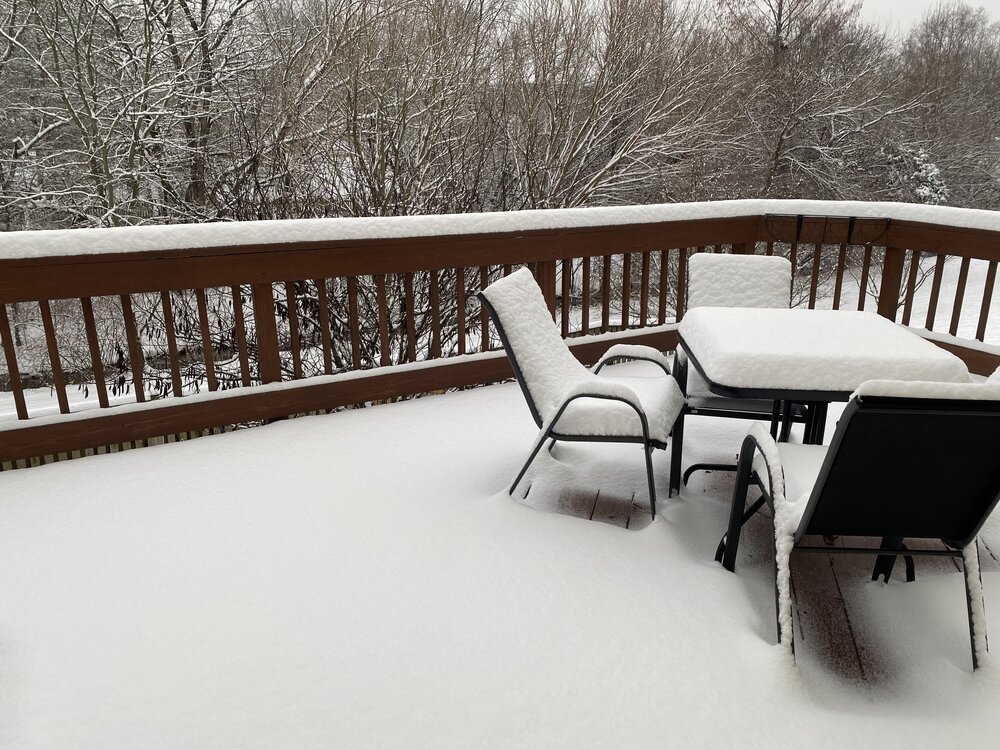
Took the kid outside again, better sledding. Ruler said a touch below 4.5” snow depth after some compaction
-
Light sleet falling make that freezing drizzle. Won’t do much except to firm up the snow pack
-
-
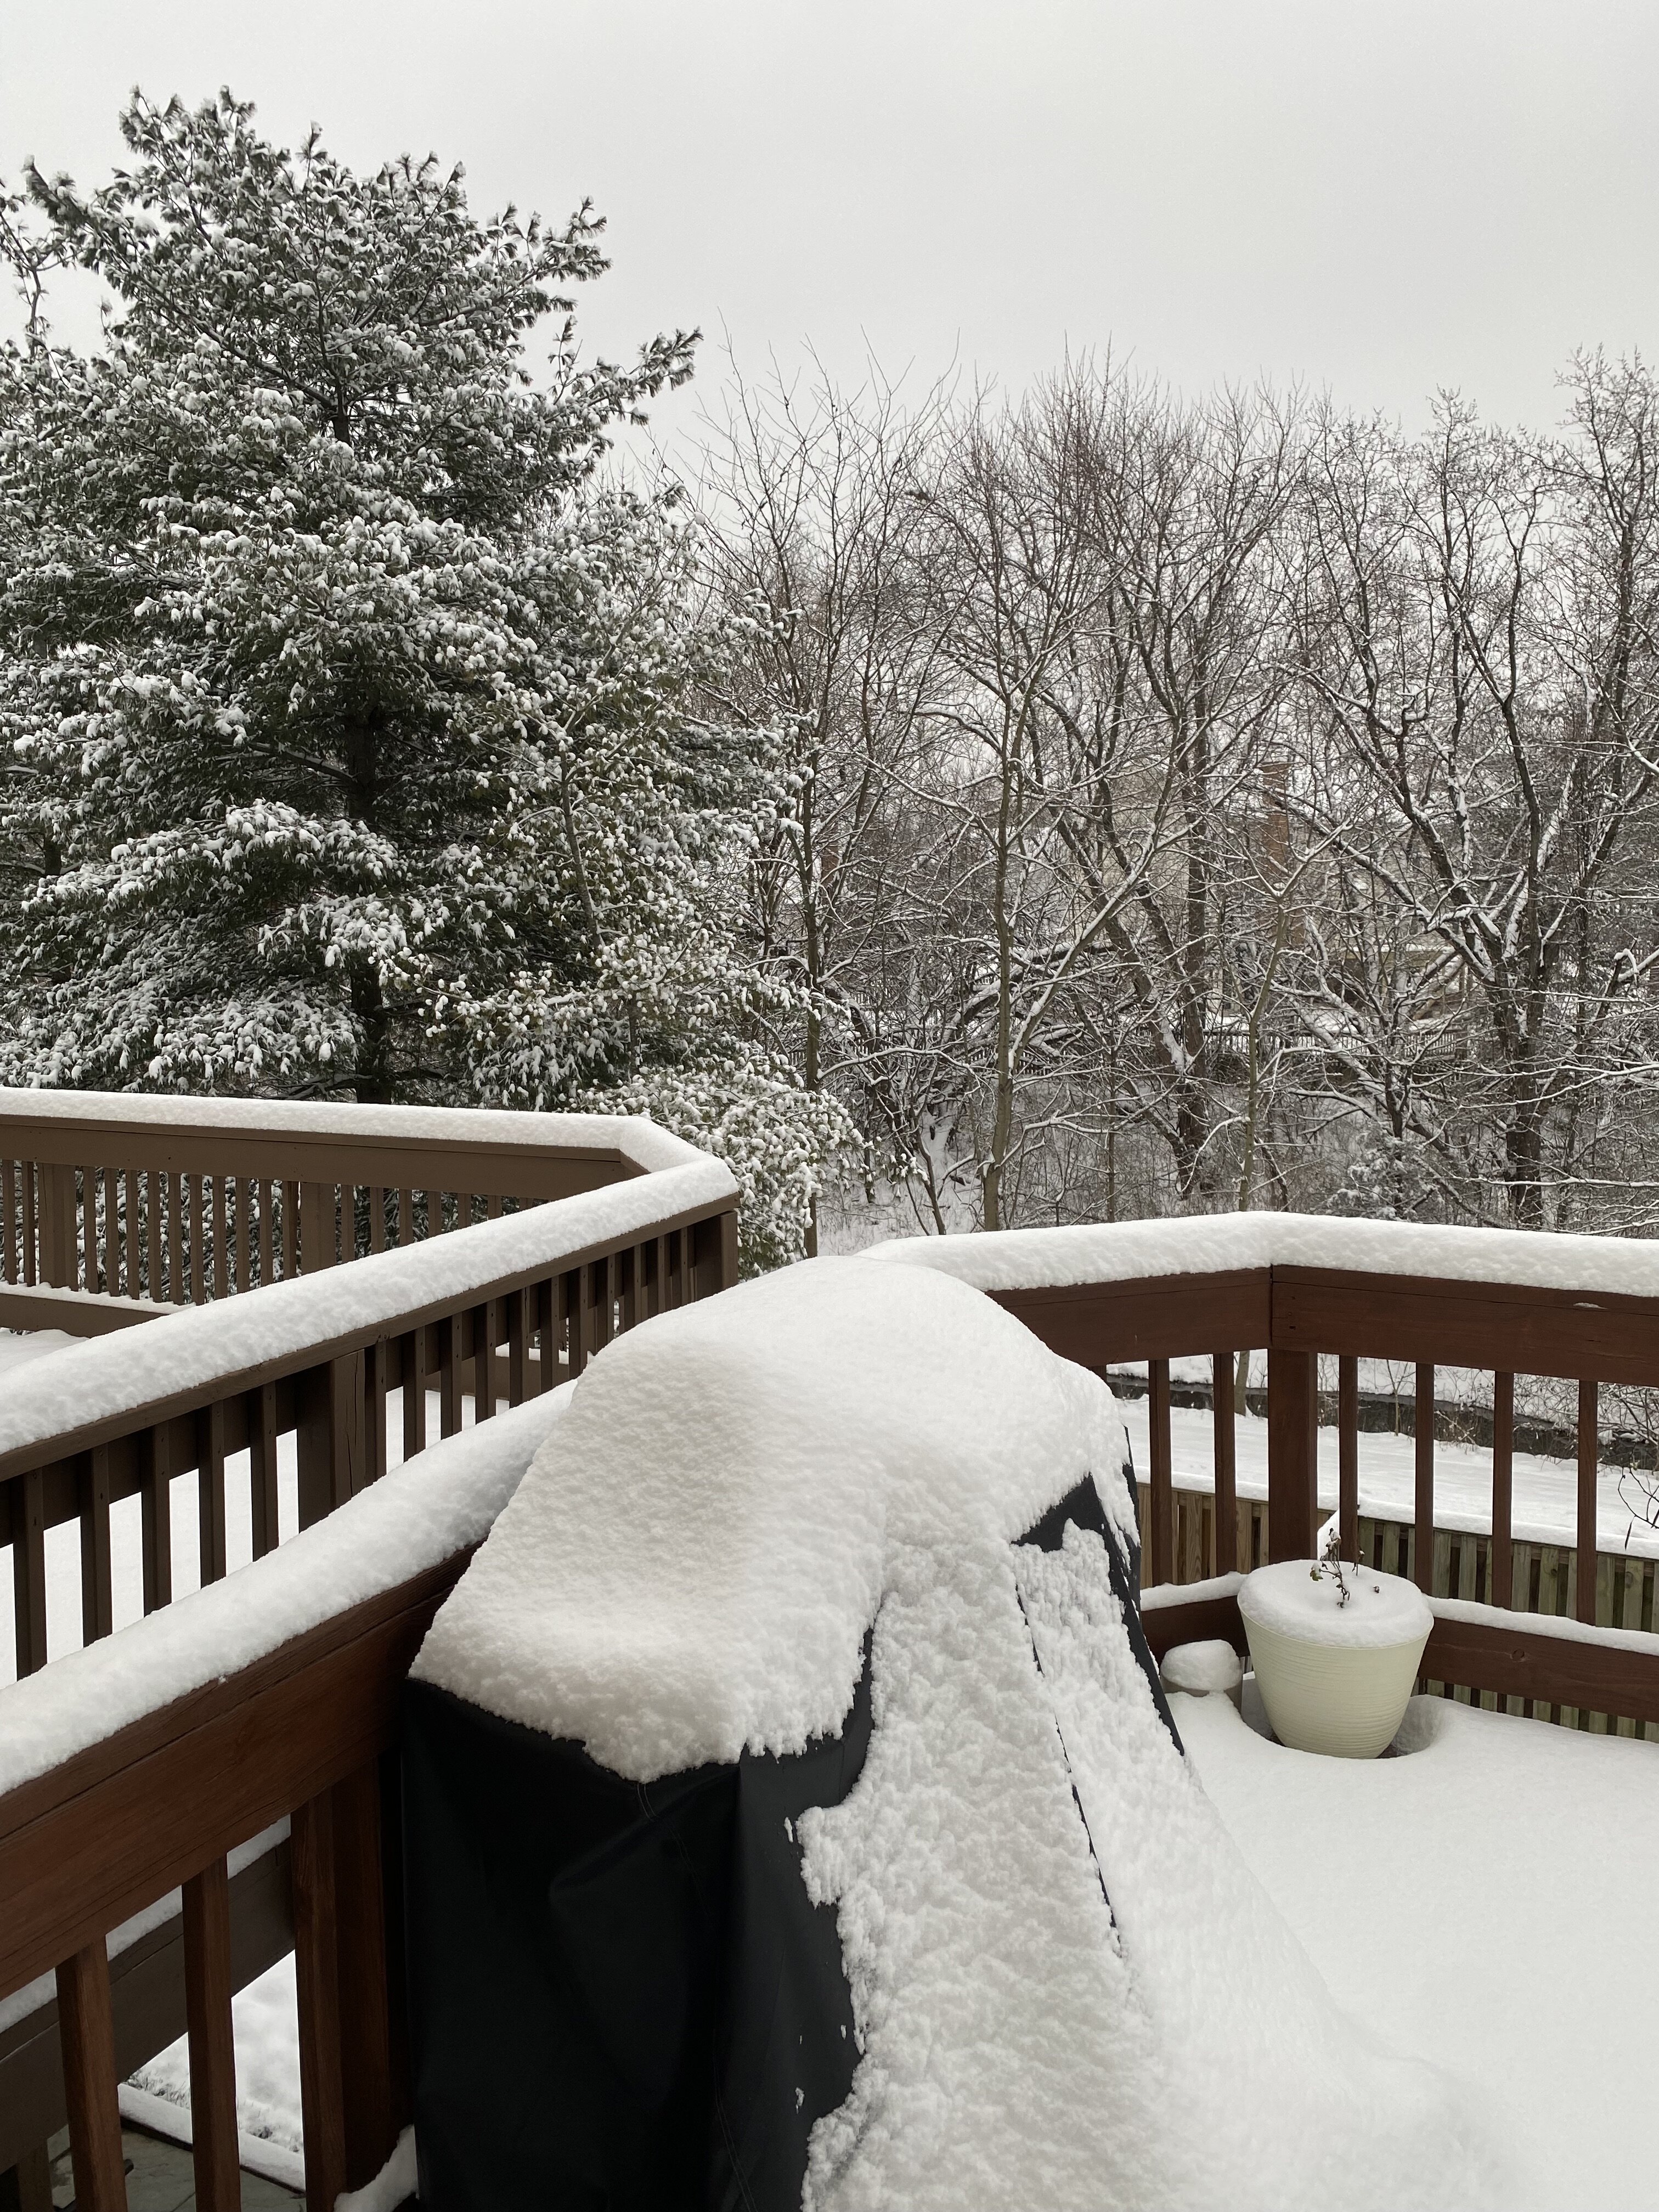
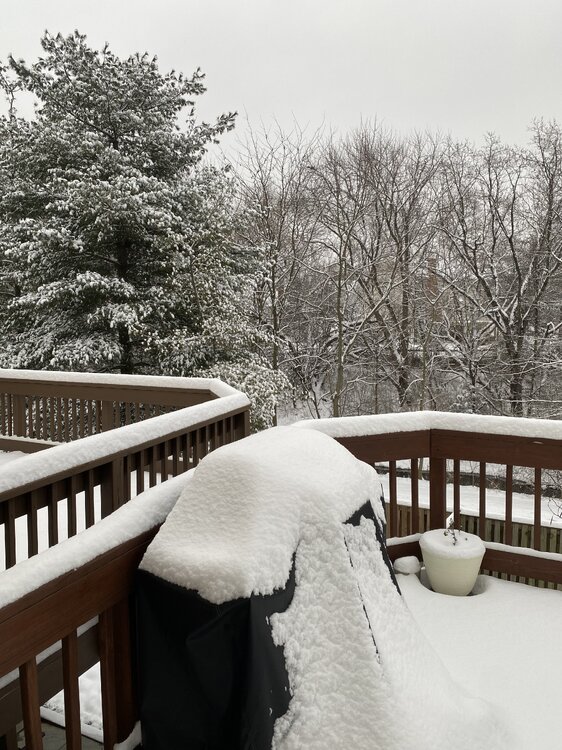
Final total 5" and beautiful winter wonderland. It's been a long, long time.
-
Now making a run at 5” going to bed now. This time for real!
-
Warning upgrade. 4-6”
-
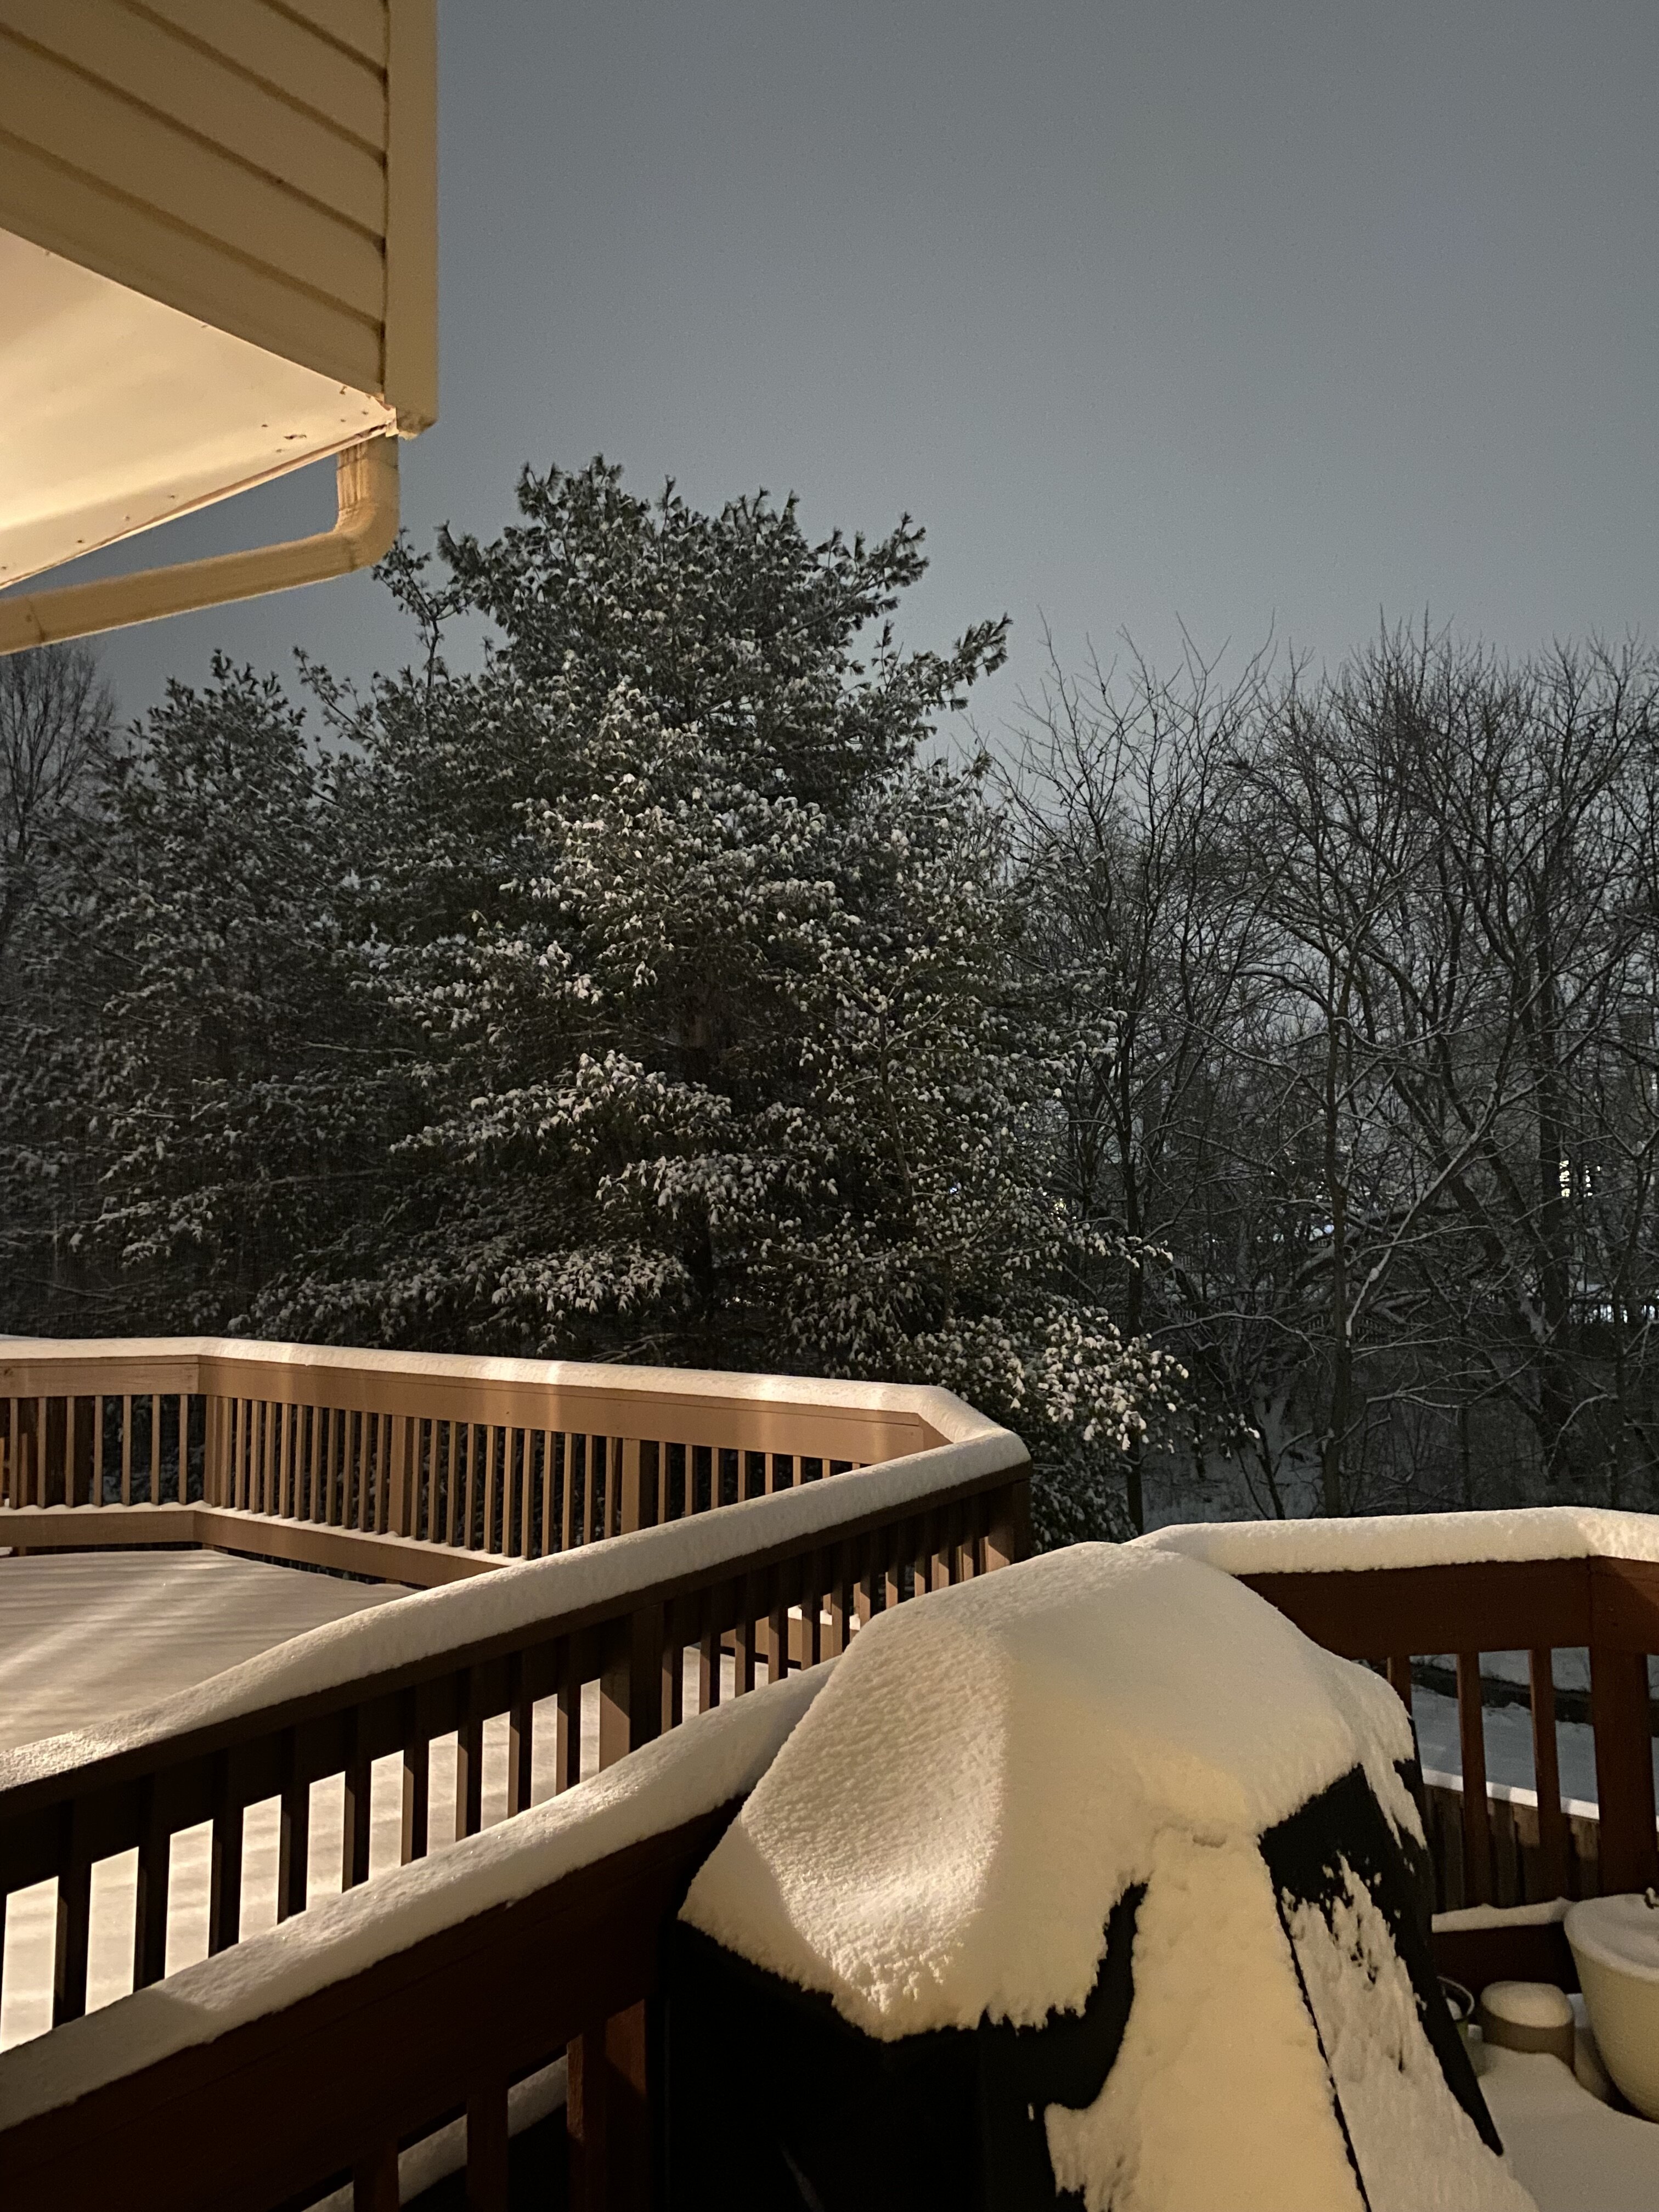
Bigger flakes now under those yellows (decided to stay up a bit longer haha)
-
Jan Medium/Long Range Disco 2: Total Obliteration is Coming
Terpeast replied to Jebman's topic in Mid Atlantic
Bigger flakes now under those yellows (decided to stay up a bit longer haha) -
Good night everyone! Will report final total tomorrow when I take the kiddo out for wintry fun

-
3.75” closing in on the 4 inch mark
-
Good point, they surprised us by going bullish early. Great call
-
Legit snowstorm now. Visibilities have dropped a tad Much respect to LWX, but thinking maybe this is turning out to be a warning event (if it continues like this for at least 2 more hours)
-
Agreed, they would all make great meteorologists.
-
In for a good pummeling
-
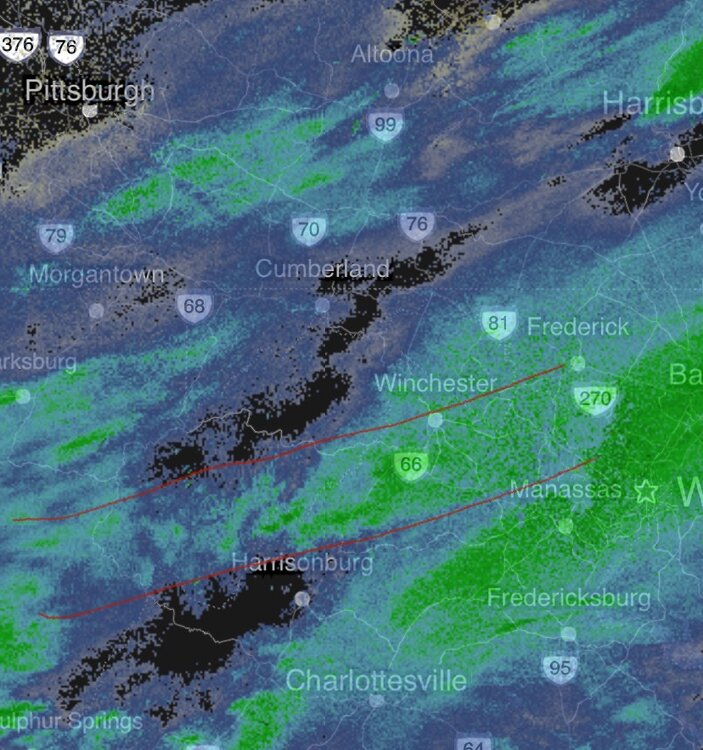
Under those medium greens. Good rates, bigger flakes. 0.5-1”/hr
-
Radar filling in nicely in this corridor
-
Those darker greens are legit stuff