

PhiEaglesfan712
-
Posts
1,718 -
Joined
-
Last visited
Content Type
Profiles
Blogs
Forums
American Weather
Media Demo
Store
Gallery
Everything posted by PhiEaglesfan712
-
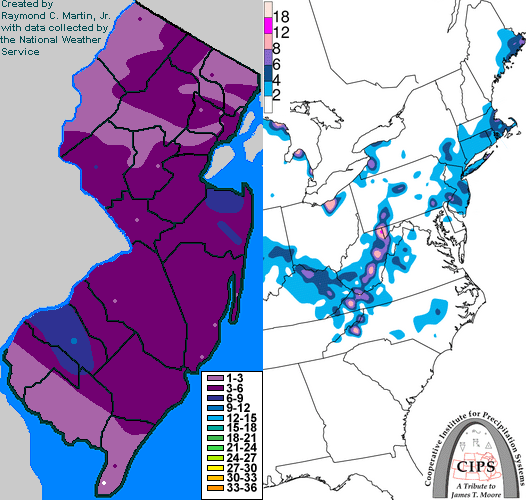
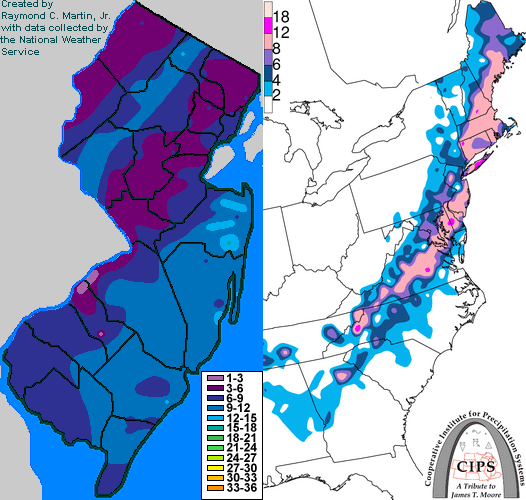
lol, the opposite of 3/4/2001.
-
So basically, for my area, it would be this: I was in the jackpot for the top storm, but I got higher amounts on the bottom (but the jackpot was to the East and North, a classical Nor'easter).
-
Blizzard of 2026 Storm Thread/OBS
PhiEaglesfan712 replied to Mikeymac5306's topic in Philadelphia Region
She's a chief meteorologist for ABC, along with Lee Goldberg. -
Blizzard of 2026 Storm Thread/OBS
PhiEaglesfan712 replied to Mikeymac5306's topic in Philadelphia Region
FWIW, Ginger Zee's tweet (at around the same time) had Mt. Holly at 16 inches. -
Blizzard of 2026 Storm Thread/OBS
PhiEaglesfan712 replied to Mikeymac5306's topic in Philadelphia Region
The 19.2 at the Mt. Holly office seems a bit high, considering where PHL, Trenton, and AC measured. Islip is going to set a new record snowfall, but to me, the list feels incomplete with the por not including 1958. I wish their por started about 10 years earlier. -
E PA/NJ/DE Winter 2025-26 Obs/Discussion
PhiEaglesfan712 replied to LVblizzard's topic in Philadelphia Region
Yeah, that outlier warm February really skewed the stats for that winter. That was the only month with above average temperatures and below average snowfall. December, January, March, and April were all cold, but that very warm February made the winter near normal to slightly above average temperaturewise. April 2, 2018 probably should have had a snow measurement (people say the T measurement at the Airport was suspect to keep the seasonal total below 30 inches), but I don't really know for sure as I was on vacation in Portugal that day. -
E PA/NJ/DE Winter 2025-26 Obs/Discussion
PhiEaglesfan712 replied to LVblizzard's topic in Philadelphia Region
I believe 2013-14 was the last time we got above average snow all 4 months. -
Blizzard of 2026 Storm Thread/OBS
PhiEaglesfan712 replied to Mikeymac5306's topic in Philadelphia Region
13.7 as of 7 am: https://x.com/NWS_MountHolly/status/2025923299184693488 AC - 14.5 Trenton - 15.6 -
Not always. 2016 was preceded by 2013-14 and 2014-15, both all time winters. And 2006 was preceded by 2002-03, 2003-04, and 2004-05, all cold and snowy winters. Also, don't forget about 2009-10 and 2010-11. This proves that recently it seems like good winters come in stretches.
-
Sucks that Islip's records doesn't start like 10 years earlier. It misses out on 1957-58 and 1960-61. I would like to have seen where the February and March 1958 blizzards would have ranked.
-
E PA/NJ/DE Winter 2025-26 Obs/Discussion
PhiEaglesfan712 replied to LVblizzard's topic in Philadelphia Region
Neither scenario is going to happen. I see mostly seasonable, 40s and 50s, the first week of March. Three separate winter events in the first 7 days of March is not even realistic. That has never happened before, not even in the historic March 2018 (which the 3 events were spread over 3 weeks). At best, we're only going to get one, and even then, I think the temperatures are a bit too warm and the sun angle is a bit too high for a snow event. If any precipitation falls during the first week of March, it will be rain. -
39 years ago today:
-
39 years ago today. Like today, a Monday morning. I like how they were able to shovel the snow out in about an hour, and got to work like nothing happened:
-
February 2026 OBS & Discussion
PhiEaglesfan712 replied to Stormlover74's topic in New York City Metro
Temperatures will moderate out, and I think it will at least be closer to normal, if not above average. We've strung 3 straight well below average months. I highly doubt we're going to string together a 4th. That hasn't happened in a long time. Even those moderated out. 14-15 even turned in a near record warm May after the cold winter. -
February 2026 OBS & Discussion
PhiEaglesfan712 replied to Stormlover74's topic in New York City Metro
Unless the sun is replaced with something smaller, this isn't going to happen. January and February were cold, and we avoided averaging 5 degrees below average in either month (we're at -5.1 so far in February, but it looks like the last week will at least be warm enough to avoid). Also, March hasn't average 5 degrees below average since 1960, and there hasn't been a March that failed to reach 56 once since 1906. Yes, not even in the historically cold years of 2014 and 2015. -
The Devils should have traded for Quinn Hughes. Not making that move really sank the season.
-
If I remember correctly, it was never apparent that it would not be happening until the event was in progress. I think they rolled with that forecast all the way through. The sad part is that if the storm even verified halfway, 2000-01 would have been remembered as an all-time great winter, with 50+ inches in NYC and 40+ inches in PHL. Instead, that winter is remember as a bust, and not as fondly as the great winters of 2002-03, 2003-04, and 2004-05 that followed.
-
Blizzard of 2026 Storm Thread/OBS
PhiEaglesfan712 replied to Mikeymac5306's topic in Philadelphia Region
Last 2" - 5/13 to 5/16/2025 (3.11 inches over 4 days) 2025-05-13 71 62 66.5 3.1 0 2 0.28 0.0 0 2025-05-14 66 59 62.5 -1.2 2 0 1.30 0.0 0 2025-05-15 77 63 70.0 6.0 0 5 0.03 0.0 0 2025-05-16 77 60 68.5 4.2 0 4 1.50 0.0 0 Last 1 " - 1/25/2026 (our last snowstorm) 2026-01-25 24 15 19.5 -13.7 45 0 1.39 9.3 2 Before that was 12/19/2025 (our warmest day this winter) 2025-12-19 61 31 46.0 8.3 19 0 1.48 0.0 0 -
Blizzard of 2026 Storm Thread/OBS
PhiEaglesfan712 replied to Mikeymac5306's topic in Philadelphia Region
Yeah, then 2002-03, 2003-04, and 2004-05 soon followed, and left 00-01 in the dust. If that 3/5/2001 storm even verified halfway, 00-01 would have been remembered in that great series of winters in the first half of the 2000s (with the exception of the obvious dud in 2001-02). -
Blizzard of 2026 Storm Thread/OBS
PhiEaglesfan712 replied to Mikeymac5306's topic in Philadelphia Region
In my area, I think it was February 10, 2010. Before that was February 28, 2005 (this one didn't really pan out, though we did have the NFC Championship storm earlier that year) and then January 7, 1996. -
I think it was the January 31, 2021 event. That one went at least 3 days, maybe even into a 4th.
-
E PA/NJ/DE Winter 2025-26 Obs/Discussion
PhiEaglesfan712 replied to LVblizzard's topic in Philadelphia Region
Is this still slush or now mud? -
Blizzard of 2026 Storm Thread/OBS
PhiEaglesfan712 replied to Mikeymac5306's topic in Philadelphia Region
2009-10 was technically a strong el nino, as it went above 1.5 on both the ONI and RONI. So our last moderate el nino was 2002-03. -
Blizzard of 2026 Storm Thread/OBS
PhiEaglesfan712 replied to Mikeymac5306's topic in Philadelphia Region
Can see that happening. If that does happen, I could see 12-20 inches as far west as the I-95 metro area. -
Blizzard of 2026 Storm Thread/OBS
PhiEaglesfan712 replied to Mikeymac5306's topic in Philadelphia Region
Can definitely understand. Until there is actually snow on the ground, there is always bust potential. (March 2001 should have taught us that.) I just learned over time to be grateful for all types of weather as they come to you because you just never know when that's going to come again. Sorry if I do come across the wrong way. I kind of feel like an outsider, if anything, as I'm not a meteorologist or anything. I hold a full time job, and do this just for a hobby/interest. I don't get anything extra if my forecast verifies.


