
George001
-
Posts
6,993 -
Joined
-
Last visited
Content Type
Profiles
Blogs
Forums
American Weather
Media Demo
Store
Gallery
Everything posted by George001
-
Yeah that’s a major ice storm. .30-.40 inches of ice is no joke, but it appears there a hole in Connecticut around the Tolland area where there’s no ice at all.
-
That’s true. It’s like 1040+, that’s even stronger than we had during the blizzard yesterday. Now we will also have a more unfavorable low track working against us if the Canadian is right, so that would warm up the mid levels. I do think the high to the north will keep the temps cooler than forecast even if the low goes to Buffalo thomas a result, leading to an ice storm. I I’m skeptical of an all snow solution since the Navy is north with the low, and when the Navy is north of other guidance that’s a huge red flag.
-
The Canadian is a great model, always want to have it on board.
-

OBS/DISCO - The Historic James Blizzard of 2022
George001 replied to TalcottWx's topic in New England
That storm was so frustrating for me. It was in the teens the night before and then it warmed up and rained. Such a waste of cold air. For a few days there I was convinced we would waste this favorable January pattern, and would be lucky to get to average snowfall this winter in eastern mass. Fortunately the pattern delivered in the end, hopefully it reloads in Feb and we get another monster blizzard. If that happens, this winter will go from good to epic. A good winter is one with at least 2 big storms that bring a foot or more of snow, and finishes above our seasonal average. An epic winter for me has at least 2 massive blizzards (as much as I wish it would happen every winter, most winters we don’t even get one never mind 2 or more). -
OBS/DISCO - The Historic James Blizzard of 2022
George001 replied to TalcottWx's topic in New England
That’s fair. A slushy foot usually will take longer to melt so that’s nice. For me I’m generally the same way, if I’m forecast to get like 12+ and end up with 8 I’ll be disappointed. However if I’m forecast to get like 2-4 and end up with 8 I’ll be happy, it’s relative to expectations. Where I am different is my cutoff for being happy no matter what is lower. When I go outside and bring my 12 inch ruler to measure the snow, and it isn’t enough, that’s a successful storm in my eyes. -
OBS/DISCO - The Historic James Blizzard of 2022
George001 replied to TalcottWx's topic in New England
I’ve been on multiple boards, and this is by far the most chill one I’ve seen. I have been banned from other boards for being a huge weenie after my forecast busted. The posters here will give me some shit but it’s all in good fun. I forecasted a huge blizzard a few days out when the Navy was showing it for the MLK storm, but unfortunately the Navy was wrong and it rained instead. -
OBS/DISCO - The Historic James Blizzard of 2022
George001 replied to TalcottWx's topic in New England
what would you guys rather have? A foot of powder, or a slushy foot before a changeover to sleet and then freezing rain? I got around that in the March 2017 storm, was a nice storm, but I was a bit disappointed when I saw we only got a slushy foot while places NW had way more. -
OBS/DISCO - The Historic James Blizzard of 2022
George001 replied to TalcottWx's topic in New England
This storm lived up to its name, a massive blizzard with snow right down to the cape. This truly was a textbook James storm, although it started as rain on cape cod, as the low continues to deepen the rain snow line crashed south due to dynamic cooling. Blizzard conditions were confirmed as far west as Worcester and as far east as Hyannis. -
OBS/DISCO - The Historic James Blizzard of 2022
George001 replied to TalcottWx's topic in New England
Lol this storm is amazing -
OBS/DISCO - The Historic James Blizzard of 2022
George001 replied to TalcottWx's topic in New England
Yep that’s right, I just looked at the hours but the storm ends tonight not Monday. -
OBS/DISCO - The Historic James Blizzard of 2022
George001 replied to TalcottWx's topic in New England
4 days out Euro pretty much nailed it, had a few wobbles after that, but it had the right idea. In my opinion the models did fairly well with this storm. I got a little carried away with those kuchera maps, they overdid it on the snow ratios some. Gfs just had no idea what was going on. -
OBS/DISCO - The Historic James Blizzard of 2022
George001 replied to TalcottWx's topic in New England
Got about 18-20 here, on the NW edge of that death band earlier. -
I am from eastern mass so mostly post on the New England board, but I every time I see you post it’s something negative. This winter has been great so far, NYC is already just a few inches under it’s seasonal average and so is Boston, and there are 2 months left. Cmon man, stop being such a buzzkill and enjoy your foot.
-
OBS/DISCO - The Historic James Blizzard of 2022
George001 replied to TalcottWx's topic in New England
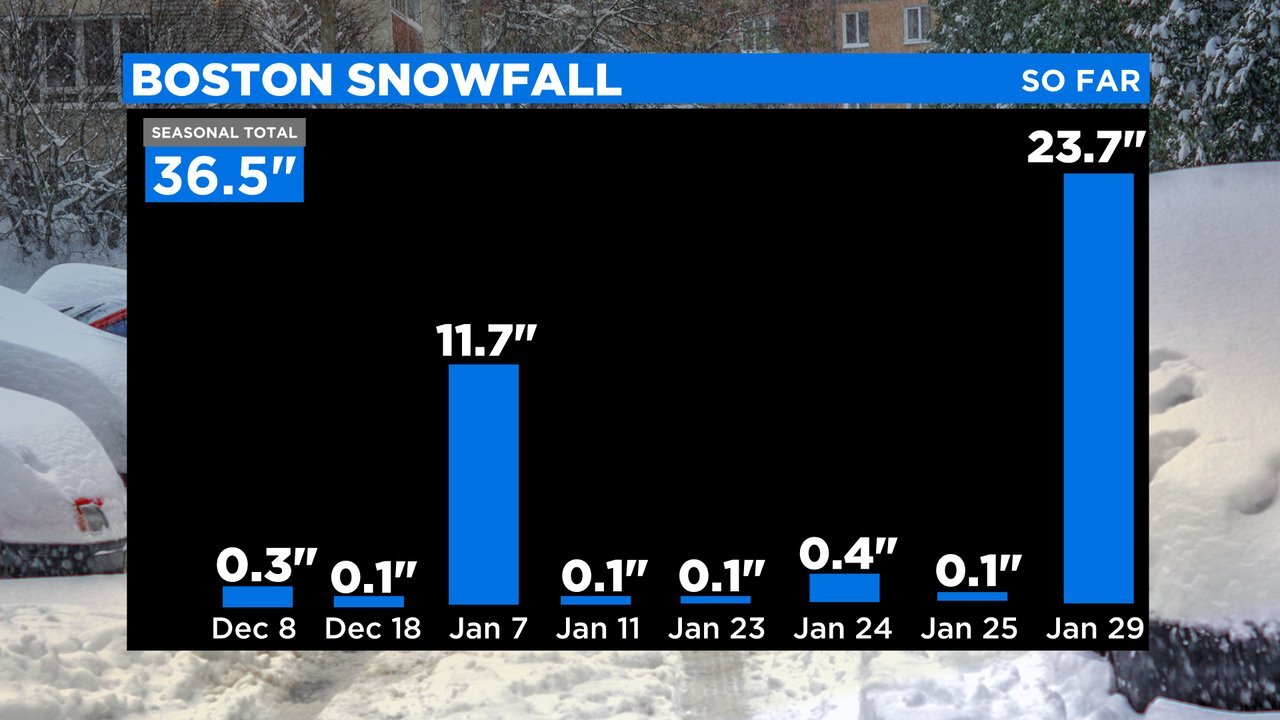
One of the best winter months I’ve seen, up there with Jan 2011, Feb 2013, March 2018. Feb 2015 of course stands alone as the snowiest month ever recorded in Boston. Boston is only a few inches behind last years total for the entire winter, and we still have Feb and March.
-
Just like 10 days ago it looked like we were wasting a favorable pattern that was going to break down and transition to a mild Feb. Now, there’s a raging blizzard outside right now where I live and that warm up looks to be short lived, with a very cold pattern in mid Feb being shown on the long range models. It’s crazy how quickly things changed.
-
OBS/DISCO - The Historic James Blizzard of 2022
George001 replied to TalcottWx's topic in New England
Probably will. There’s no way they finish with under 20 with that band just sitting there and rotting over eastern mass all day. 30 is possible -
I completely agree. The inland runner is trending east and there’s a very strong high to the north, despite all the warmth surging in at the upper levels.
-
OBS/DISCO - The Historic James Blizzard of 2022
George001 replied to TalcottWx's topic in New England
Yep, just south of Boston is looking like the jackpot area. I saw reports that some areas are getting 4+ inches an hour. -
OBS/DISCO - The Historic James Blizzard of 2022
George001 replied to TalcottWx's topic in New England
All of a sudden this winter went from meh to great -
OBS/DISCO - The Historic James Blizzard of 2022
George001 replied to TalcottWx's topic in New England
He’s Boston area right? I’m like the very NW edge of the death band and have like 11-12 inches, looks like we are on track to end up with like 2 feet. Areas in the center of that band gotta be at 20+ already. He’s gonna get 3 feet lol -
OBS/DISCO - The Historic James Blizzard of 2022
George001 replied to TalcottWx's topic in New England
What a storm, for us in eastern mass this is a big one, up there with the Jan 2015, March 2018, and Feb 2013 blizzards. -
Interesting… a second low formed. In eastern mass, the snow rates have been increasing over the past few hours. My area is up to 8-10 inches or so and areas se that have been in the banding for longer are well over a foot. If that second low ends up becoming dominant, we may see the death band strengthen even more, more snow getting thrown back west.
-
OBS/DISCO - The Historic James Blizzard of 2022
George001 replied to TalcottWx's topic in New England
He’s a huge weenie, he’s one of us lol -
OBS/DISCO - The Historic James Blizzard of 2022
George001 replied to TalcottWx's topic in New England
I woke up, looked outside and only saw like 3-4 inches of snow. Then at the low position and saw it was east, and got worried that the storm was going to bust. Im feeling a lot better about it now, my area is up to like 7-8 inches now with extremely heavy snow. How much do you have? Looking at the radar it looks like your area has been in the banding all morning, you gotta be over a foot by now. This is like that epic Jan 2015 blizzard all over again, what a storm! -
OBS/DISCO - The Historic James Blizzard of 2022
George001 replied to TalcottWx's topic in New England
Man idk how it’s gonna snow that much when the low is so far east. I only have a few inches right now (though it appears the snowfall rate has increased over the past hour or so). Hopefully they see something we don’t, possibly the low getting tugged back NW?