MN Transplant
-
Posts
17,854 -
Joined
-
Last visited
Content Type
Profiles
Blogs
Forums
American Weather
Media Demo
Store
Gallery
Everything posted by MN Transplant
-
mPING report of snow and weak radar returns around Chesapeake Beach
-
Sunday is going to be nasty with temps in the teens for much of the day and wind gusts at least into the 30s.
-
The NAM 3km is doing pretty well IMBY, but isn't cold enough in the low-lying areas. The HRRR is the inverse. The globals are having all sorts of problems. The fundamental answer is that the models just have so much trouble handling the very stable winter boundary layer and how much mixing there is.
-
I'm just guessing here, but I would think that we are looking at two things: 1) Confirmation bias. Unless there is an actual study showing that this is true, it may just be the snow weenie in all of us that remembers these types of changes. 2) But if the anecdotal theory is actually true, it might be that the patterns that result in an H5 feature going through the deep south may simply be more predictable due to the strength of the blocking required to make that pattern happen.
-
The fundamental problem with the lows is that the airmass is potentially historic in length, but not severity. So, we are getting very cold in the favored spots, but overall it isn't just enough of a cold airmass to challenge some of the more fun numbers for many of us.
-
Boxing Day was worse because it was hitting up north too.
-
I'm not giving this one a lot of my energy. Glad I'm not forecasting for NC/Richmond/Norfolk!
-
Even though it is a whiff, you have to admire a 500 low track of Minneapolis to St Louis to Atlanta on the RDPS. That's a unique one.
-
https://www.meteo.psu.edu/ewall/NARR/2000/us0125.php
-
I'd be more inclined to think there is a N shift late if we had already started a trend in that direction. But we aren't seeing that. GFS, GFSAI and AIFS are rock solid for a 500 pass through SC. The Euro and GDPS dipped even further to Savannah.
-
3” QPF all snow around Salisbury. Fantastic.
-
What a gorgeous 500 pass for Richmond
-
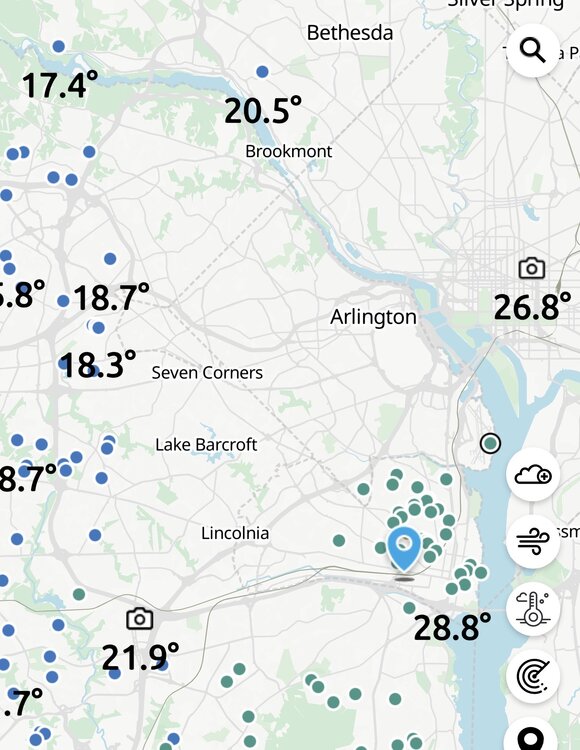
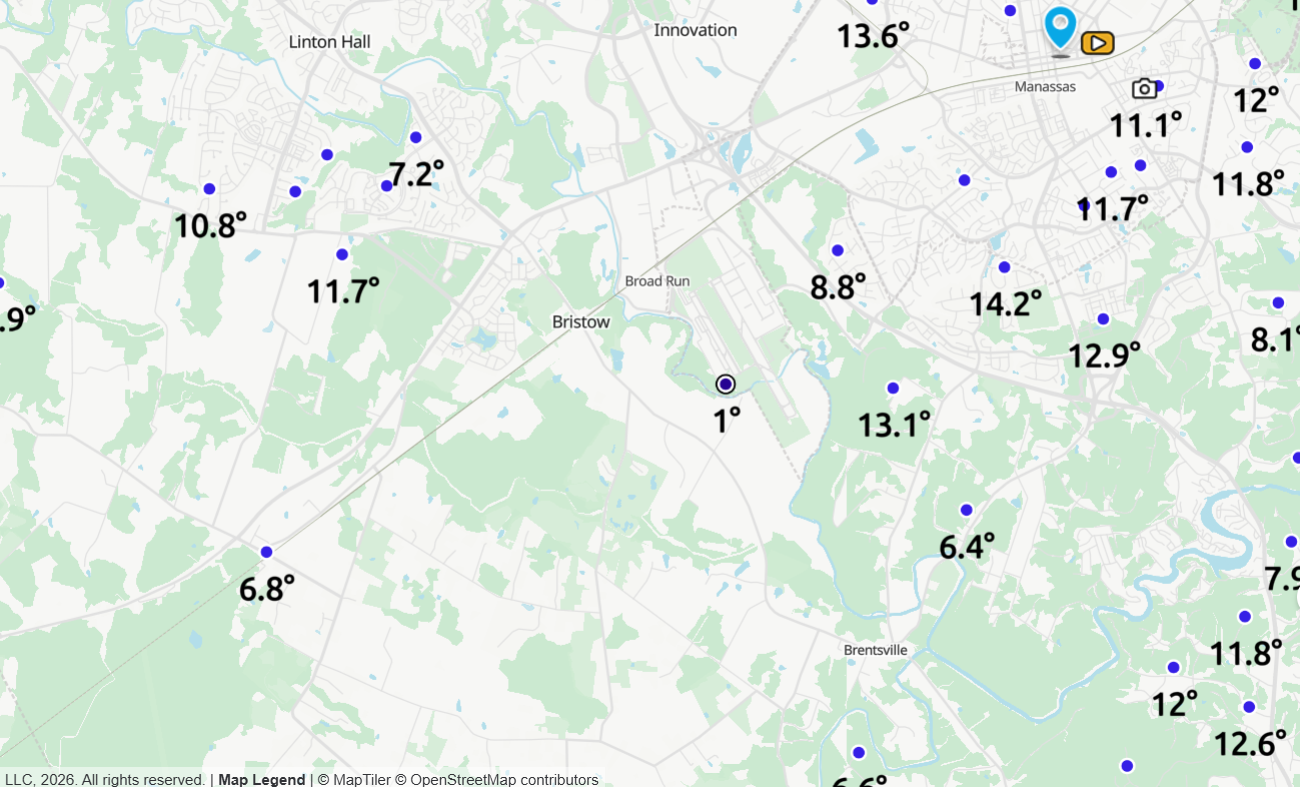
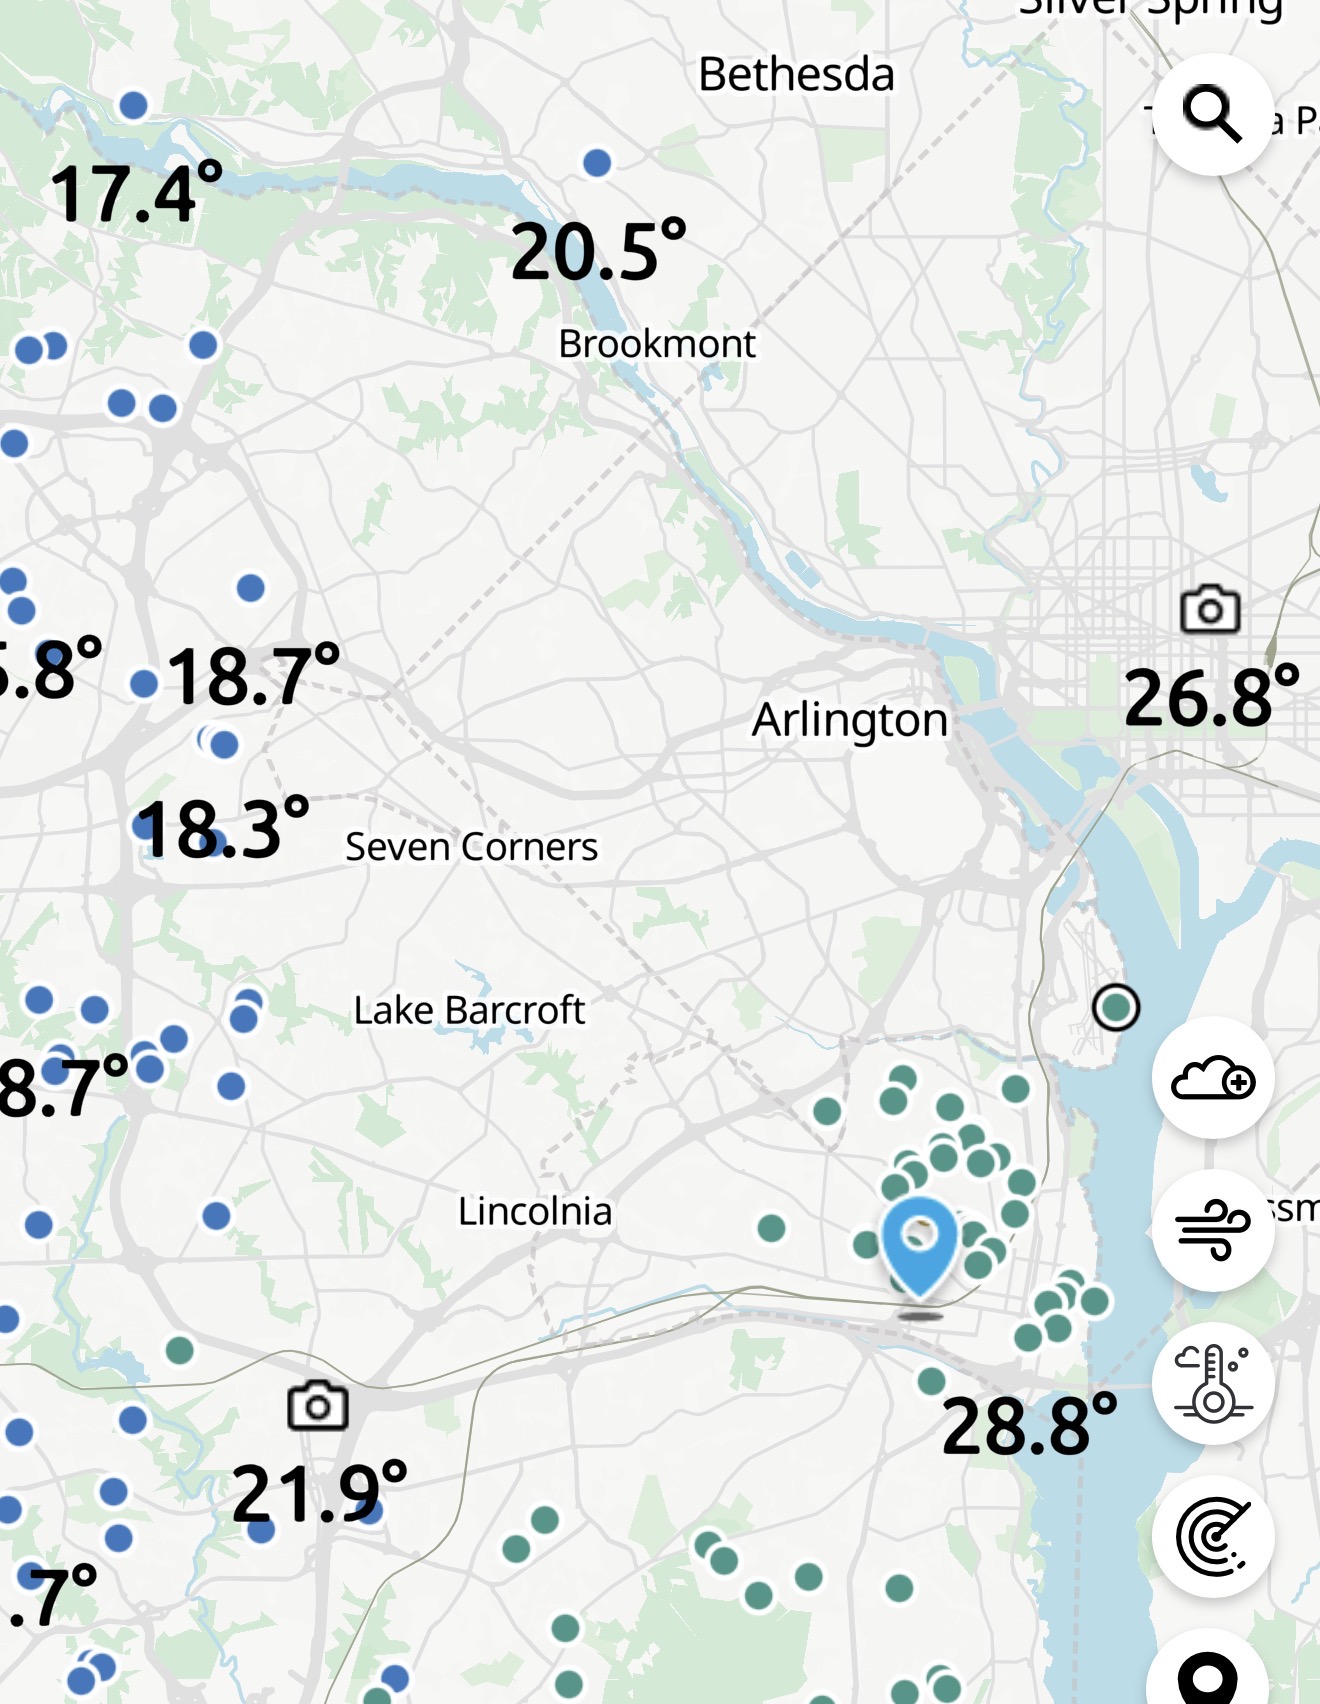
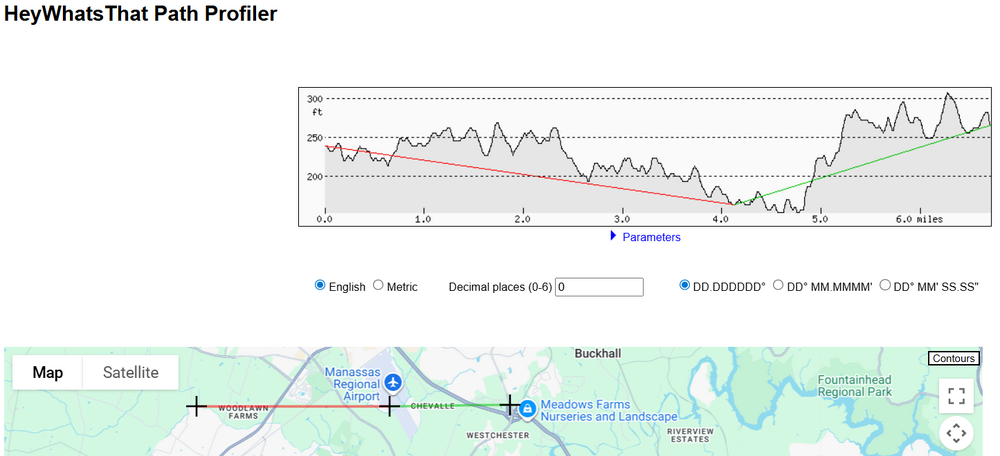
If you want a perfect representation of microclimate and cold-air drainage, check out Manassas this morning. The airport sits at a low point, only 50-100' below the surroundings, but enough to perfectly bottom out in calm conditions.

-
Even though the HRRR was too low and the 3km NAM was too high, I'll give them both credit for correctly calling that temps would keep slightly falling after sunrise. IAD is still sitting around their low of 3 or 4, BWI is still about 13. I got down to 8.6 at 8am. But our big local winner looks like it is Manassas at -1. Colder than any of the MD Mesonet sites except for Garrett Co.
-
January 24-26: Miracle or Mirage OBS Thread!
MN Transplant replied to Jebman's topic in Mid Atlantic
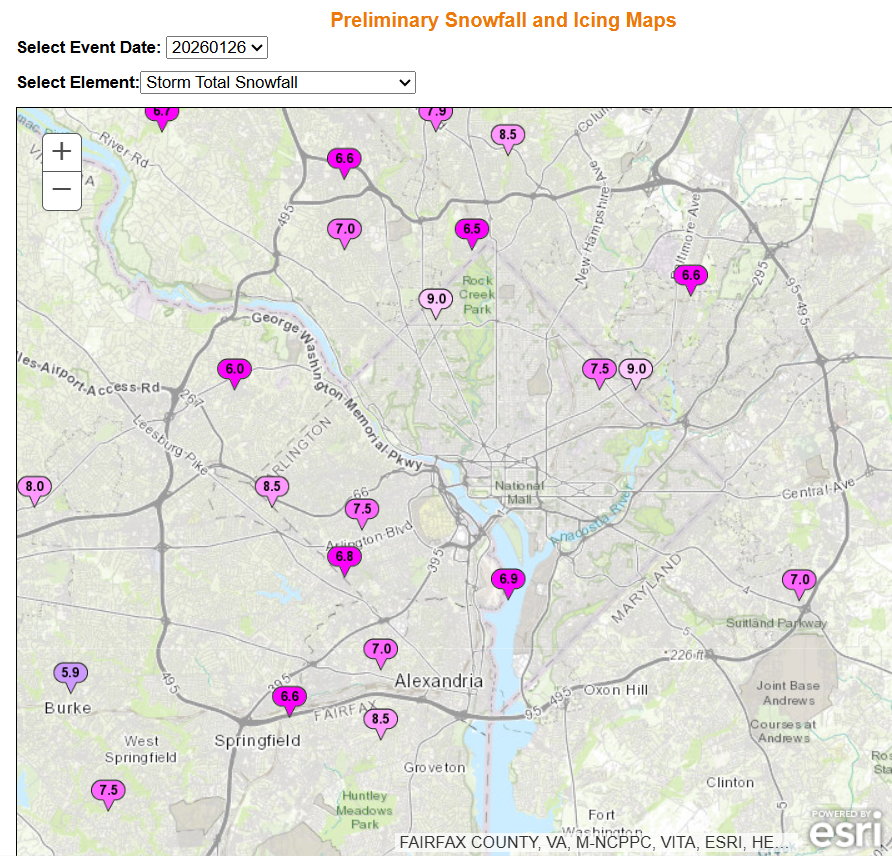
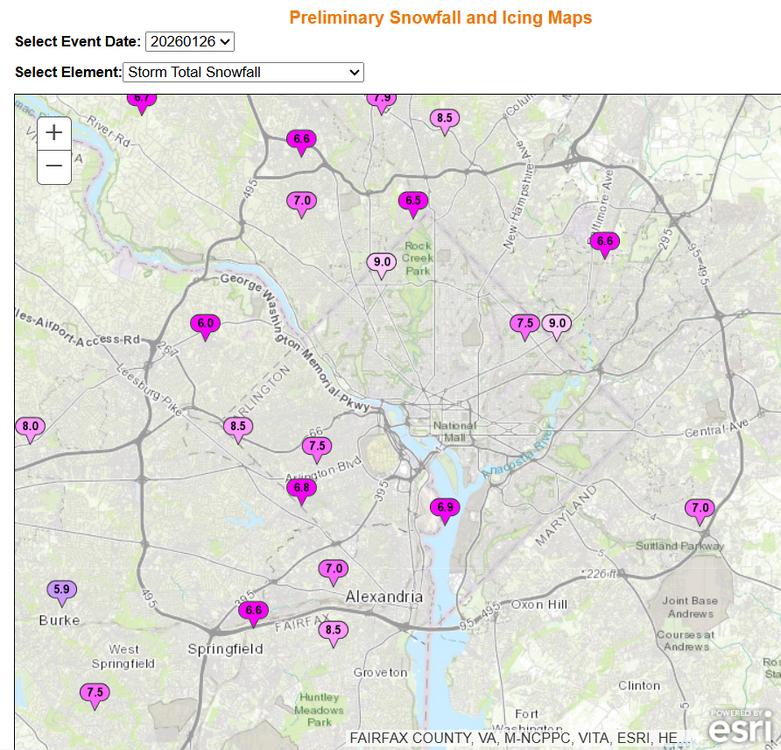
I think they got about 7" like what was reported. I got 8.5" and they had less precipitation than I did, which was particularly important in the snow period before the sleet. The colors don't mean anything other than more or less snow/sleet. -
January 24-26: Miracle or Mirage OBS Thread!
MN Transplant replied to Jebman's topic in Mid Atlantic
Roger - my sleet was 2:1 -
I think I'd go in-between. Most of us will be single digits, with the favored spots (IAD, Manassas in VA) having a better chance at 0.
-
January 24-26: Miracle or Mirage OBS Thread!
MN Transplant replied to Jebman's topic in Mid Atlantic
How much snow/sleet do you think DCA actually received?
-
Assume we are tracking the cold in this thread. 24.0 and the wind is picking up. Models are all over the place on lows tonight, but the favored areas may make a run to 0.
-
12/5 - 1.9" 12/14 - 1.3" 1/26 - 8.5" Total - 11.7"
-
Rooting for George now!
-
January 24-26: Miracle or Mirage JV/Banter Thread!
MN Transplant replied to SnowenOutThere's topic in Mid Atlantic
My pro-tip from this morning is to pull out the garden shovel. The plastic snow shovels are no match for this mess. -
January 24-26: Miracle or Mirage OBS Thread!
MN Transplant replied to Jebman's topic in Mid Atlantic
Funny thing is that it was kind of a calculated number. At no point did I ever have more than ~7.7” on the ground. A lot of compaction with the weight of the sleet on top. But I also couldn’t find any place that would legitimately give me more than 3.5” of sleet. So, yeah, a 2:1 ratio on the sleet. -
January 24-26: Miracle or Mirage OBS Thread!
MN Transplant replied to Jebman's topic in Mid Atlantic
I’m going to call it 8.5” total. Insane precip at 2.33”. -
January 24-26: Miracle or Mirage OBS Thread!
MN Transplant replied to Jebman's topic in Mid Atlantic
It isn’t N/S, it is E/W, and it is insanely sharp. I popped up to 21 but have fallen back to 18.