

ORH_wxman
-
Posts
93,098 -
Joined
-
Last visited
Content Type
Profiles
Blogs
Forums
American Weather
Media Demo
Store
Gallery
Everything posted by ORH_wxman
-
HRRR actually strengthens that band out west as it moves into E MA/RI in the next 2-3 hours. Could see another 1-2".
-
He's in Westborough
-
Def getting some redevelopment on the backside...some weak fronto going on there still
-
Pushing 4” now
-
Getting smoked right now.... Incoming for Ginxy too in the next few min if not already
-
Snow is getting dry too. Temp down to 29F
-
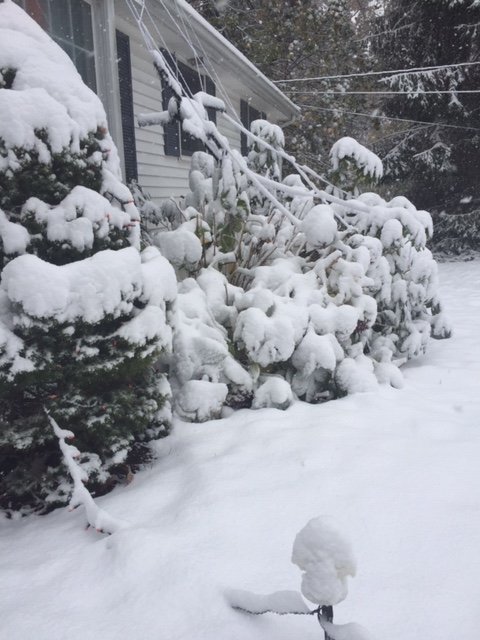
About 2.5” in ORH
-
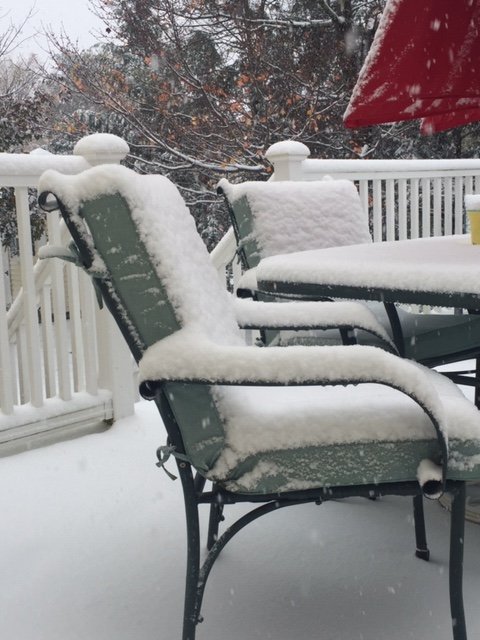
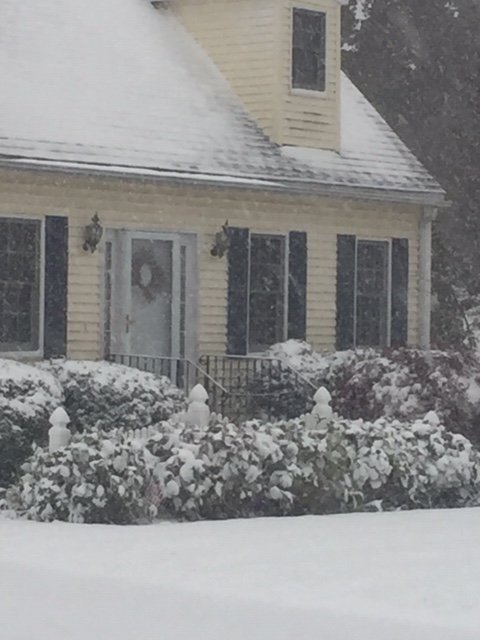
Took this about 15-20 min ago
-
On winter hill now. Getting smoked.
-
Getting road stickage here now. Temp crashing. 30.9
-
Down to 32.5. ORH is 31 now. Steady light snow with stickage to cars, deck, bushes. Nothing on pavement or ground yet.
-
Main show still W and SW but it’s organizing.
-
34 and mangled/wet flakes here. Was in a little lull in precip for a little bit. Starting to fill in though. Main show is still W and SW. peak for SNE looks to be between about 9 or 10am and noon. HRRR really goes crazy around 10-11am. Same with RAP.
-
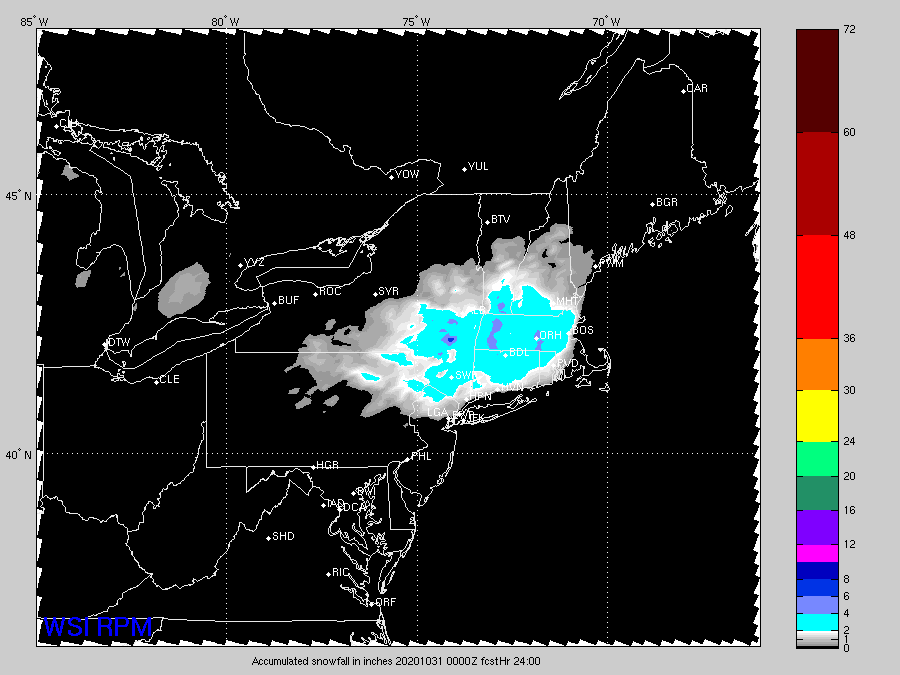
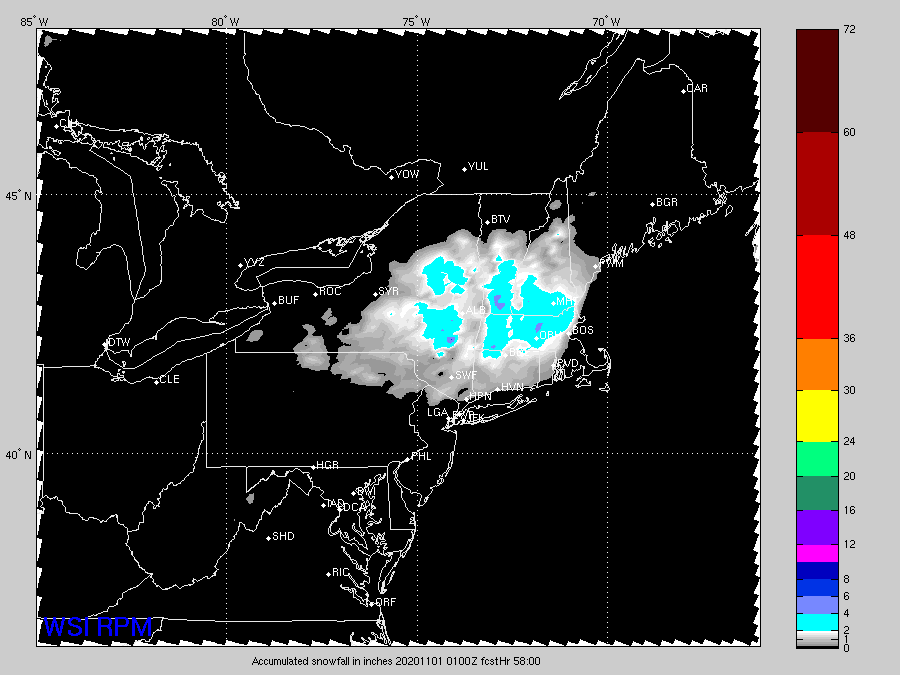
00z RPM
-
21z RPM
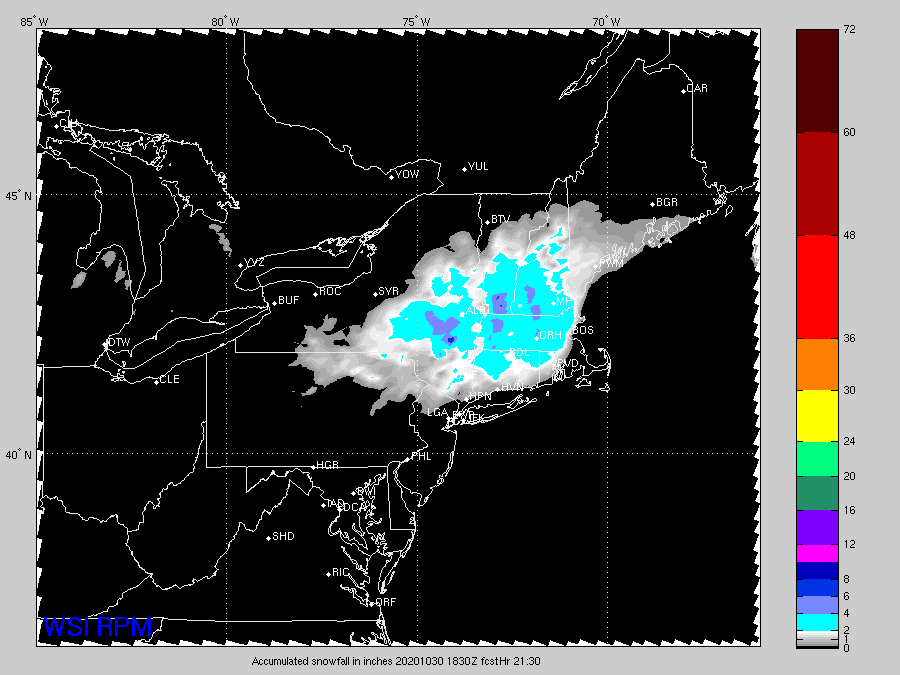
-
FWIW that is not the same as other clown maps. It tries to adjust the ratio. That said, it wasn’t as impressive as runs like the euro. I think most will see in the 1-2” range anyway. Maybe some spot 3”+ amounts in higher terrain if this pops like some guidance shows.
-
HRRR gone wild. I'd probably slice those numbers in half to get the true forecast.
-
Foxborough jackpot on 18z NAM?
-
Might not be a bad guess for the jackpot outside of some peak in S VT...there or maybe somewhere in the Berks.
-
Not quite as crazy as last night....though much better than some dud runs overnight/earl this morning
-
Jackpot pike region.
-
Pretty negligible though....very nice period of snow over a chunk of SNE tomorrow AM/midday.
-
Euro coming in a hair flatter than 06z. That 06z run may have been the peak.
-
Yeah some of these models are so cold....then you have the RGEM, lol.
-
pivotal weather will have the euro stuff for free including clown maps. It has most other models too.


