ORH_wxman
-
Posts
93,098 -
Joined
-
Last visited
Content Type
Profiles
Blogs
Forums
American Weather
Media Demo
Store
Gallery
Everything posted by ORH_wxman
-
You gotta post the MODIS image later. When the sun is a little higher I’m sure it’s gonna look crazy.
-
The 1936 reading was at Logan airport according to the threaded record location details. Seems like Logan became official site of obs on January 1st, 1936. Hard to believe it actually got to 25F in the harbor there but I guess it’s correct. Their 28F reading this morning is tied for the 2nd coldest reading at Logan in October though. Ties 1976 and 1940.
-
Yeah the pack took forever to melt. It was a solid week at least but the temps never got this cold afterward. It was just mostly 40s and 50s and because there was literally 15-20” OTG and no warm rainstorms, it took a while. Anyways, looks like the 00z NAM was on crack. Other guidance more tame. Still gotta watch for snow shower Tuesday morning though. .
-
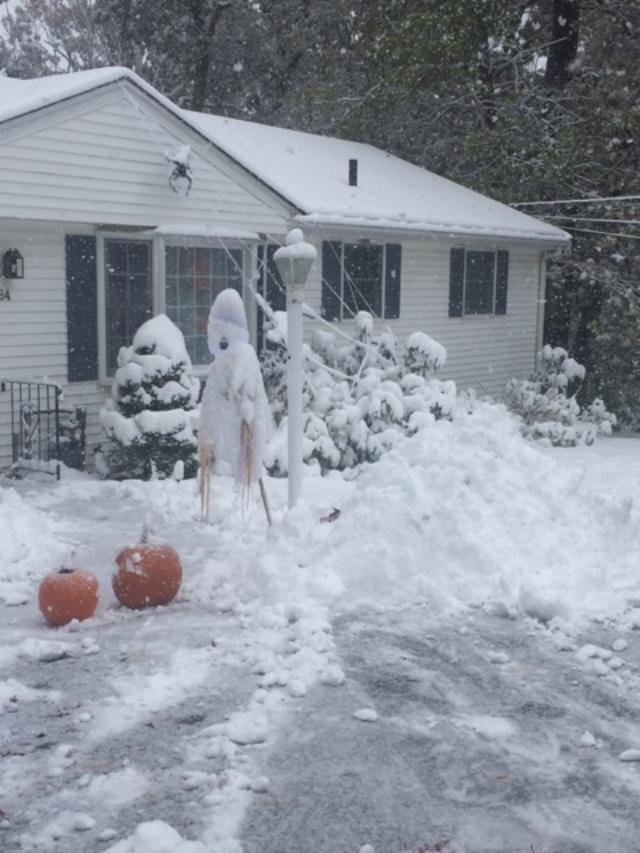
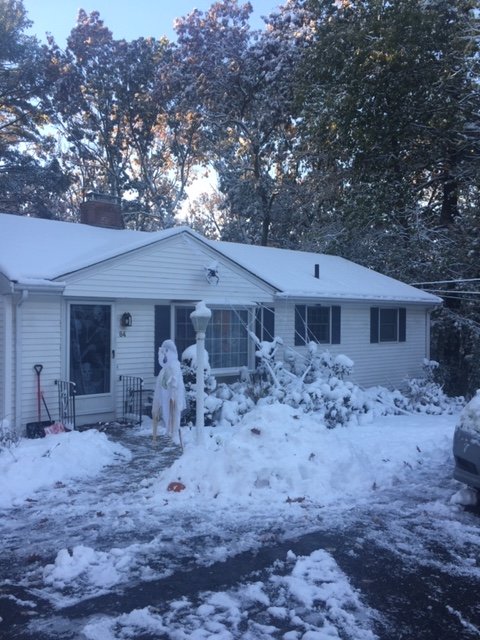
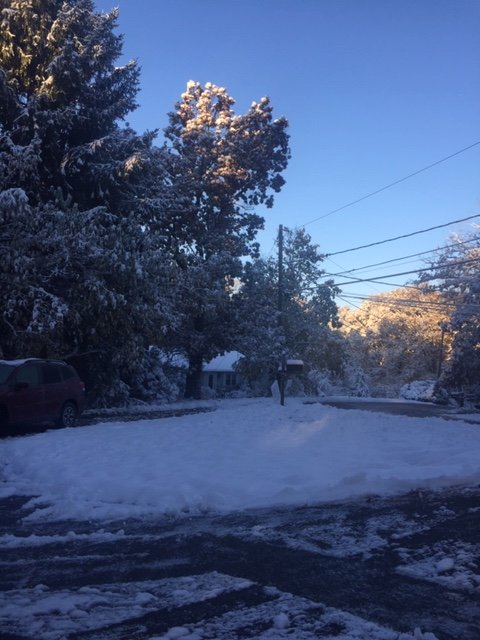
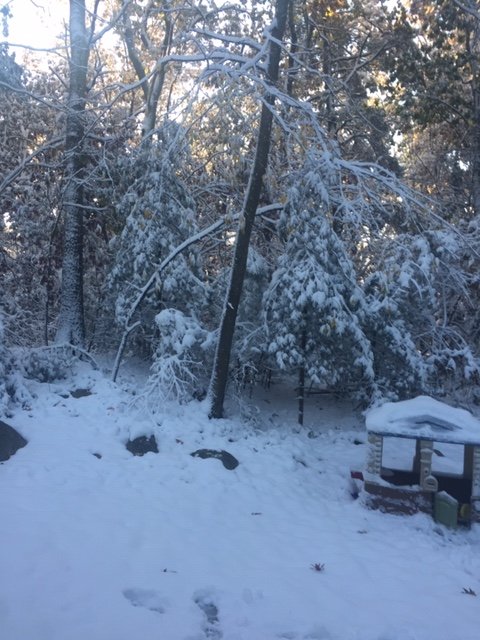
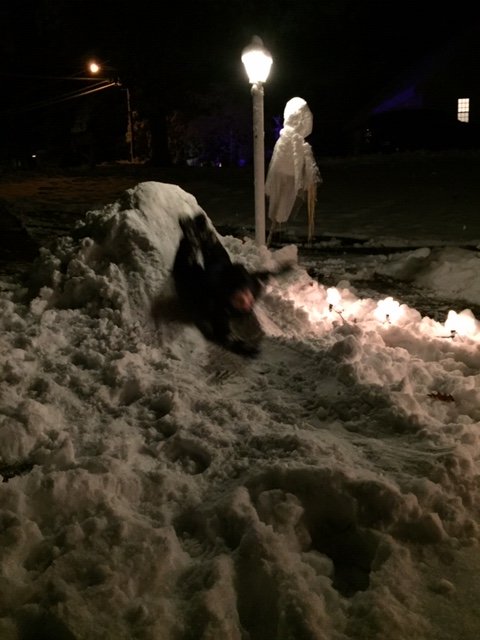
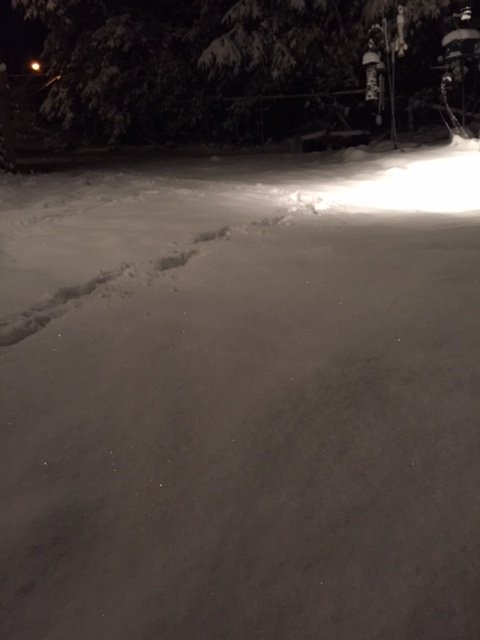
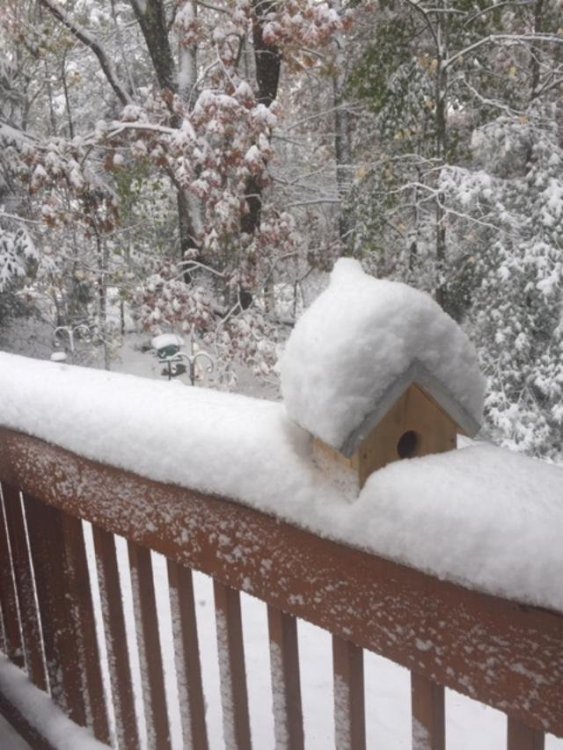
What a landscape this morning
-
Yeah it’s really hard to get an overperforming snow event in October. I was slicing a lot of those clown maps by close to half...when even the full ones weren’t quite enough...LOL. The last 6 hours amped up pretty hard at the last second. I had commented earlier how the HRRR nailed the afternoon banding that some of the conventional longer range models did not. That really put the event over the top as those few hours were easily dropping 15 to 1 (or higher) fluff on top of the denser stuff.
-
What the hell is the NAM doing? Its wrapping snow into SNE too now and dropping temps into the 20s during peak daytime heating on Monday.
-
The 10/10/79 storm was def more anomalous than this one....at least for most of SNE. You can argue right on the immediate coast near BOS that this one was clearly more anomalous due but anywhere off the water that isn’t the case. This is pretty high on the list though even for a place like ORH. Prob only ‘79 and ‘11 were more impressive.
-
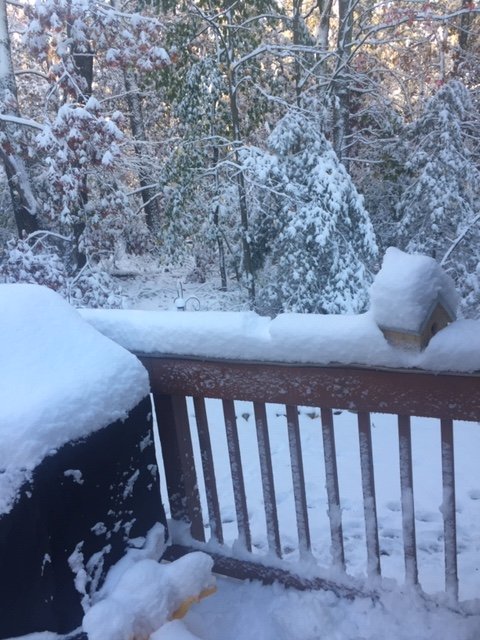
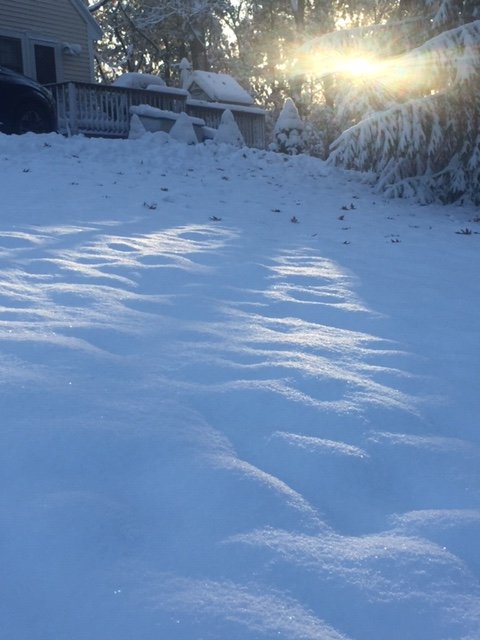
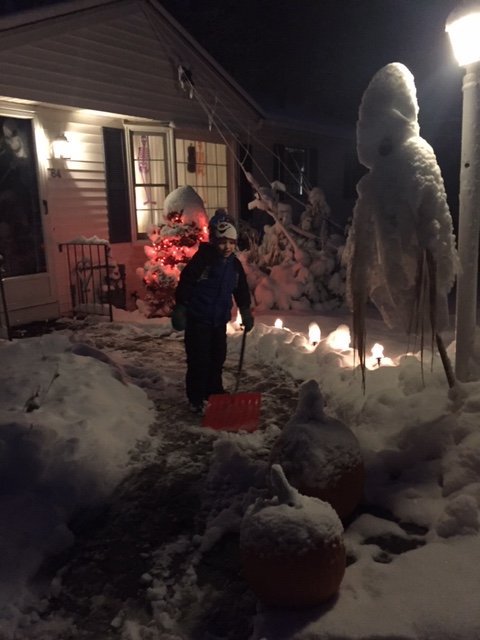
Snowpack is still total powder and sparkling at this hour in the flood lights. It looks like a mid winter evening. My son had a blast shoveling and building a snow slide, lol
- 860 replies
-
- 10
-

-
Gotta watch Tuesday morning for windexy type squalls. Crazy to be talking about that a couple days into November after already getting a legit October snow event for many.
-
Your area may even get some commahead backlash synoptic stuff....which of course may be upslope-enhanced too. The trend has been to really redevelop that low over S Maine or even a little further south near BOS.
-
This snow looks like mid-winter snow. Just the consistency of it. Seeing it a little bit fluffy.
-
Steady as she goes....slow exit
-
RGEM was putrid. NAM def did well...Euro did too. EE rule!!!
-
HRRR earlier really nailed this final burst moving through eastern areas now. It had it strengthening the the whole time while some other guidance was weakening the ending.
-
Incoming for scooter to T-blizz....this band went through here a little while ago and was ripping.
-
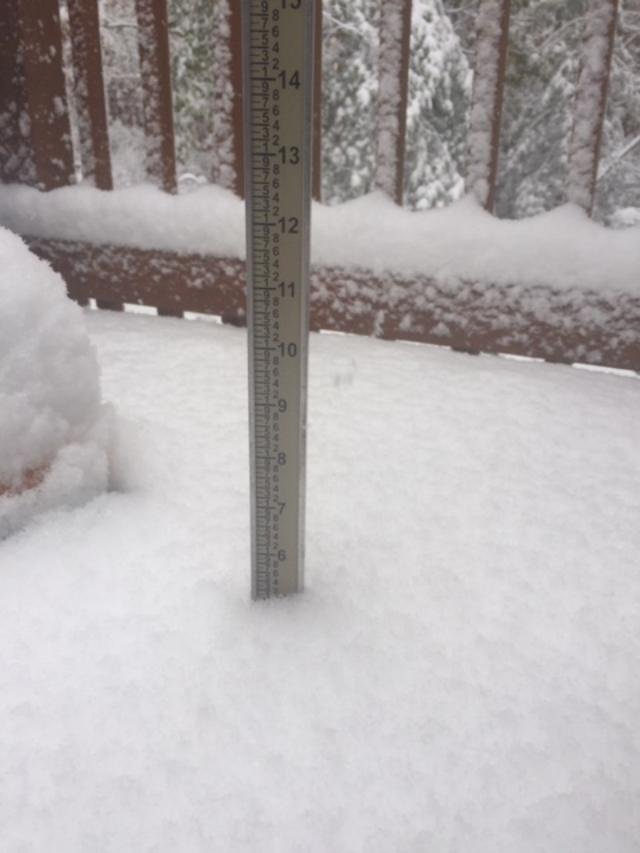
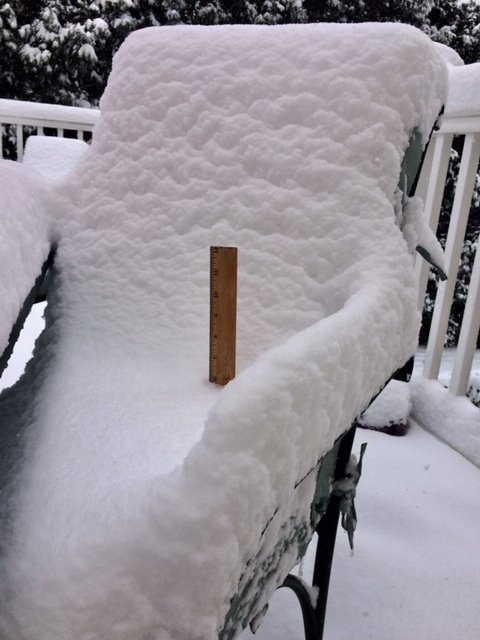
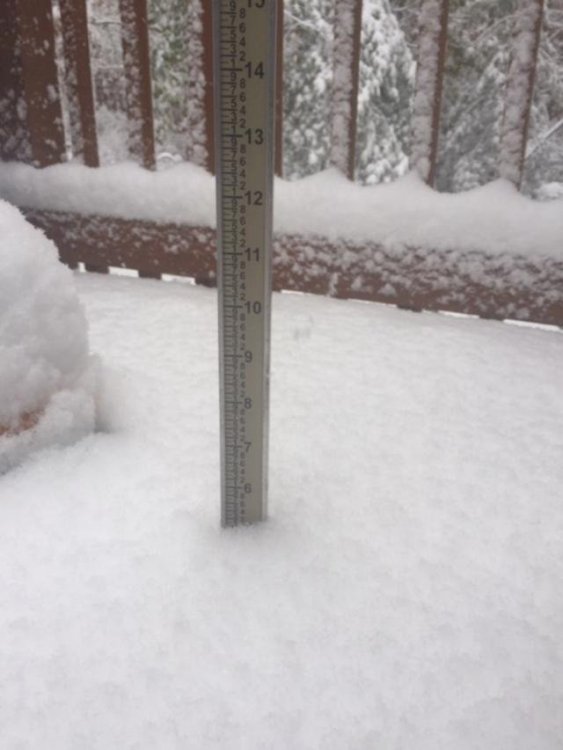
Had to move my pumpkins before they got buried.....my son wants to carve them tomorrow, lol Over 5 inches here.

- 860 replies
-
- 10
-
-
Yeah I was sort of giving a dry understatement by saying "not often"....lol. In fact, my bet is that Logan has never been 30F or colder at this hour in October since records were kept. I think Brian (dendrite) has previously posted temp records on an hourly bases for stations...I wonder what BOS record cold is for October during the midday hours. This has to be it.
-
Not often to see Logan Airport at 30F in early afternoon in October
-
That band is really starting to crank as it moves east. Still a ways to go for eastern folks...esp SE folks.
-
Yeah it is kind of surprising it didn't. You look at Blue Hill and see plenty of 1-4" events and then a couple 6"+ events (1979 and 2011)....you figured somewhere BOS had enough N wind or NNW during a snow event in October to get a couple inches, but I guess not.
-
No, that pic is from Holliston. I've been driving around today though.
-
Scooter, I checked Hingham coop, looks like their record (since 1960 when the coop started) is 1.0" in 1962.
-
BOS is a total pit....really anywhere right near the coast is so hard to get legit Oct snow. I'm sure it's a bit different for some place around Sharon or Foxborough (hell, we all remember the 3" in 2009 during the Patriots game there)
-
Haven't got an official report from BOS yet, but I think they must have already broken their biggest October snow on record? Logan's previous record was 1.1"
-
You can kind of see it slowly strengthen already