ORH_wxman
-
Posts
93,098 -
Joined
-
Last visited
Content Type
Profiles
Blogs
Forums
American Weather
Media Demo
Store
Gallery
Everything posted by ORH_wxman
-
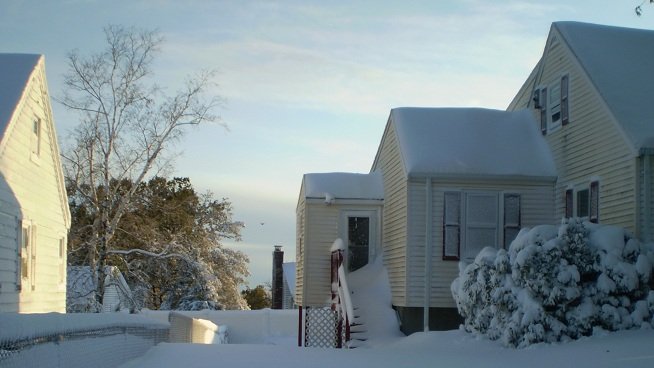
Yeah if you were near Boston in 2015, you got about 90-100" in 3 weeks.
-
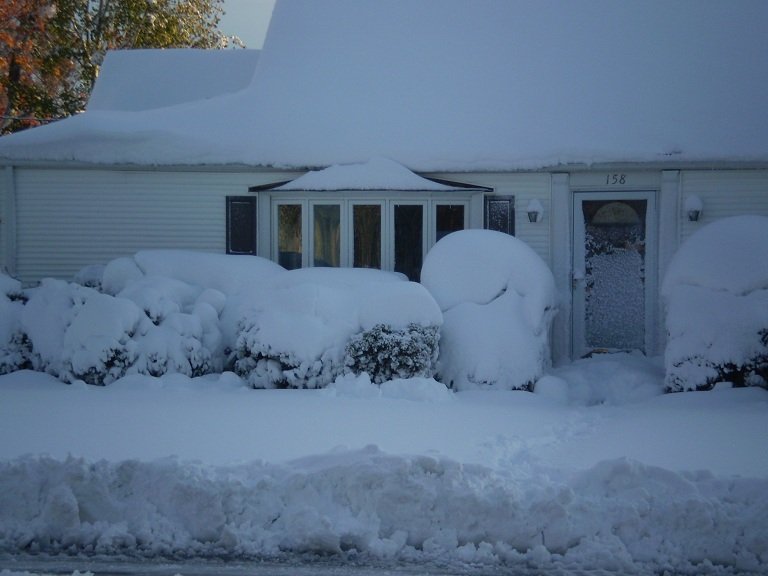
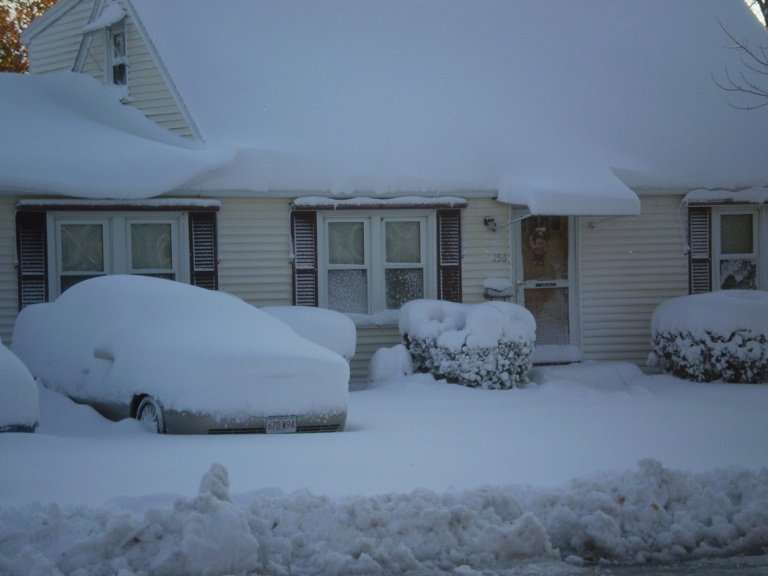
October 2011 in ORH
-
Yeah that’s Tip though I think technically Jerry is the last one to go on that. Just to the right of Tip a millisecond later you see Jerry flying by. LOL LOL, he leaves everyone speculating whether I actually jumped or not.
-
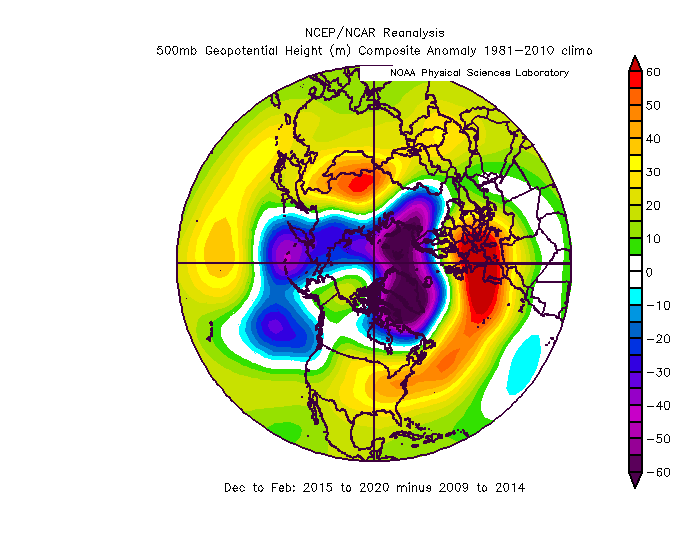
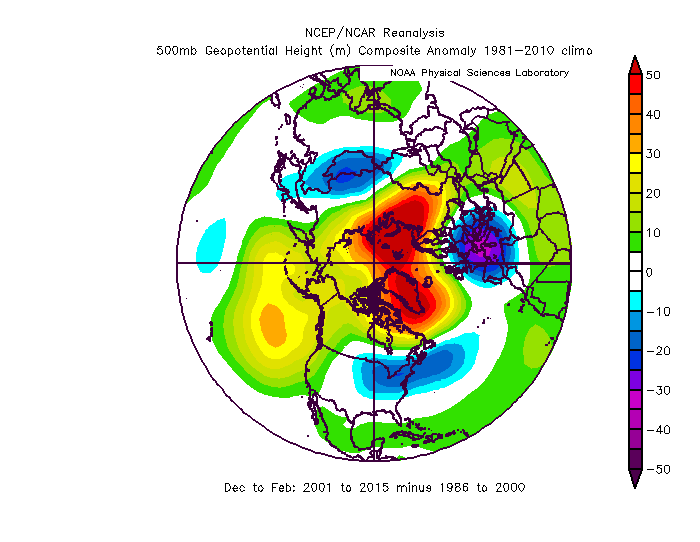
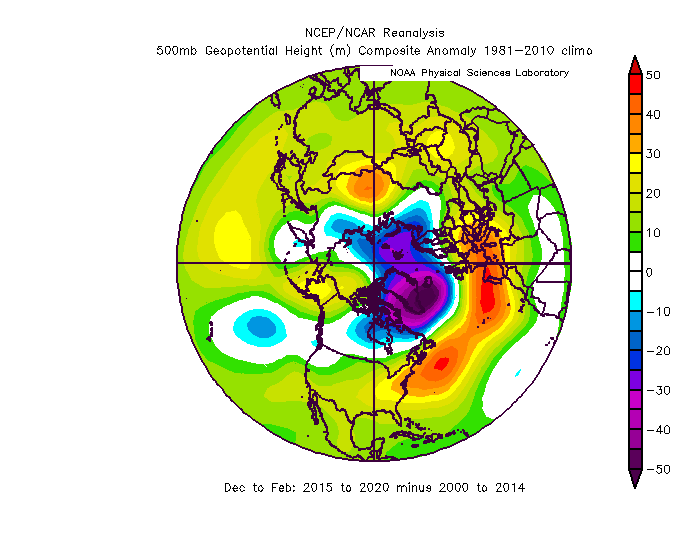
I do think the HC/FC gradient is being significantly enhanced at our latitudes by the +AO of the past 5-6 seasons or so after we had a pretty good run of strongly -AO seasons (sans '11-'12) in the previous 5 years. So my guess is some of the gradient issues relax during our next bout of -AO patterns. Of course, we also aren't entirely sure how much the HC expansion or climate change affects the AO itself. We have seen competing theories in the literature. Here's another version of the map from yesterday. Instead of comparing the last 5-6season to 2000-2014, I compared it to only 2009-2014...the AO region sticks out even more.
-
I agree it seems to have a larger effect on a multi-year scale rather than a shorter time frame. It's likely more one of those things where if we get it strongly positive or strongly negative leading into a month, it can help sustain or inhibit a pattern all else equal.....i.e., it isn't a dominant driver but can act as a compliment.
-
I love how Tip jumps near the end....he's like "ahh screw it, I hate 50F with warm car seats afterall"
-
Yeah and Sept might still be neg too...but the last week or two has def trended strongly toward positive....I had posted the SSTA map yesterday or the day before. We'll see if it reverses again...I'd expect it to, but no guarantees.
-
Pretty hard to find a +QBO/+PDO winter in a La Nina....but 2016-2017 is basically the only one. You could maybe include 1985-1986 but that wasn't really a La Nina. It was a negative-neutral that fell just short of weak Nina. The PDO could still go solidly negative....it can change quickly. Though we're clearly not in a longer term deep -PDO like we were in the late 2000s/early 2010s.
-
'09 and '11 were obviously huge Januarys in +QBO Ninas. 2017 was a furnace, though it did have a few snow events. If we want to extend back further with +QBO Nina Januarys....Jan 2000 was actually pretty cold/snowy in an otherwise garbage winter. Jan '76 was frigid and snowy and Jan '72 was mild and snowless but then rebounded big in Feb...somewhat rare for Ninas. So there's definitely some decent precedent for cold/snowy Januarys in +QBO La Ninas.
-
Oh wow, I actually have the falling into the hole GIF saved....
-
Powderfreak is next to me in the reindeer sweater pic....LOL. Eric made him like 5 feet tall. Tip is in the other toaster bath pic i posted. I had two in that post...one of Kevin and one of Tip.
-
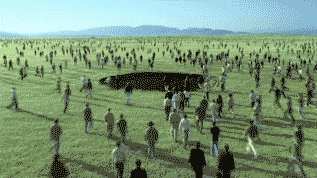
The one where everyone was walking into the giant hole was always a good one.
-


-
Here's 2000-2001 to 2014-2015 minus the previous 15 years.....we definitely had a much more favorable arctic in those years versus the late 1980s and 1990s on the whole.
-
Here's the last 5 years compared to the previous 15....aside from any contribution by Hadley cell expansion, it's clear we're in a phase of much lower heights over the AO region. As we both know, that will enhance the height rises over the mid latitudes. Esp over Eastern North America and Europe.....exactly where we see the largest positive anomalies on that comparison.
-
Tip just fainted from Hadley cell nightmares.
-
I'd say best match for ENSO/QBO are 2008-2009, 1971-1972, 2016-2017 in that order.....maybe 1975-1976, 2010, 2011, and 1985-1986 in the next tier.
-
Yeah....a lot can still change obviously. But it's far from a lock we have a solid -PDO.
-
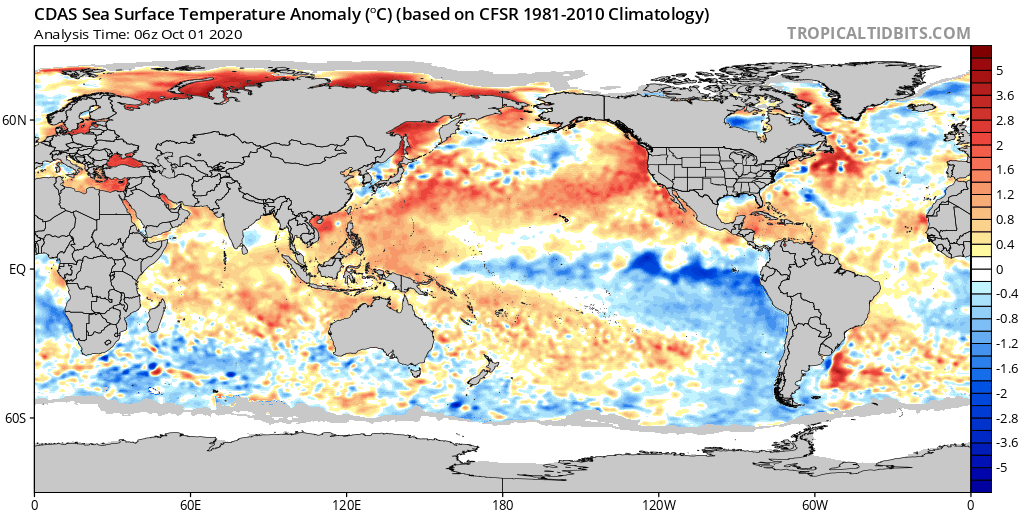
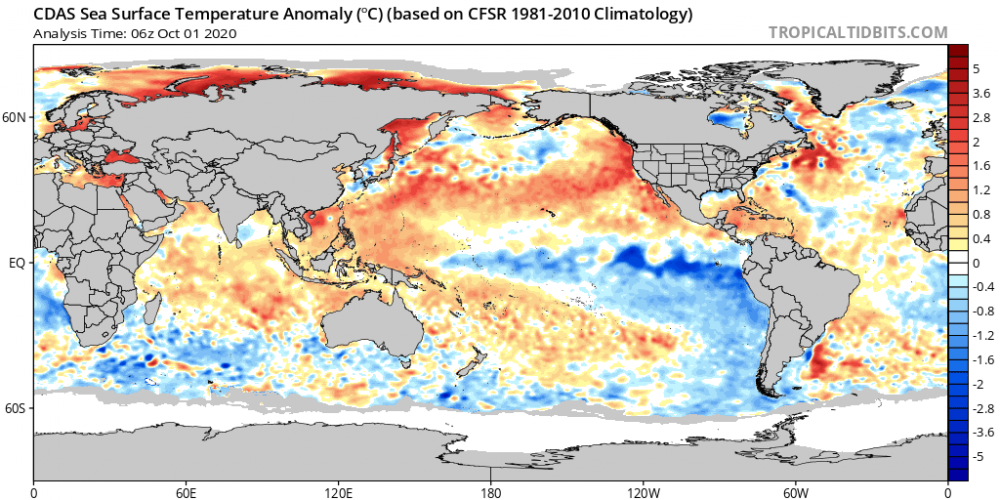
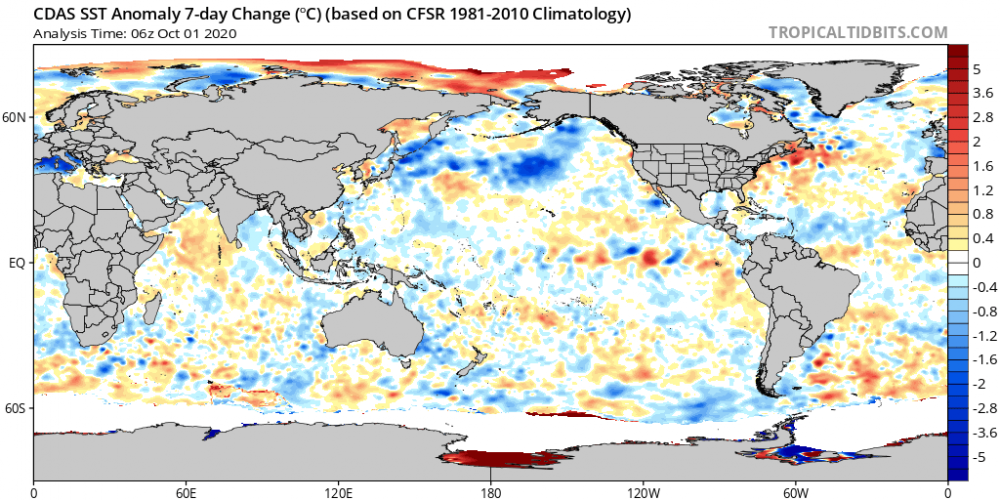
I thought we might be descending into a solid -PDO this winter about 3 weeks ago, but that has dramatically reversed the past week or so. Not that I'm complaining, a neutral/positive PDO can be pretty good in a Nina (ala '95-'96, '00-'01)....we'll have to see where this one goes. A lot can change between now and December, but interesting to see nonetheless. First image is SSTA and the 2nd image is the 7 day change. That's a classic look for a +PDO, seeing that warm water wrap up along the W Canada and AK shoreline while it cools south of the Aleutians
-
Subsurface is really cold under about 130W, so it wouldn't surprised me if Nina 3 cools a lot over the next 4 weeks or so.
-
Wasn't the storm like 126-132 hours out yesterday? Why would anyone expect it to stay on the models consistently at that range?
-
Should be interesting to see if this Nina gets a final surge into solid moderate over the next 2 weeks as there is a pretty big easterly burst forecasted in the trades. We actually have not had a Nina well into moderate territory (or stronger) since 2010-2011. This one would be a bit of a late bloomer like '07-'08 whereas '10-'11 was already rocking by mid/late summer.
-
Feb is often pretty mild in Ninas. Sometimes we get away with it though.
-
Yeah sometimes people even think warm ground might be a problem for accumulating snow at 1100 feet with temps in the 20s.
-
I had snow from that as well in 2008. Got a coating on the mulch that evening after it changed over. Wasn’t measurable though.