

ORH_wxman
-
Posts
93,098 -
Joined
-
Last visited
Content Type
Profiles
Blogs
Forums
American Weather
Media Demo
Store
Gallery
Everything posted by ORH_wxman
-
It did...seems like it's going to be operational now on other sites I guess. But it's still the RGEM at 60-84 hours, lol
-
Still waiting for the epic pattern that the Euro seasonal had last winter.
-
We’re definitely getting color on the leaves earlier than my previous 3 years here at this house.
-
I've usually used a longer term average (they have an option for 1951-2010) to compare the years. That idea might need to be reassessed though as we continue to warm....once you warm enough, a solidly below average winter based on 2001-2030 normals might not be below average at all in 1950. Right now, the seasonal variance is still significantly more than the underlying warming trend, but it becomes ever closer as the years go by.
-
Yeah I wasn’t making a moral stance on it...death sucks no matter what...just throwing out an empirical way of measuring it. If you all of the sudden had, say, 70k less deaths than usual over the next 2 years after a theoretical vaccine next year, then you would be able to more accurately figure out how many were killed who weren’t likely to die very soon. You just subtract that number from the overall death toll. If the virus did not “pull forward” a ton of short terms deaths, and most were medium term on the order of a decade, then you would not see the excess deaths lower much at all.
-
I think a real measure will be if when this virus passes us, do we see a lower number of excess deaths. That would imply we sped up a bunch of deaths that might have occurred in the next, say, 2-3 years. I’ve seen that theory thrown around too. Obviously we wouldn’t be able to do that unless we have a widespread vaccine.
-
Yeah let’s keep the politicians out of this thread. We’ve already went down that rabbit hole too far months ago.
-
I mean technically everything is upstream of eachother since we're going around a spherical object.... But yeah, Tip is parsing the difference between what an index says and the "responsible party" for that pattern. I wasn't doing that....I'm merely stating that often a -NAO will be paired with a +PNA/-EPO type pattern, but when it isn't, it's really helpful to have. I'm not here to dispute that something in the PAC is causing that -NAO to occur....I'm just pointing out how helpful it is to occur during a shitty PAC pattern. I've actually often stated that our best snow patterns are -PNA/-NAO/-EPO....kind of a weird trifecta on first glance, but think of something like Jan 2011 or Feb/Mar 2013. But obviously you can do the big snow thing other ways too....see 2015.
-
It seems you are implying there is a covariance and correlation between the EPO/NAO...or PNA/NAO or both....which is reasonable. They both exist and we've talked about it over the years. But I think the discussion was more centered around when the EPO/PNA aren't doing us a lot of favors....that's when a -NAO in the means can help out a lot. We're talking when they are "out of phase" with eachother. An anecdotal occurrence off the top of my head was early January 2009....we had a nice vortex sitting over AK (very temporary I'll add), but we developed the best NAO block of the season during that time which prevented us from torching away all our snow and dealing with storms tracking through Marquette. Instead, we stayed more on the seasonable side of temps and dealt with a couple transition snow/ice events. The same assistance occurred to a lesser extent right before the Feb 2013 blizzard.
-
A -NAO in the means helps keep the cold further southeast than otherwise would happen. I agree with Tip that you want an NAO that fluctuates a lot in it's magnitude to increase storminess, but you still want in negative in the means...or at least neutral. It provides some level of "cushion" when the EPO/PAC side isn't very favorable.
-
Or just get a black hole so strong and displaced south that we get Dec 2007.....
-
There also wasn’t a lot of spread because most summer activities aren’t conductive for spreading the virus. Esp when places like bars and restaurants aren’t open or have restrictions. There’s very little spread in outdoor environments.
-
You can order them fully assembled and get it delivered for like 7-8k I’ve seen. If you’re willing to do a little work yourself, it’s like 3-4K.
-
That was the main cabin. The bunkhouse is separate.
-
Oh nice. Yeah a space that small and insulated well won’t take much to make it very warm.
-
I gotta ask him....is the bunkhouse heated? I didn’t see a wood stove, lol.
-
Nice. Glad they appear to be gone. You’ll still want to get the remnants of the nest out of there at some point. I’d probably pop the cap off outside and check later this fall on a cold day (just to be safe) and clear out the crap in there.
-
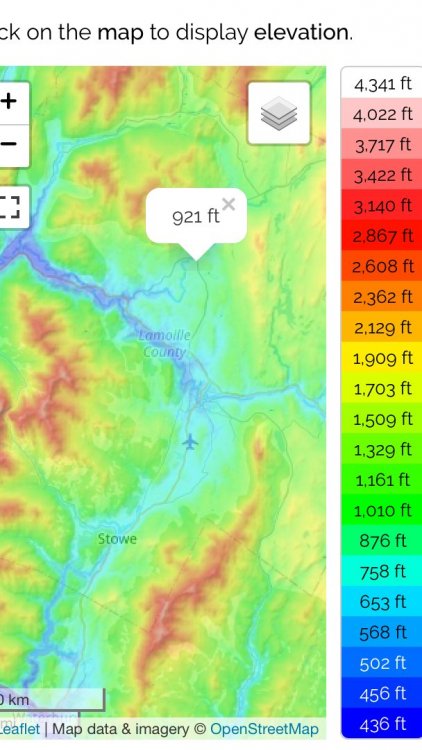
Looks like an excellent weenie spot. A bit over 900 feet nestled in the upslope corridor
-
NAO went steeply negative in October 2009 and basically stayed that way for 15 months. It doesn’t always swing back. Those were the days (really up through 2013) when everyone started thinking that NAO blocking “was the new normal”. Didn’t take long for that idea to bust.
-
@TauntonBlizzard2013 This is a good weekend to maybe try and kill your yellow jacket/hornets nest that is in your vent piping for the range hood above your stove....esp Sunday morning where you might be near freezing. The wasps will be useless trying to fly out in that cold. You could probably pop the cap off the venting outside the house and check it out. But if it's not a big deal, you could prob wait until November or something after several sub-freezing nights in a row probably kill them anyway.
-
That's pretty late though it does happen occasionally. I don't have the jaxa dataset handy, but here are the minimum dates for NSIDC extent: 2020: 9/13 2019: 9/17 2018: 9/21 2017: 9/13 2016: 9/7 2015: 9/8 2014: 9/16 2013: 9/13 2012: 9/16 2011: 9/8 2010: 9/19 2009: 9/12 2008: 9/18 2007: 9/17 2006: 9/14 2005: 9/20 2004: 9/18 2003: 9/17 2002: 9/18 2001: 9/19 2000: 9/11 1999: 9/11 1998: 9/17 1997: 9/3 1996: 9/10 1995: 9/4 1994: 9/5 1993: 9/13 1992: 9/7 1991: 9/16 1990: 9/21 1989: 9/22 1988: 9/11 1987: 9/2 1986: 9/6 1985: 9/9 1984: 9/16 1983: 9/8 1982: 9/9 1981: 9/10 1980: 9/5 1979: 9/21
-
We need someone to build a cabin on the side of Kibby Mountain.....they probably average 300" a winter, lol....best upslope spot that radar can't see in New England?
-
Yeah my guess is Pinkham changed measuring techniques at some point. I agree there is no way they average 100" less per year than Diamond Pond.....though I could easily believe 50-60"....Diamond Pond is one of the best upslope spots in NH. Missing a few storms at Pinkham is a sign of that change in technique too....they probably measure once per day when they can get to the site whereas previously I'm guessing they were more meticulous.
-
Maybe it was the dude in Westminster with an avatar of Dorothy from Wizard of Oz who I was thinking of. He had like 7" or something.
-
It gets exponentially harder to add depth...it really seems to hit a wall in the 35” range. It’s why basically every epic winter for me has had a max snow depth pretty close to each other: 41” 1996 46” 2001 39” 2003 39” 2011 44” 2015 And I’m not even 100% convinced of the March 2001 measurement. It was def over 40” but that snow was so crazy and everyone was going nuts trying to move it that I cannot be 100% sure it wasn’t a contaminated measurement. I did a lot of different spots and tried to get the best number but I was never totally confident in it like I was later on when I became way more meticulous. Bottom line is that it’s really hard to get a true 50” level depth. Not saying it can’t happen or didn’t happen in MD that winter, but I’d always be skeptical as a starting position.


