

ORH_wxman
-
Posts
93,092 -
Joined
-
Last visited
Content Type
Profiles
Blogs
Forums
American Weather
Media Demo
Store
Gallery
Everything posted by ORH_wxman
-
Dec 5/6th major coastal/ west Atlantic cyclogenesis ...?
ORH_wxman replied to Typhoon Tip's topic in New England
If it stays a bit east, I'd want to be in the hills near Sebago up in S ME. -
Dec 5/6th major coastal/ west Atlantic cyclogenesis ...?
ORH_wxman replied to Typhoon Tip's topic in New England
I think they finally old yeller'd that model in 2017 or something. -
Dec 5/6th major coastal/ west Atlantic cyclogenesis ...?
ORH_wxman replied to Typhoon Tip's topic in New England
I like using the 3km once we are inside of 24h. Sometimes it catches a trend before that, but hard to trust it further out. -
Dec 5/6th major coastal/ west Atlantic cyclogenesis ...?
ORH_wxman replied to Typhoon Tip's topic in New England
Yeah 3km is a bit more wrapped up...better for the central interior folks than the 12km run.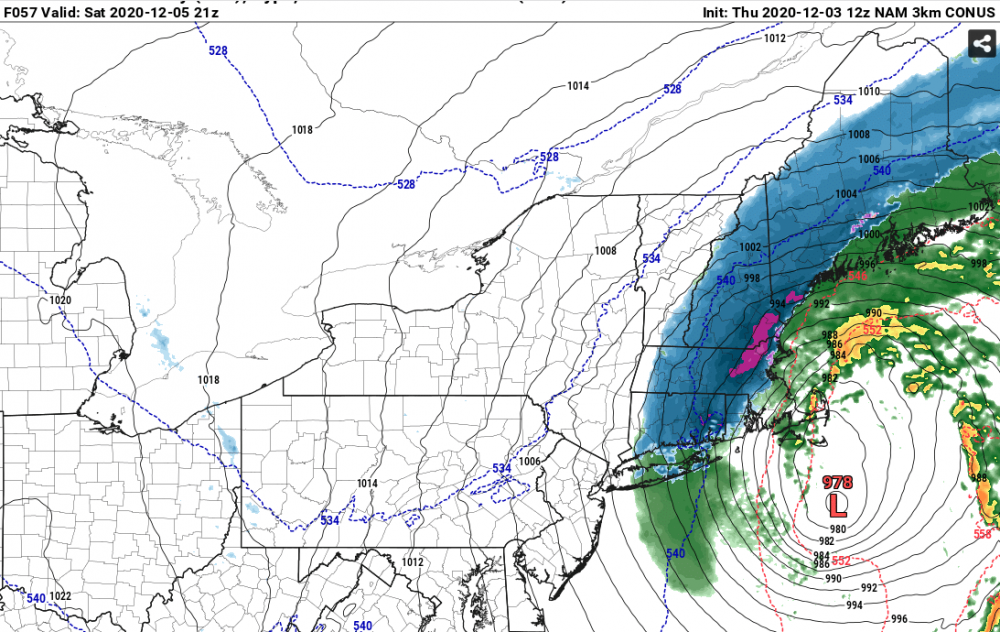
-
Dec 5/6th major coastal/ west Atlantic cyclogenesis ...?
ORH_wxman replied to Typhoon Tip's topic in New England
Ha, NAM says that Zwyts and Randy should just hang out in PWM. -
Dec 5/6th major coastal/ west Atlantic cyclogenesis ...?
ORH_wxman replied to Typhoon Tip's topic in New England
E MA getting destroyed at 54-57h. RI/E CT too. -
Dec 5/6th major coastal/ west Atlantic cyclogenesis ...?
ORH_wxman replied to Typhoon Tip's topic in New England
Bombs away at 54h....look at that dynamic cooling on the sounding, lol -
Dec 5/6th major coastal/ west Atlantic cyclogenesis ...?
ORH_wxman replied to Typhoon Tip's topic in New England
This is going to be a weenie solution pretty close to BOS -
Dec 5/6th major coastal/ west Atlantic cyclogenesis ...?
ORH_wxman replied to Typhoon Tip's topic in New England
Yeah up there has some actual towns further northeast where you mentioned...I'm talking more in the Allagash. -
Dec 5/6th major coastal/ west Atlantic cyclogenesis ...?
ORH_wxman replied to Typhoon Tip's topic in New England
Once you get north of about Eustis, I swear it's like the northern version of deliverance. -
Dec 5/6th major coastal/ west Atlantic cyclogenesis ...?
ORH_wxman replied to Typhoon Tip's topic in New England
NAM is going to be less amped than 06z I think. Southern vort is dragging this run vs 06z. -
Dec 5/6th major coastal/ west Atlantic cyclogenesis ...?
ORH_wxman replied to Typhoon Tip's topic in New England
I don't think anyone is doing that. Others can chime in, but you should be fine. -
Dec 5/6th major coastal/ west Atlantic cyclogenesis ...?
ORH_wxman replied to Typhoon Tip's topic in New England
Euro being the NW outlier is something we've seen before at this time range and I feel like we know how it ends. 70/30 compromise...... We'll see though, this one is a bear on guidance. -
Dec 5/6th major coastal/ west Atlantic cyclogenesis ...?
ORH_wxman replied to Typhoon Tip's topic in New England
Yes. It's an old school forecasting rule that has held up pretty well over the years for well developed storms. -
Dec 5/6th major coastal/ west Atlantic cyclogenesis ...?
ORH_wxman replied to Typhoon Tip's topic in New England
Little bump east on the euro there. If we can get the consensus on this thing to be near the elbow of the cape or just slightly east, that puts a lot of SNE in the game. -
Dec 5/6th major coastal/ west Atlantic cyclogenesis ...?
ORH_wxman replied to Typhoon Tip's topic in New England
Ha. Not a terrible analogy. Not sure we’re that close to punching it in yet. But yeah, we’ve improved from needing a Hail Mary I think. We’ve gotten enough to go right that we’re now in plausible territory even if still large dogs. -
Dec 5/6th major coastal/ west Atlantic cyclogenesis ...?
ORH_wxman replied to Typhoon Tip's topic in New England
You know it’s bad when I was wishing the RPM went out another 6-12 hours. -
Dec 5/6th major coastal/ west Atlantic cyclogenesis ...?
ORH_wxman replied to Typhoon Tip's topic in New England
Is it too early for the RPM?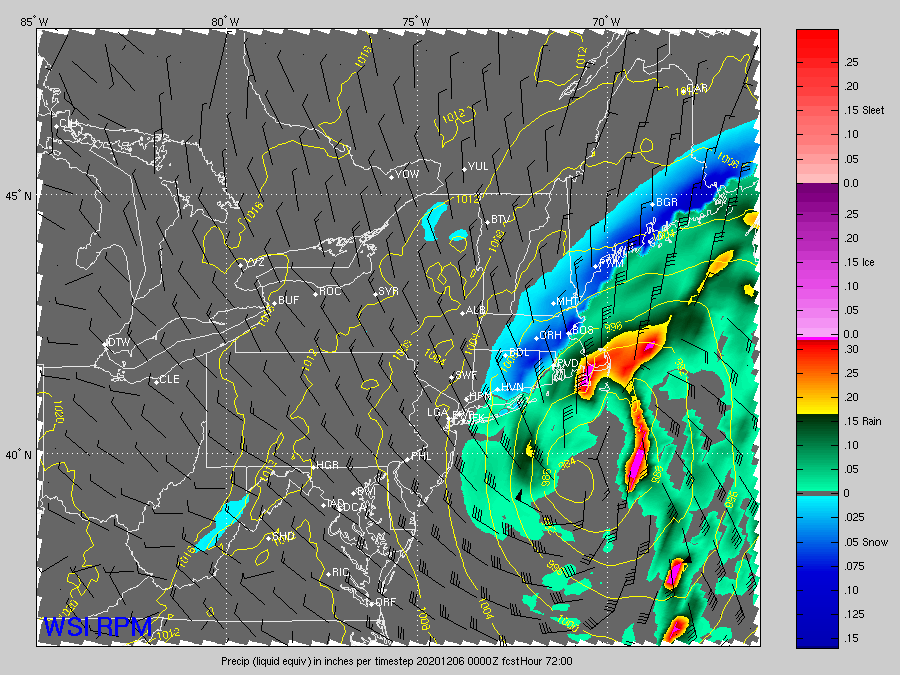
-
Dec 5/6th major coastal/ west Atlantic cyclogenesis ...?
ORH_wxman replied to Typhoon Tip's topic in New England
This is one of the worst ones I’ve seen in a while this close to the event. I mean, we’re only 3 days out and these models are almost behaving like they do 6 days out. They have no idea on how to handle the interaction of these two shortwaves. -
Dec 5/6th major coastal/ west Atlantic cyclogenesis ...?
ORH_wxman replied to Typhoon Tip's topic in New England
Looks like the GFS is going to basically whiff on phasing the two streams, lol. These models have no idea what is going on. So it’s going to be solely a southern stream storm on the GFS. -
Dec 5/6th major coastal/ west Atlantic cyclogenesis ...?
ORH_wxman replied to Typhoon Tip's topic in New England
RGEM went west of 18z. If you recall, 18z actually had decent snow near BOS. Now it’s interior SNE up into NNE/Maine. -
Dec 5/6th major coastal/ west Atlantic cyclogenesis ...?
ORH_wxman replied to Typhoon Tip's topic in New England
I do wish it was a non-event with the southern stream still trapped in the southwest. That would really help Dec7-8 But we’ve also known for like a week how putrid the airmass was. I think we were even saying like 5 days ago that 12/5 was a Hail Mary for SNE. -
Dec 5/6th major coastal/ west Atlantic cyclogenesis ...?
ORH_wxman replied to Typhoon Tip's topic in New England
Yeah it’s kind of a shit sandwich in SNE in this one. A zonked system jack-potting Saranac Lake NY on one end and a whiff on the other...and then some in-between runs of garbage 37F and rain. We need the exotic nuclear bomb solutions with a pretty narrow track to work in SNE. Up north obviously has some more wiggle room. Esp N NH into interior ME. -
Dec 5/6th major coastal/ west Atlantic cyclogenesis ...?
ORH_wxman replied to Typhoon Tip's topic in New England
Certainly in this storm it is. I feel like at this point given the volatility in model solutions, we just treat them all as ensemble members. I’d give the euro more weight than models like the RGEM at 72+ hours but definitely not biting on it hook, line, and sinker. -
Dec 5/6th major coastal/ west Atlantic cyclogenesis ...?
ORH_wxman replied to Typhoon Tip's topic in New England
Lol at the euro. It makes swings like the NAM now. What in the hell is it doing?


