

ORH_wxman
-
Posts
93,099 -
Joined
-
Last visited
Content Type
Profiles
Blogs
Forums
American Weather
Media Demo
Store
Gallery
Everything posted by ORH_wxman
-
I wonder what y’all would’ve said in Feb ‘69....or Dec 2010/first half of Jan 2011. Or March 2001.
-
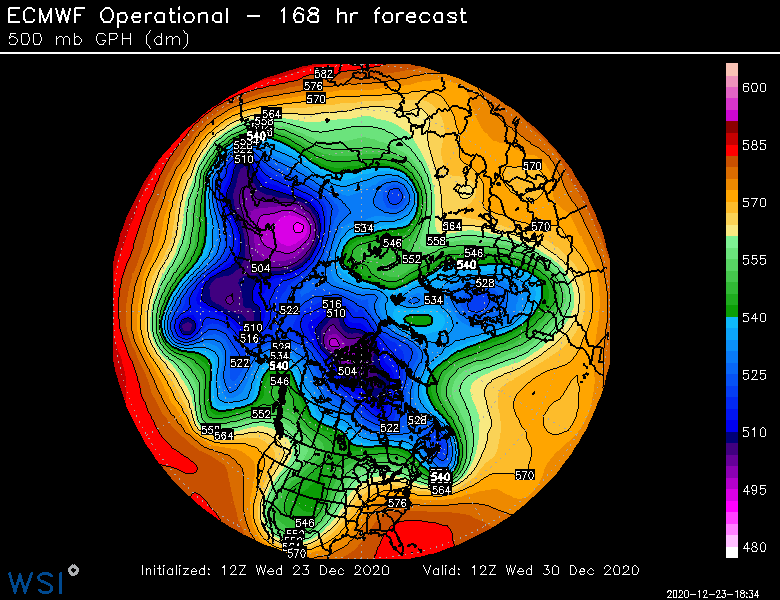
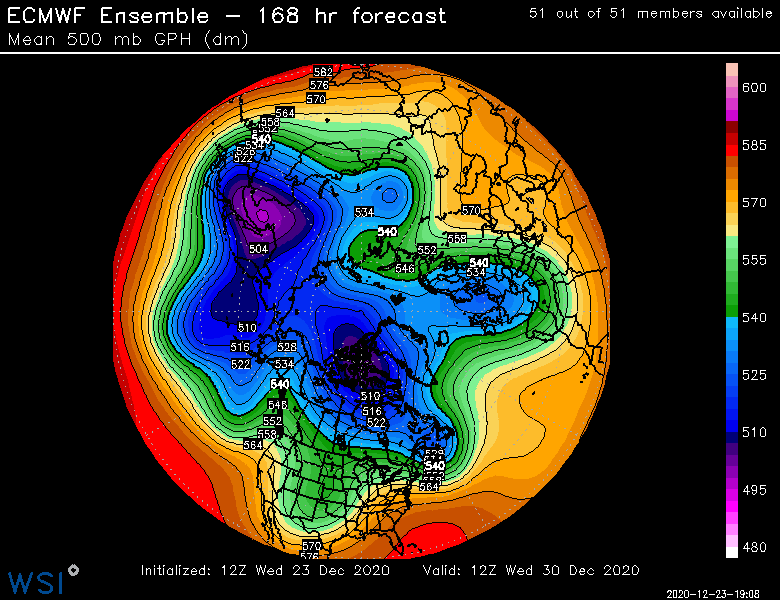
Seems like the blocking isn’t really robust until after New Years. It’s around but not going gangbusters until that 1/1 system passes. Btw that trough that is responsible for the 1/1 system looks ridiculous. Where’s the Hadley cell when you need it? Lol, that thing is digging into Cabo SanLucas Even the ensemble mean is pretty aggressive.
-
Yeah there’s never guarantees that far out. But it’s as good as you can really get in the 11-15.
-
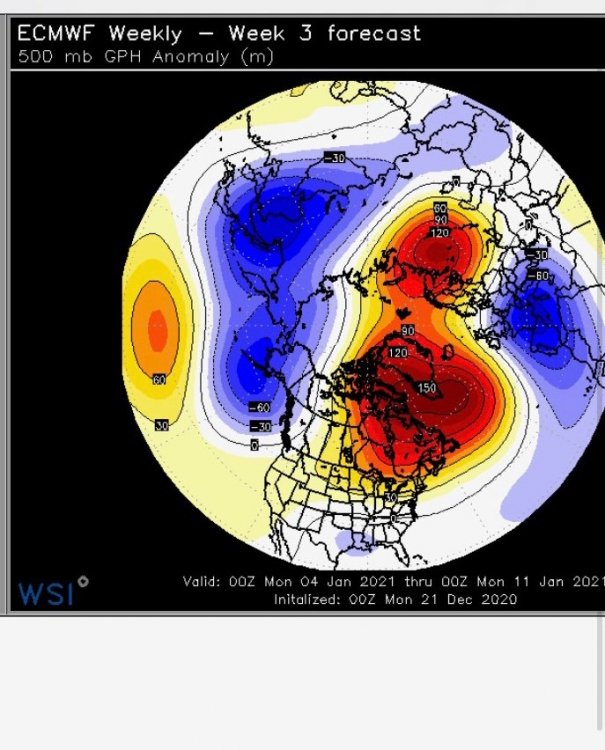
I don’t have the index numbers but the hemispheric H5 pattern is about as staunchly pro-blocking in the NAO/AO region as I have seen it at this lead time since the 2010-2011 winter. Hard to get an ensemble mean this bullish out at 12-15 days.
-
Yeah this is one of the worst ones I’ve seen. 1996 was pretty bad though. We had like 8-10” of high content pack leftover from the Dec 6-8 storms wiped out on xmas eve. That one didn’t quite have the winds of this one but I do recall pretty strong winds regardless.
-
GFS would be ok there for 12/29. Foreign guidance is uglier though. We usually know how that movie ends.....lol. The pattern does have some upslope potential at times so I’m sure it will still give snow events for your ‘hood even if the synoptic ones are garbage. It would be nice to get a few synoptic storms to work out though. NNE could use the snow for base building on snow mobile trails and ski resorts.
-
Yeah 3 in a row. 2017 was ridiculous. Like -10 temps lol with a couple small refreshers. Some crappy luck on the evolution of the Xmas storm up north. Ukie was actually the first to show it a few days ago and all other guidance slowly came on board which eliminated 12/29 threat. Now the 1/1 threat looks uglier too but still time to fix that one.
-
I don’t think I’ll ever see as bad a 4 year stretch as 1988-1989 through 1991-1992 winters. Just brutal. At least I hope I don’t see it, lol.
-
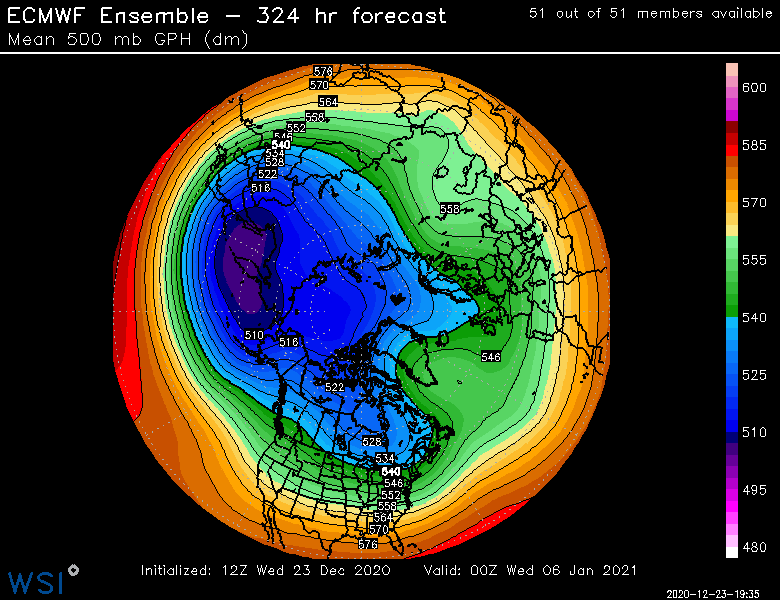
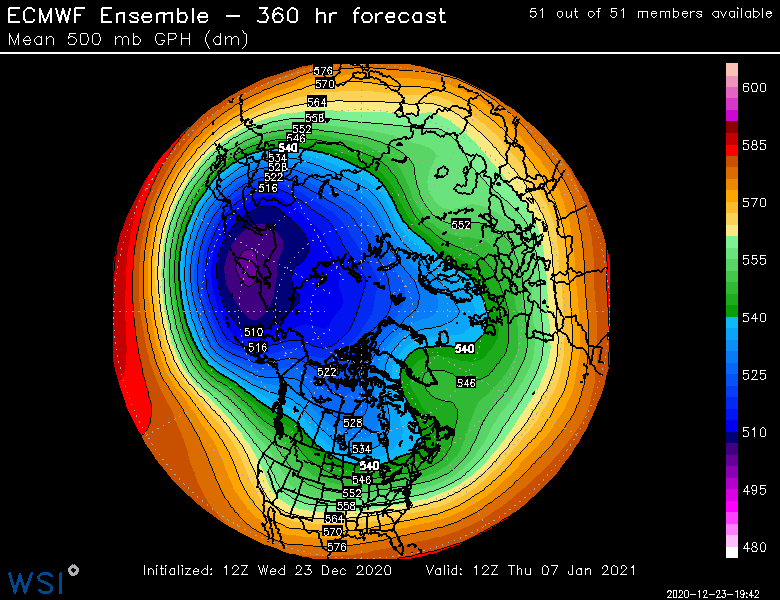
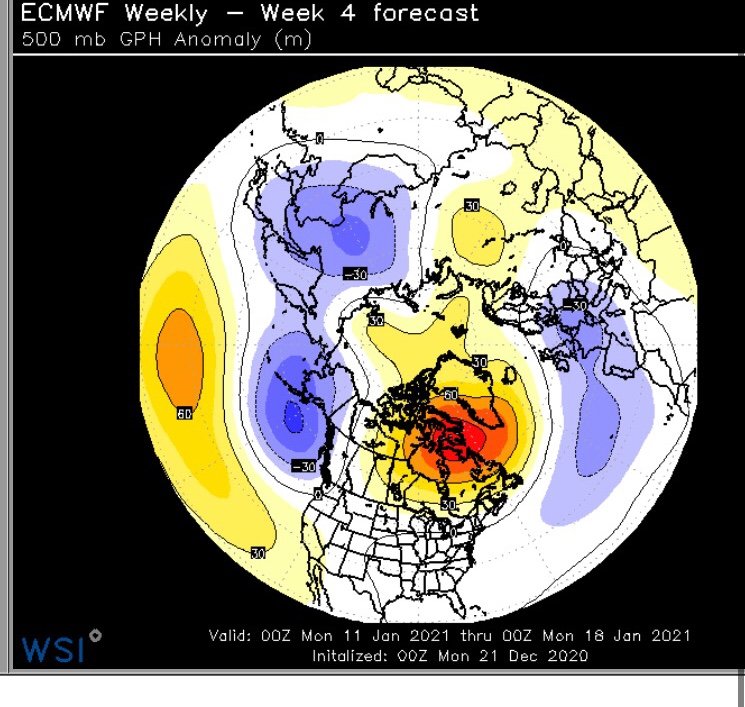
The blocking gets pretty extreme one some of the guidance later next week and into early January....that probably has at least some staying power. (fwiw....and I know it's not much....but the weeklies keep the -NAO blocking right through late January...finally breaking it down at the end of the month) We'll see though....sure beats having a death vortex over Greenland/Davis Strait
-
EPS look good out in the extended....there's a lot of NAO/AO blocking. We're going to have chances with that type of blocking....even with a pretty meh Pacific. EPO region actually does briefly attain some pretty big ridging around D7-10, so don't be surprised if the progs for near New Years and beyond show up colder as Canada may trend colder than currently shown if that EPO ridge materializes. I definitely would be optimistic in the longer range despite some turds in the immediate punch bowl over the next week or so.
-
Yeah pack it in for a few days....then recheck to see if 1/1 looks good. There's a small chance 12/29 could still be pretty wintry, but it would require some changes to what we see right now.
-
Yeah it's really a shitty setup with the Xmas storm retrograding into Hudson/Baffin region. I think we're going to need the 12/29 system to re-orient the blocking to more favorable with a bad Pacific not helping. 1/1 will have a chance if that happens.
-
Euro looks like a cutter for 12/29.
-
Ukie is actually just a straight cutter for 12/29....albeit kind of a weak one.
-
They aren;t out that far yet.
-
Need more confluence to north....Xmas storm becomes too wrapped up and retrogrades which doesn't help. Grinch storm gives us two Christmas presents..... Euro/Ukie did look a little more favorable so we'll see if they try and produce at 12z.
-
12/29 looks pretty crappy....but can't rule out interior snows. A lot will depend on how the deepening Xmas storm behaves to our northeast as that is the source of any confluence....if it lifts N easily or retrogrades too far W, then it's probably no dice for snows in SNE and maybe even CNE/eastern NNE.
-
Yeah already offshore E MA by 12z Xmas morning. Just when we thought the new GFS might be reliable.....
-
Yeah it’s slowing down every run too so it’s going to be tropical most of the day on Xmas instead of the front coming through early morning or overnight. Prob technically a white Xmas in many places at 7am but mudslides by lunchtime/afternoon.
-
No. Looks like another rainstorm.
-
Looks like the slower models are going to win the battle and all of us are going to wake up with tropical dewpoints. Hideous.
-
Hope the NAM is wrong. It still has the cold front back in BGM/AVP area at 12z. Probably all day on Xmas in the 50s/60s with that setup, lol.
-
-
White Christmas at IJD and brown up in powderfreak’s condo courtyard?
-
I think it probably survives over the interior at least. Might be close if the slower solutions materialize....


