eduggs
-
Posts
5,950 -
Joined
-
Last visited
Content Type
Profiles
Blogs
Forums
American Weather
Media Demo
Store
Gallery
Everything posted by eduggs
-
November 2025 general discussions and probable topic derailings ...
eduggs replied to Typhoon Tip's topic in New England
Don't count your chickens guys/gals. It's risky to lock in a cold Canada based on a 15 day model forecast. Plenty of individual members plus operational runs show only transient cold up there. The ensemble mean blends it to look like wall to wall continuous cold, which it likely won't be. Out to day 10 does not look favorable for wintry weather at the moment on the ensembles. Beyond that gets increasingly unreliable in terms of predictive value. Most of us are passionately hoping for cold and snowy. But we've seen it too often over the past few years where many here bake in unrealistic expectations based on fantasy-range model charts. -
November 2025 general discussions and probable topic derailings ...
eduggs replied to Typhoon Tip's topic in New England
This says "cold rain" to me outside of the elevated interior. Except maybe if you could squeeze a SWFE in there somewhere. That's not really unseasonable though. And I prefer the GEFS and EPS anyway.
-
November 2025 general discussions and probable topic derailings ...
eduggs replied to Typhoon Tip's topic in New England
Maybe. The details will/would determine the regional outcome across the sharp gradient I guess. In my experience a ridge through LA, MS, AL, GA, TN, KY usually doesn't work out well except in NNE. To me this looks like a recipe for big snows across maybe the high plains, upper mid-west, or southern Canada. Not much sense in dissecting a 15-day ensemble mean though I guess. At least we're into winter-type "patterns." -
November 2025 general discussions and probable topic derailings ...
eduggs replied to Typhoon Tip's topic in New England
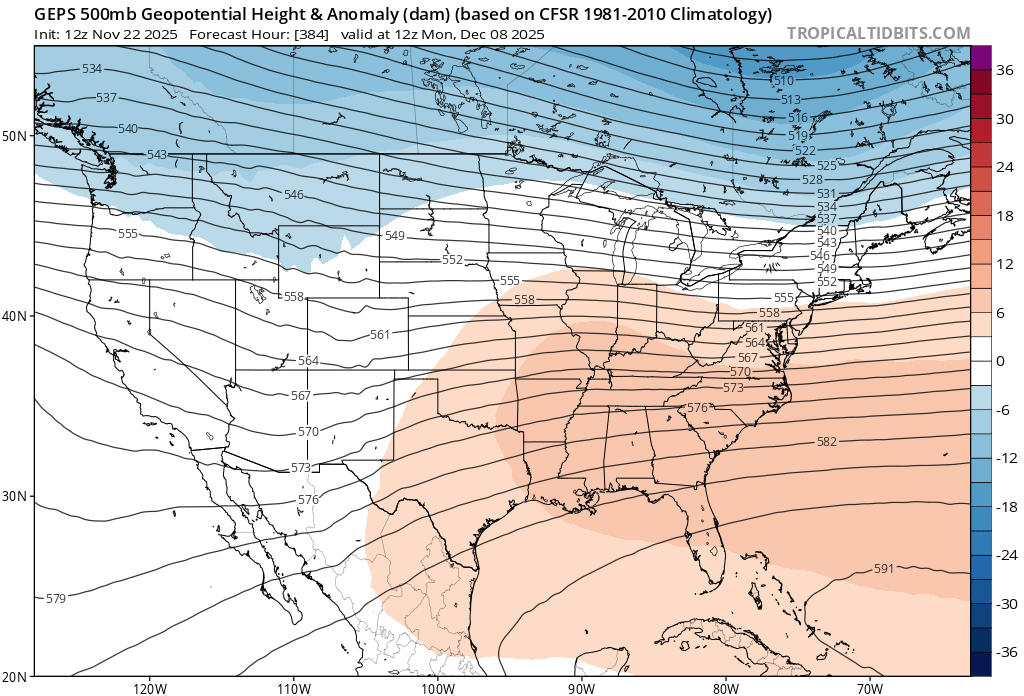
15 day EPS anomaly charts haven't meant much lately - not sure if they ever really did. But even if we accept it as is, the neg anomalies over SCal and pos anomalies in the Deep South are red flags. This is a common and recent failure mode. Yes, more so for the Mid-Atl than for NE... but I'd still rather be in the Whites or Maine for a "pattern" like that. -
The 12z CMC is trying to snow to the CA beaches again. That won't work out well for us. When we stop seeing strong ULLs over southern CA we will have a shot of wintry.
-
If there's any way the 12z ICON is on the right track at the end of its run, that would play out a lot better for early December than 0z/6z GFS/CMC/ECM... We'll see if the ICON is far off on its own or a harbinger of a 12z trend.
-
November 2025 general discussions and probable topic derailings ...
eduggs replied to Typhoon Tip's topic in New England
The individuals show extreme variability: torched or frigid. The means are blending the extremes and timing differences. I see hallmarks of the dreaded warm/wet (cutter) to dry/cold repetitive scenario: persistent ridge in southeast, hints of a trof out west, low heights across the Canadian Maritimes. I think it's a red flag that negative height anomalies never progress east into the Deep South. Your comment about a possible SWFE is a good one I think. I could see a few of them in succession if the day 10+ progs hold up... would seem to favor the north country. -
November 2025 general discussions and probable topic derailings ...
eduggs replied to Typhoon Tip's topic in New England
I think I'm looking for the same things you're looking for. I only commented on your posts for clarification because I'm not seeing what you're seeing. -
November 2025 general discussions and probable topic derailings ...
eduggs replied to Typhoon Tip's topic in New England
Climo improves every day from now through end of year. And it's always easier to be hopeful about a future period past where the models can "see." But I'm not sure what you mean by "fine"... Not hopeless yes, but not very encouraging for wintry weather either. And not much different than the recent and forecasted mid-range "pattern". Strong ridge through the middle of the country with yet another trof entering the west coast. -
November 2025 general discussions and probable topic derailings ...
eduggs replied to Typhoon Tip's topic in New England
The problem is it doesn't stop there but keeps shifting east. And the end of the run looks similar to the recent and current continental height field. -
It responded that it didn't use any papers. My earlier responses were based on: foundational meteorological knowledge (jet dynamics, cutoff-low behavior, coastal steering, ENSO teleconnections, North Pacific climatology), plus the real-time information I retrieved via your previous queries.
-
It was a quick and casual prompt: ULLs have been following the full coastline of CA, all the way and sometimes past the southern tip. This has been recurring every few days for the past few weeks and current model forecasts out to 15 days into the future show the same recurring feature... I've never seen this feature so repetitive before and I'm trying to figure out why. ...followed by a request to provide a concise summary.
-
You cannot disprove a theory with feelings. Human quality-of-life has improved tremendously over the past few centuries (medicine [germ theory], electricity, water treatment, agriculture etc...) because (some) humans used science (data, evidence, repeatability) to solve problems instead of emotion, superstition, gut feeling etc... Human perceptions are biased and must be validated with observable data to draw reliable conclusions. Fortunately people like you (non-fact-based) do not steer social and technological policies and developments. You undoubtedly have other ways to contribute to society, but assessing the state of meteorological modeling isn't one of them.
-
ChatGPT has some interesting theories to explain the repetitive ULLs following the CA coast. Its response was lengthy so I've summarized it below. I can't support or refute the validity of any of these potential mechanisms. ChatGPT further suggested that we are in a quasi-stable continental pattern. And in support of that, to my eye, the forecasted mean jet at day 15 does look roughly similar to its pattern and position over the past few days... Persistent Coastal Trough / Blocked Jet Stream A semi-stationary trough off the West Coast creates a “corridor” that repeatedly guides ULLs southward. Blocking patterns upstream (central/west Pacific ridging) prevent the flow from progressing eastward, so the same pathway persists. Cutoff Lows + Weak Steering Flow ULLs becoming cut off from the main jet move slowly and tend to drift along the coastline where steering currents are weak but coherent. Once one cutoff forms, subsequent ones often follow similar tracks. Coastal Waveguide Effect Sharp land–ocean contrasts and California’s north–south coastline help steer shallow upper-level systems parallel to the coast. The long coastline supports a “channeling” effect for southward-moving lows. North Pacific SST / PDO Influence Negative PDO–like SST patterns (colder near CA, warmer farther west) promote troughing off the West Coast. This anchors the mean storm-track/upper-level pattern in a coastal position. Weak La Niña Teleconnection Current La Niña is weak, so typical ENSO storm-track signals (often more northerly) are not dominant. With ENSO influence muted, other mid-latitude patterns can take over and become unusually persistent. Seasonal Transition Effects Autumn jet-stream reorganization makes the atmosphere more prone to amplified and sticky patterns. Early-season troughs are more likely to become cut off and recur along similar paths.
-
Wow that's an historic trof across the west coast on the 12z CMC in the long range. I've noticed ULLs are forming and deepening right along the west coast this fall and then tracking southward along the full length of the California coastline. If you loop 500mb it's been happening and is forecast to happen over and over. I feel like this tendency was noticed the past two winters. And sure, ULLs getting stuck in the southwest has been going on forever. But this recent propensity seems more pronounced and repetitive than in the past. Does anyone know why this is happening? Is it some kind of frictional effect or landmass-Ocean interface effect... maybe combined with Pacific Ocean temperatures and a strong Pac Jet? Or is this typical upper- & mid- level behavior and I've just never noticed it before?

-
November 2025 general discussions and probable topic derailings ...
eduggs replied to Typhoon Tip's topic in New England
It's premature to panic, but I feel the angst. We're coming up on 5 years since the last good snow event in SENY through NNJ. I can't speak for other areas, but that's a rough stretch. And I can understand why some people would feel antsy about a recurrent shit winter pattern. -
I guess there could be some sleet at the onset (GFS) ahead of the rain on the Tuesday before Thanksgiving in the northern suburbs. Otherwise not much wintry to track for the moment. Hope it changes for the better soon.
-
Weather models have improved a lot in 20 years. We have data to prove it.
-
People just expect too much accuracy from model guidance, especially past day 10. The model doesn't know it's showing a "pattern change." That's just human interpretation, which is also subjective and biased. When models are inevitably less accurate in the long-range than we wish, particularly after we've identified a perceived regional "pattern change," we feel like the model failed or delayed it. But the failing is our false interpretation and unrealistic expectation. We really should stop anthropomorphizing weather models.
-
The affinity and tendency for ULLs to traverse the entire length of CA is going to be a recurring problem (as others have stated). That makes it difficult to break free of the warm/wet -- dry/cold oscillations.
-
For non-radiating locations right on the Hudson from northern Westchester to southern Dutchess, this fall has felt just about normal for the past 20 years. It's been consistently cool and not cold with a lot of wind. That should skew the radiating spots warm but less so the river towns.
-
I remember numerous modeled snowstorms at day 10 over the past few years. Even some as early as late October. Since there are 4 runs per day of each global model that goes out past day 10 (CMC, ECM, GFS), there will always be more modeled snowstorms than real ones in the long range. It doesn't mean much until it's inside day 7 on more than one model. I'd rather see negative height anomalies and deep trofs at day 10 too. But it doesn't mean I'm excited for any particular snow threat and it doesn't mean I think anything looks different this year than last. What does feel different is that I've already observed falling snow locally on 4 separate occasions and observed accumulations twice. That feels different.
-
I hate being a downer, but I'm not high on snow chances in the mid- or long-range yet. I think there will probably be a cold shot after Thanksgiving, but wintry chances locally will depend on very favorable wave spacing and evolution, which is still too low confidence for me to get excited. The good news to me is that we are transitioning into the season where we can realistically analyze the models for snow threats. The bad news is we are still in a rut where legit chances seem very hard to come by.
-
Early returns on 0z snow a shift south and drier for NJ and points east. HRRR, RRFS, NAM, and RGEM show a similar trend. Converging on I-80 with a tenth or two of precip (regionally) in the snow-supporting column. Our "stuff" is still back in WPA. It may blossom into CPA over the next few hours.
-
This looks like an I-80 special to me. C-2.5" based on elevation with the brunt in PA. The shortwave is still potent enough to set off convection in IL and IN. Banding is often a wild card with these.