ariof
-
Posts
674 -
Joined
-
Last visited
Content Type
Profiles
Blogs
Forums
American Weather
Media Demo
Store
Gallery
Everything posted by ariof
-
Metro populations here. Depending on how you count, Boston is 5-8 million (MSA vs CSA), Sapporo is 2.6m.
-
BOS got more snow that month than any other city of its size (4 million plus), ever, in history. Sapporo gets more but it's smaller. BOS also had its second-coldest month on record (behind just Feb 1934), second-coldest low max (39, behind 36 in Jan 1875), 43 days below 40 (second place 38), 15 days below freezing (second place, 16, 1961) and 28 days with a low below 20 (second place: 23). It was basically normal temps for Minneapolis, except with way more snow. It's also when I went walking on the Charles and people were afraid I pointed out that it is basically a lake and Minneapolis spends its entire winter on frozen lakes. (Also, when people said "but combined sewer outfall" I asked when it had rained or melted enough.) What was even more wild is how easy the melt was. Just a bunch of dry, warm days, very little rain until late March (one earlier storm in the 30s meant the snowpack mostly absorbed it) and no flooding. Just imagine what a warm March rainstorm with 3" of precip would have done! (I remember some worry about this.) I think the Charles melted out in early April after three solid months. Almost definitely the longest stretch of ice cover.
-
Was that the anafront that wasn't? IIRC the South Coast got pummeled but it never really made it past TAN.
-
KBOS hit -1. And was sitting at 5.5" of snow for the season on 1/23 (half of which fell in November). So far, give me this Jan over anything in the past decade aside from 2022 and 2018 (and 2018 started out cold and snowy but was 60 by the 12th.
-
BOX was saying 8-12 for Boston at 4 a.m. on the 12th (the day before) and wound up with 0.1.
-
It was clear at the 12Z models that Monday that the event was going way south and Massachusetts would be a non-event, but that didn't keep a bunch of cities from declaring snow emergencies that morning (after the modeling came out) and then having egg (but not snow) on their face the next day.
-
The rug pull last February 12, 24h before the event, at least in Massachusetts, was impressive.
-
About half of this forum networked their CPUs for this run. Me included.
-
The salmonpling
-
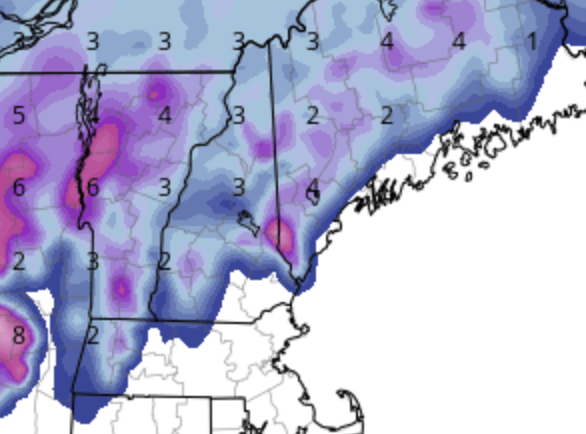
Areas in that deform band could see 2' of snow with 15:1 ratios.
-
Tuesday of what decade?
-
My back still hurts from shoveling Valentine's Day last year.
-
a.k.a. the Mitch Scenic Byway
-
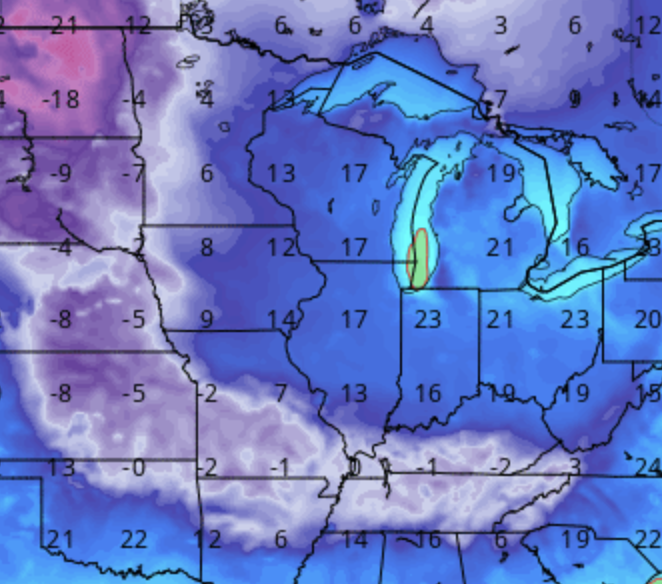
Gotta love this solution for 306H on the GFS: The entire state of Tennessee is colder then the entire state of Wisconsin.
-
Congrats BNA
-
Reggie says … Congrats, like, Wakefield, NH?
-
New England Winter 2024-25 Bantering, Whining, and Sobbing Thread
ariof replied to klw's topic in New England
Okay where is the Grinch? Shouldn't it be raining and 55˚ right about now? -
Would you prefer the classic Tip write-the-whole-analysis-in-the-title thread title?
-
I think this is going to have an outsized impact. By the time you get the truck drivers to the vehicles and into position on a day like today there's so much traffic that they can't get across their routes, CF bumps through and road freezes up, drivers get stuck on a small incline, backs up behind that. Not saying that has happened yet but traffic seems awful. Just bad timing for snow on a day everyone is trying to get out of town or shop for the holidays; doesn't take much to gridlock everything.
-
NAM GONE WILD! WARNING SNOWS FOR MUCH OF BOS CWA!
-
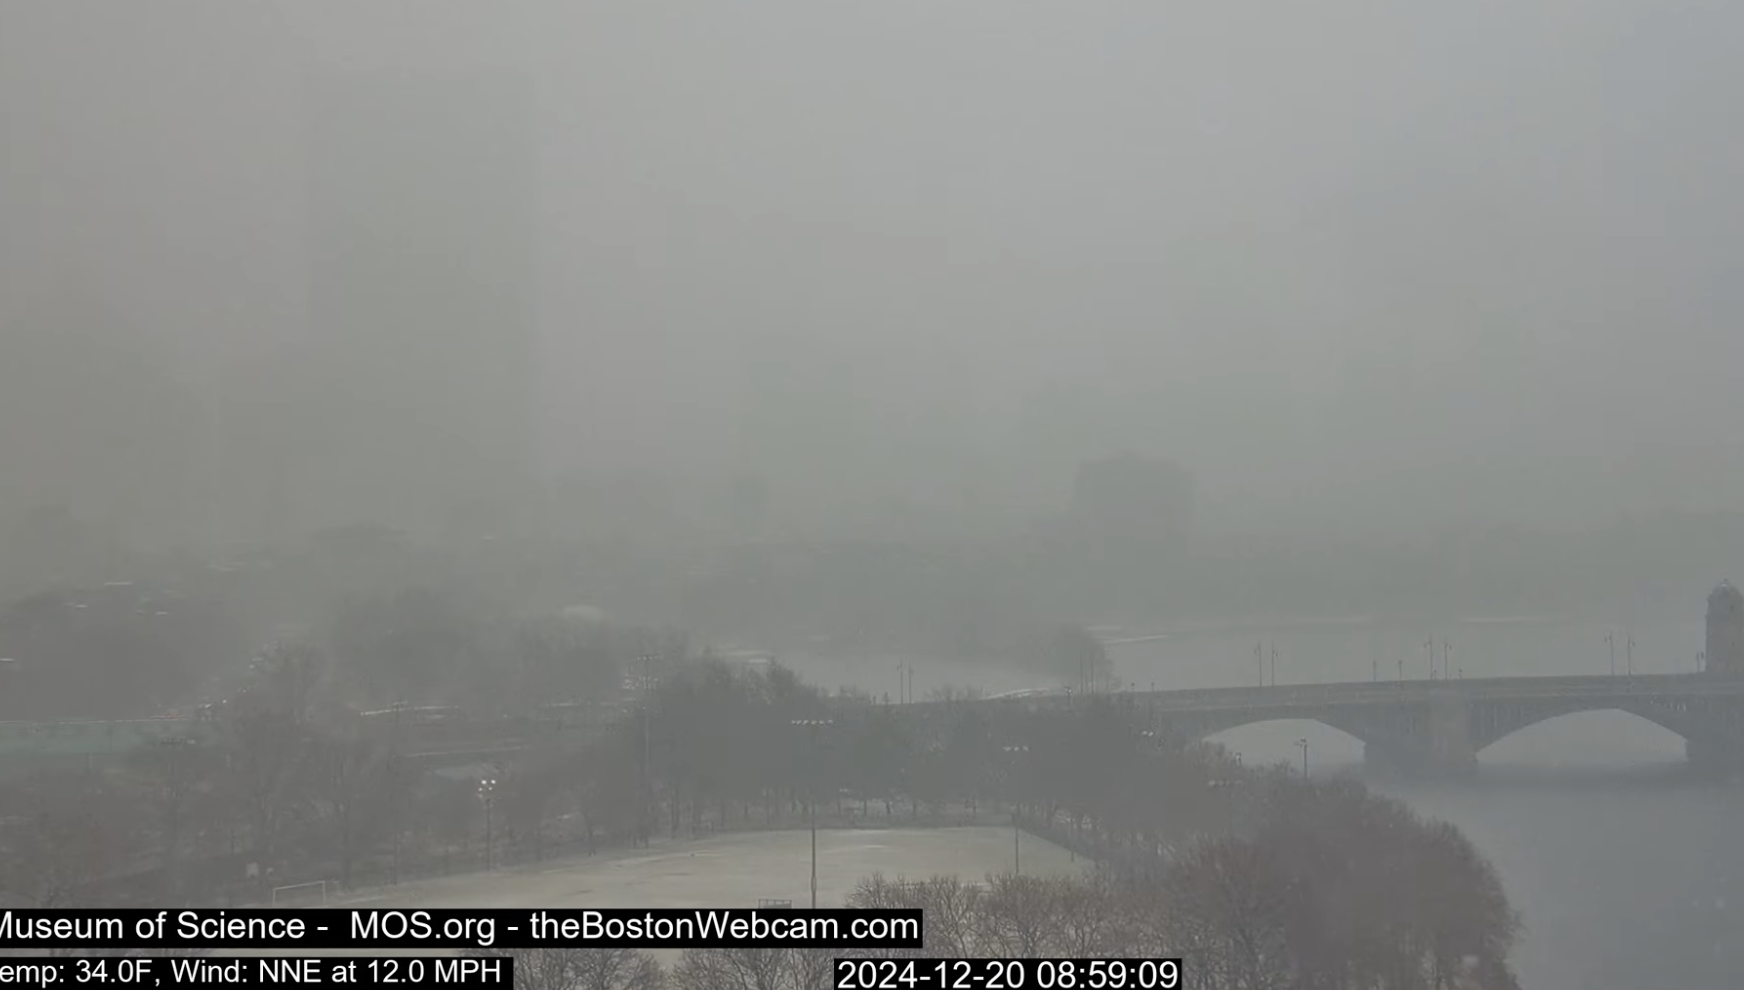
Nice little OES band hitting BOS and surrounding areas. -SN in Cambridge sticking to unpaved things. Museum of Science webcam shows visibility ~1 mile.


.gif.61ae6482816f7a5bc863f4be559487e0.gif)