

ariof
-
Posts
674 -
Joined
-
Last visited
Content Type
Profiles
Blogs
Forums
American Weather
Media Demo
Store
Gallery
Everything posted by ariof
-
I remember throwing my back out many times shoveling DGEX snow.
-
Oh, I know … it's just … the general public and their apps are … very misinformed. Literally "I am having anxiety about a storm five days out" Yeah, we all are, kid, but know deep down in our hearts it's pretty unlikely to come.
-
I had someone flying out of BOS on Thursday email me and ask what they should do. My response was take 10 deep breaths and wait two days, the models would probably send it out to sea. Probably some weather app overreacting to a couple of model runs. People seem to think that 5 days out isn't clown range because their phone pops up an icon.
-
BOS has had one more recently than you in Jan '22. Before that both Jan and Feb '15, Feb '13, Jan '11, Jan '05, Feb '03, Jan '96, Jan and Feb '94. Then you have to go back to Jan '78 (but *not* Feb), Feb '69, Mar '56, Jan '48, Jan '38. So, five from 1938-1988 10 and counting 1988-2038.
-
I've thrown out my back this season from shoveling D8 snow.
-
Sunday Evening/Night Light snow event Disco/Obs
ariof replied to Sey-Mour Snow's topic in New England
Would be nice if there wasn't a flood of warm air in behind it to melt it off but beggars can't be choosers. -
Prospect Mountain (in Mitch-land, 2250' on Route 9 in Woodford, Vermont) has a webcam and a wx station. They crossed 32˚ at 0850, sat at 37˚ from 1000 to 1130, then dropped to 32˚ in about 30 minutes. https://dashboard.hobolink.com/public/PMA weather dashboard#/ Cam now showing SN. https://prospectmountain.com/trail-cam/
-
Disagree. 2015-2016 was just very warm with one arctic shot. At BOS: Dec: 2015: 45.3˚, 0.9" (high temp of 69˚ on xmas eve; not really the grinch because there was nothing to steal; I had friends in Vermont who went swimming in the pond they usually skated on) 2024: 35.3, 5.7" Jan: 2016: 32.5˚, 9.5" 2025: 28.7˚, 8.2" Jan has been similar-ish although cooler this year. Feb that year had the one cold snap (down to -9˚ in BOS) but the rest of the month was warm; it was 65˚ on the 1st and 64˚ on the 29th. 2015-6 had 35 days >50˚ at BOS (20, 4, 11), so far 2024-5 has had 8 (8, 0, ?)
-
Watching the squall come through from this webcam in Windsor, Mass. at Notchview: https://www.youtube.com/watch?v=T0keY9QYH54 If you scroll back to 12:57 you can see the vis go from clear to "can't see across the field" (the trees in the distance are <500' away, so basically 1/16SM). Video should work for the next 12h.
-
And reported 164" of snow depth with zero settling during the storm. I assume they were just glancing at the snow stake every few hours. If they were taking more frequent measurements, who knows how much snow would have been observed. I'd imagine there were some avalanches up in Tucks from that one.
-
BOS has stayed below 50˚ this month so far and no model has it anywhere much above 40˚ the rest of the month. Would be the first <50˚ Jan since 2009 and first month since 2015 (Feb '15 and Feb '13). Mean days >50˚ is 4 and mean monthly high temp is 56˚. So while it hasn't been frigid it has not been warm either. Assuming it doesn't go above 47˚ or below 10˚ the rest of the month (the GFS doesn't suggest this, the Euro thinks it might toy with 10˚) the range of 37˚ will be the fifth lowest range for Jan on record, behind 2001 (12˚–44˚), 2009 (6˚–40˚), 1955 (10˚–45˚) and 2023 (23˚–58˚). This is also why while it has been dry the ski areas are doing great because it's been cold with low dewpoints which is great for snowmaking (and they don't really like it down below 0˚ because of evaporation and stuff freezing real quick).
-
i was in Mont Ste Anne that week, we didn't crack zero between our arrival and going through Concord, NH on the way home.
-
This morning: PANC: 36, 3" snow depth, 1.9" monthly snowfall KMSY: 23, 8" snow depth, 8" monthly snowfall
-
5 in a row at BDL <20 (3rd longest streak behind 1979 and 1918). 6 in a row at BOS (second behind 1918).
-
Looks more likely than not that BOS will have its first Jan that doesn't hit 50 since 2009. Average monthly max is 56, previous recent below-50s include 2009 (40), 2003 (44), 2001 (44), 1991 (49), 1985 (45), 1977 (47), so about one year in seven.
-
Yeah per Google Maps looks like the bad driving is Campton through the Notch but once you drop a few feet fine, and then once you get past Fabyans and south through Crawford. Hope the nordic trails got snow and they groom it tomorrow morning … we're trying to thread the needle between SN.
-
Let's not get too carried away running towards the end zone here, Leon is still with us. Last year's Valentine's debacle didn't really bust until 24h before the event start … which would be the 18Z suite.
-
Real, and spectacular.
-
Going to sleep. Will know by the page count (currently 53) if the Euro has followed the NAM offshore or not.
-
Meme me up, Scotty.


-
It would be very 2025 for the NAM to score a coup over all the other guidance for the first time in the direction of "not a storm" rather than its usual excitement over storms that fizzle/miss.
-
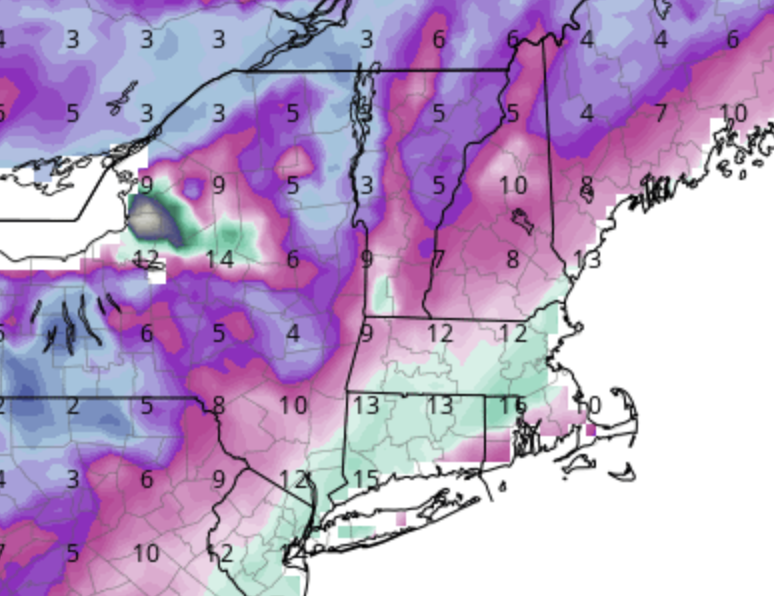
GFS looks great for SNE/coastal areas (this is out to 240h). G
-
A rare year where the west side of the mountain has better snow than the east.
-
Nice little band here near KBOS. Was -SN but just glanced out the window and back to SN.
-
Hokkaido has as many people as the Boston MSA, with a slightly larger land mass. Still, Sapporo snow is ridiculous. They average 182" per year, a bad year is still 125, and a good year pushes in on 300. January 1981 had 107" of snow, which is slightly more, but really not that much, than Boston got in that period.


