Chinook
-
Posts
10,935 -
Joined
-
Last visited
Content Type
Profiles
Blogs
Forums
American Weather
Media Demo
Store
Gallery
Everything posted by Chinook
-
 Barbados radar is seeing the eye/eyewall pretty well now
 -
Nice pics!
-
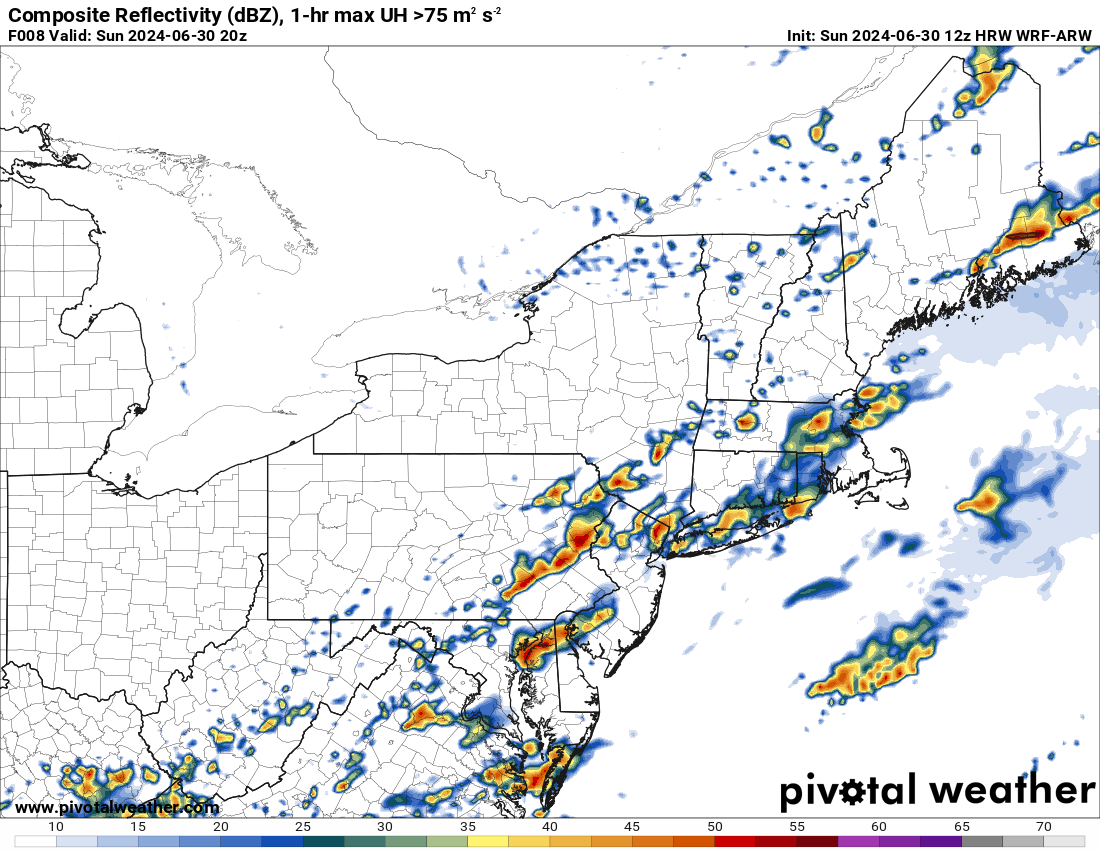
This model has several severe storms, so probably at least a slight risk in the area.

-
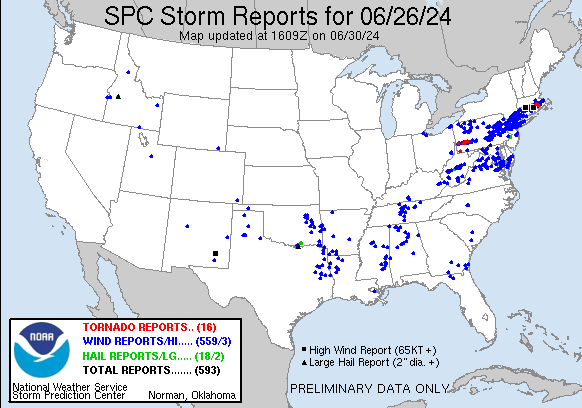
The NY area really had something like 200 or 300 storm reports a few days ago. Now, it looks like several more severe storms will be in the general area. As per last night's models, I thought this might be a slight risk, as advertised yesterday, by the SPC. Now, the enhanced risk seems alright.
-
2024 Short/Medium Range Severe Weather Discussion
Chinook replied to Chicago Storm's topic in Lakes/Ohio Valley
from Tuesday
-
2024 Short/Medium Range Severe Weather Discussion
Chinook replied to Chicago Storm's topic in Lakes/Ohio Valley
some more tornado reports near the Des Moines metro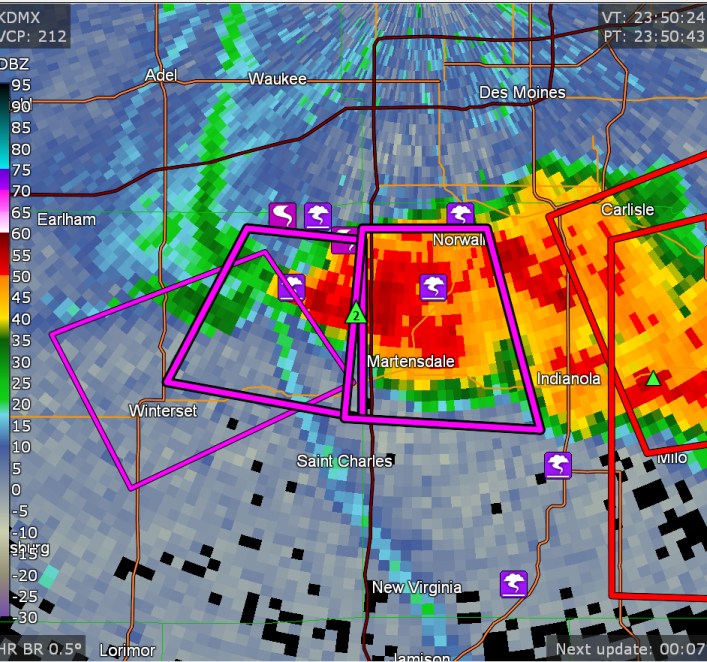
-
2024 Short/Medium Range Severe Weather Discussion
Chinook replied to Chicago Storm's topic in Lakes/Ohio Valley
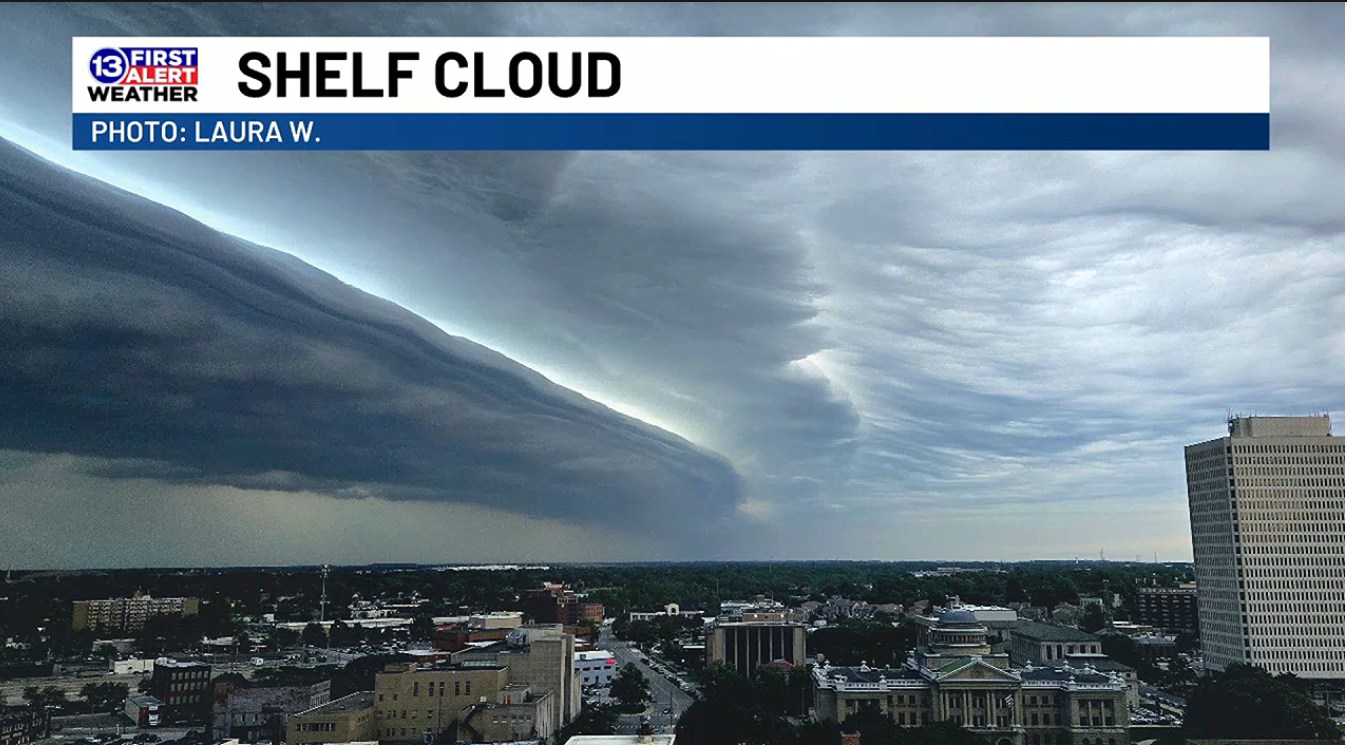
I saw this cool shelf cloud in Toledo. Much of the same thing. It perhaps was the best view of a shelf cloud I've had in my entire life. (I didn't get a picture.) Then I drove straight toward it, that is, I had to drive to Detroit and back. Rainy! Saw some lightning bolts! But otherwise, terrible. -
2024 Short/Medium Range Severe Weather Discussion
Chinook replied to Chicago Storm's topic in Lakes/Ohio Valley
Possible non-supercell tornado. Maybe some Iowa people have a great view of this towering storm with 6000 J/kg of CAPE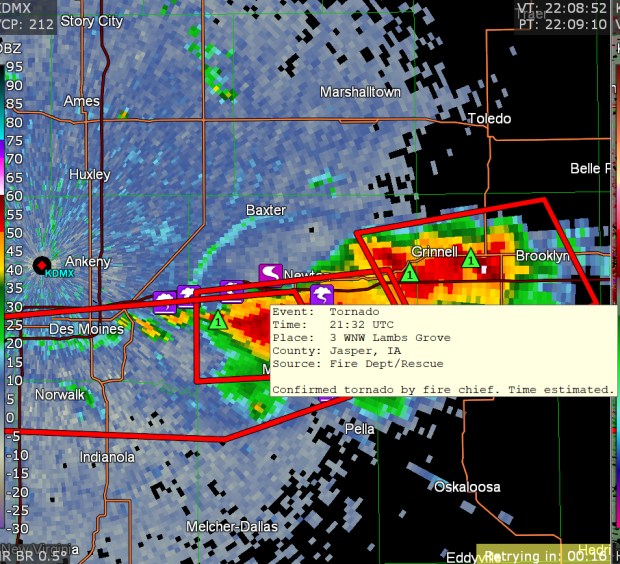
-
With today's enhanced risk forecast, there has been less damage than some recent slight risk days in the Northeast. And such is the nature of severe weather forecasting.
-
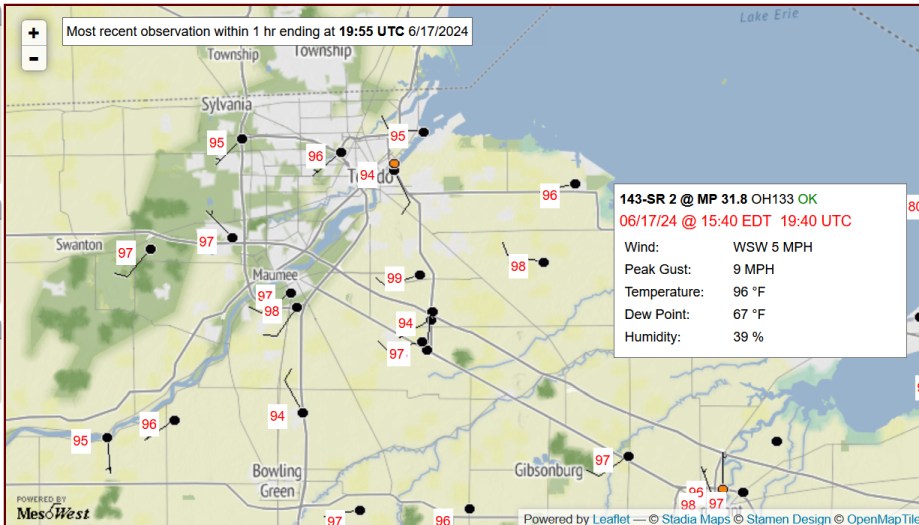
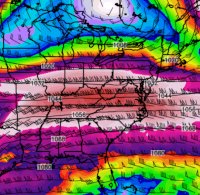
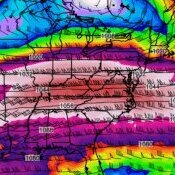
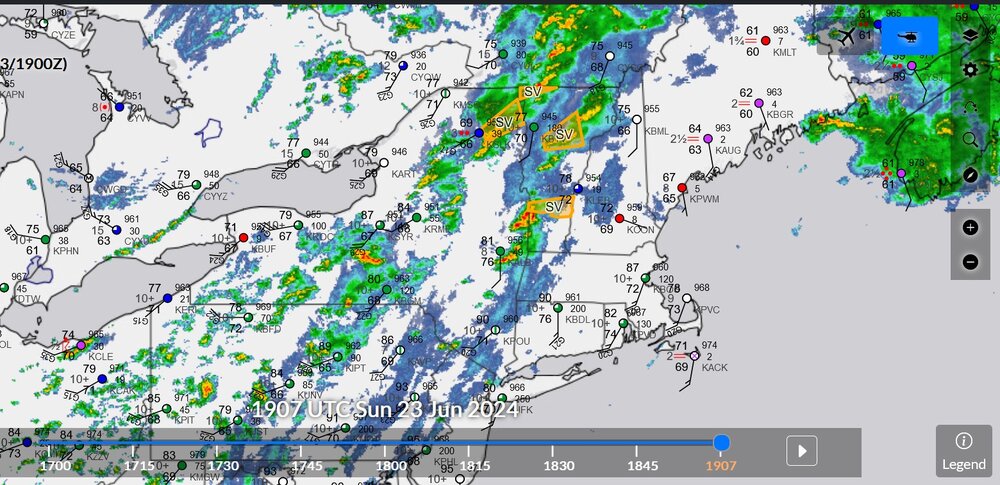
There are some very high dew points in New England and New York today. There are three current severe storms shown in this image. Thanks for taking the heat away from Ohio. I really needed it. Maximum believable dew point is 76, I think, which is very bad. Nashua NH reports 80 dew point but it might be wrong.
-
2024 Short/Medium Range Severe Weather Discussion
Chinook replied to Chicago Storm's topic in Lakes/Ohio Valley
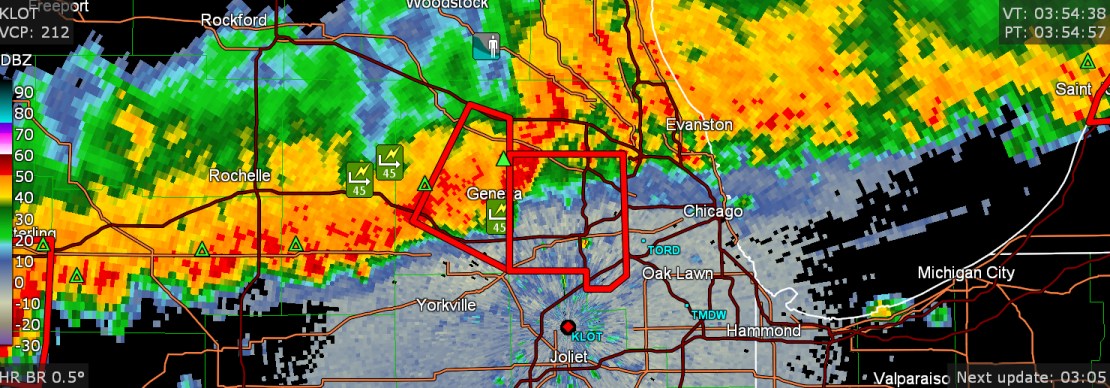
Watching lightning has got to be fun, if you are staying up late tonight in Chicago. It seems like limited amounts of flooding are a bigger threat than wind gusts.
-
2024 Short/Medium Range Severe Weather Discussion
Chinook replied to Chicago Storm's topic in Lakes/Ohio Valley
new confirmed tornado -
2024 Short/Medium Range Severe Weather Discussion
Chinook replied to Chicago Storm's topic in Lakes/Ohio Valley
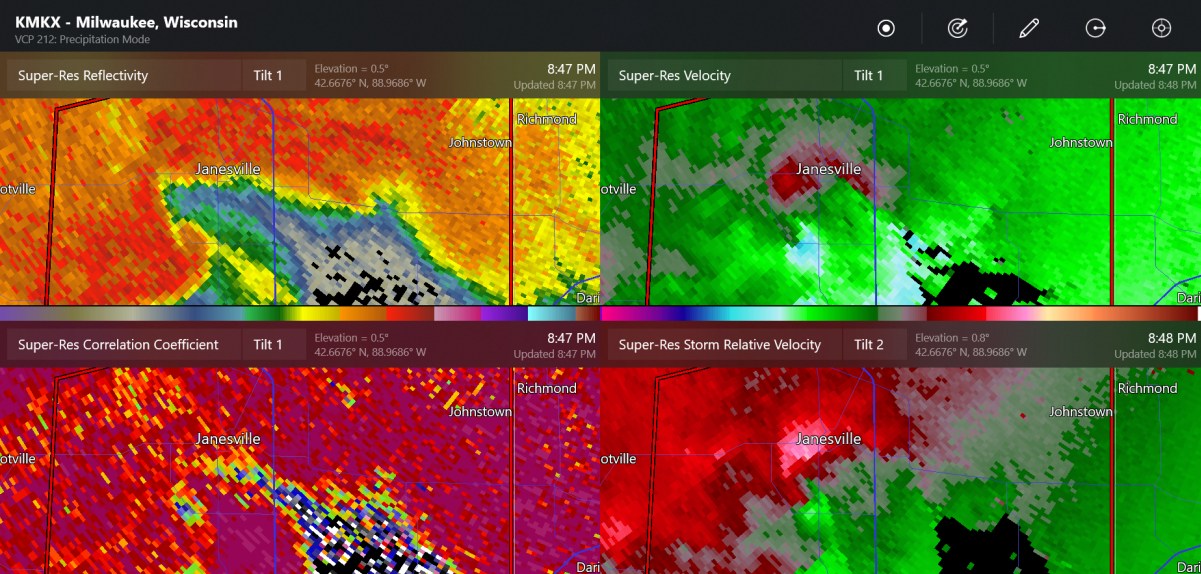
new supercell with a tornado next to Janesville WI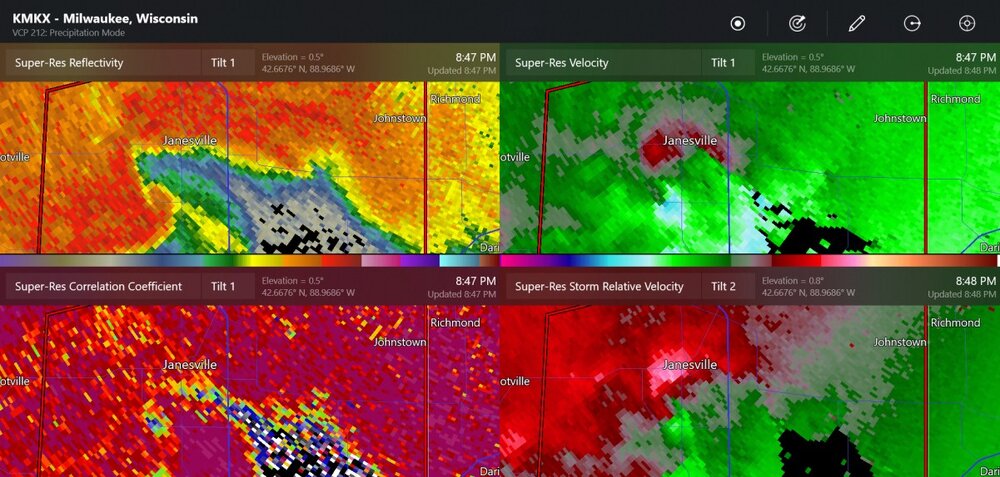
-
2024 Short/Medium Range Severe Weather Discussion
Chinook replied to Chicago Storm's topic in Lakes/Ohio Valley
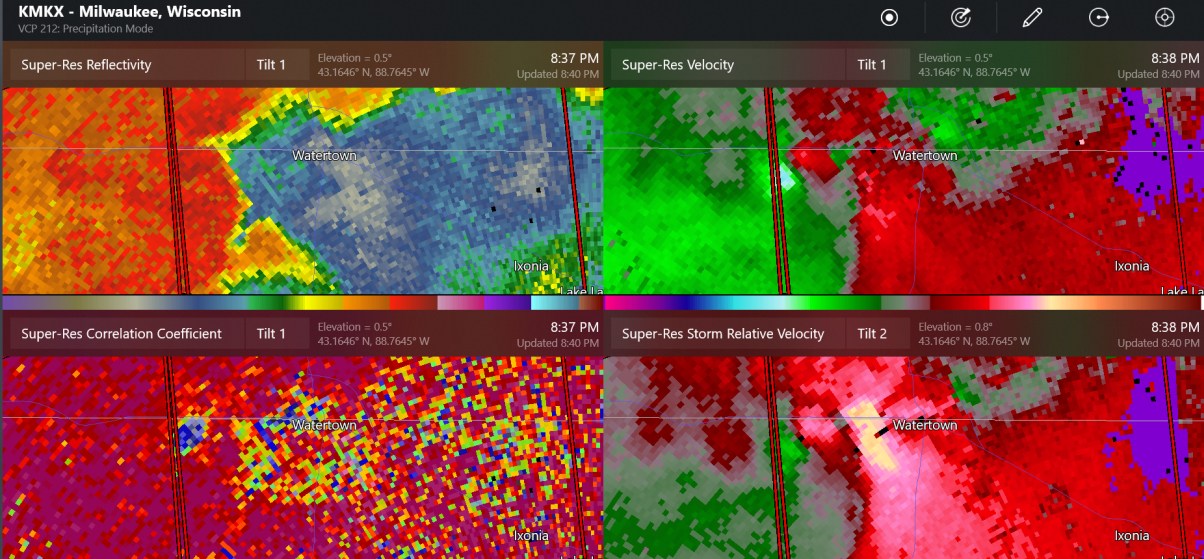
large tornado debris signature near Watertown, WI
-
1988 was weird, with a large drought, a scorching 104 degrees at Toledo in late June, then lows in the 40's for the end of the month of June. As for my area, it was +10.44F on the Monday-Friday period, some heat indices to 100 multiple times for the general area here is a heat index of 101 at KTDZ yesterday, before a brief thunderstorm outflow cooled the temperature to 85 (but it went back up) Oh, by the way, thankfully some significant rainfall to help the grass. The grass started to get brown when it was 99 or 100. But it got a bit better. Heavy rainfall happened in various amounts around Toledo on Wed/Thurs. Thursday's precipitation amounts indicate lake-breeze boundaries had a huge effect.
-
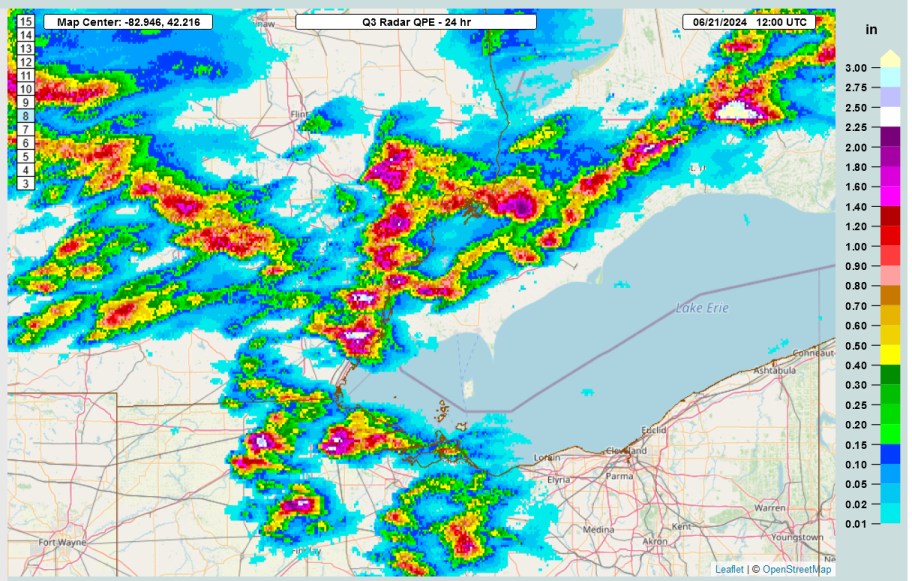
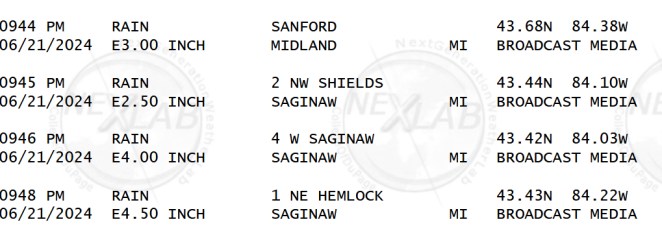
Midland to Saginaw may have seen some flash floods
-
This may have been a large tornado by Ainsworth Nebraska
-
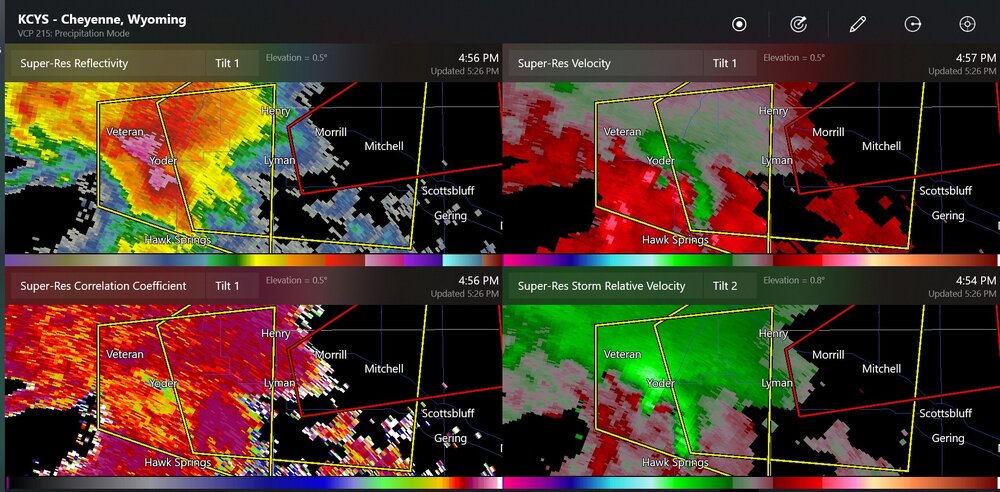
This storm NE of Cheyenne had a tornado and 4.50" hail reported briefly, then 80mph wind in Nebraska
-
2024 Short/Medium Range Severe Weather Discussion
Chinook replied to Chicago Storm's topic in Lakes/Ohio Valley
Flood in Detroit( 14 mile road underwater) -
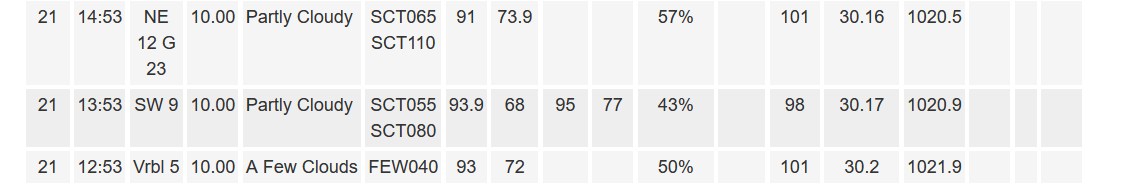
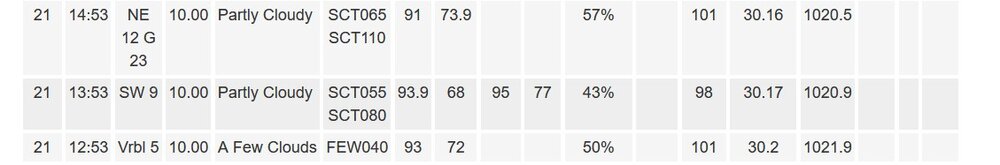
Toledo had 99 yesterday (broke a record), 93 today. It was 100 and 96 intra-hour high temps at Toledo's KTDZ. This airport seemingly has been running just a bit higher than TOL for a while. And it's always possible this isn't an equipment bias.
-
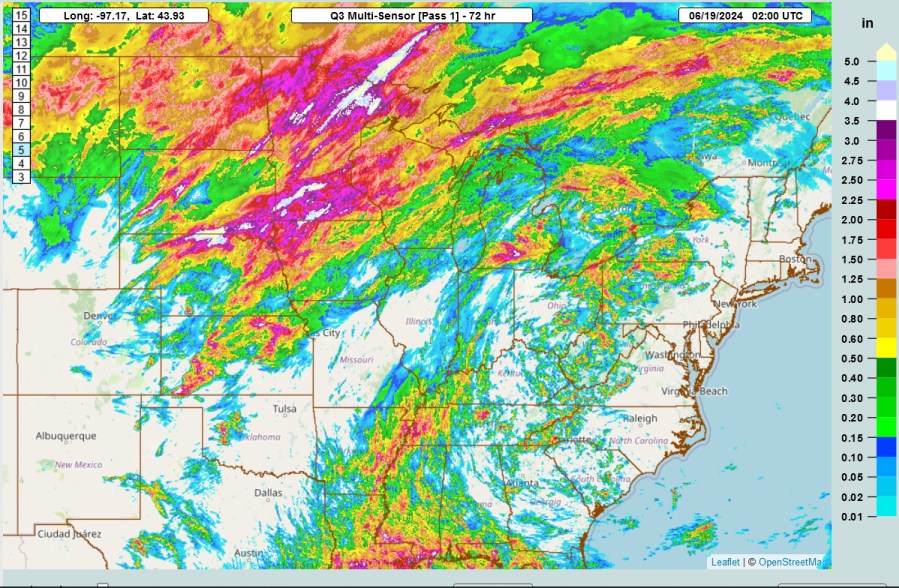
over 3.5" in Minnesota, South Dakota. Minneapolis Radar says over 5.50" southwest Minnesota. Not sure, but 7.0" might have been possible by Glencoe.
-
as for Toledo, there were multiple days of 90's last year (probably less than average) and the top for the year was 93, on only one day.
-
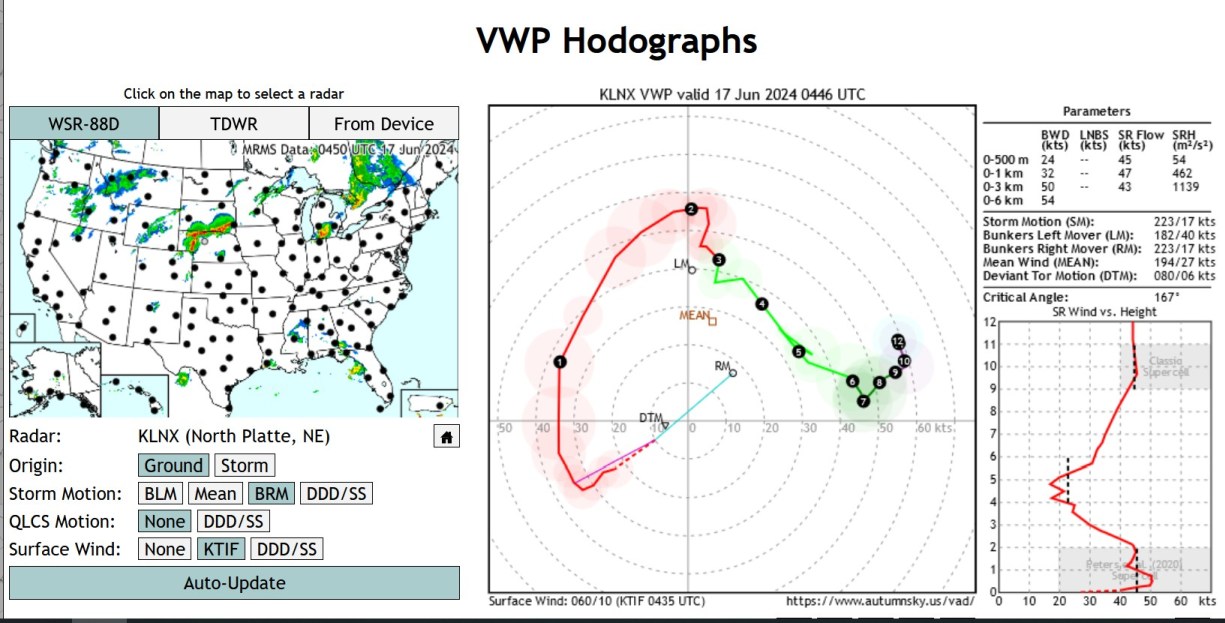
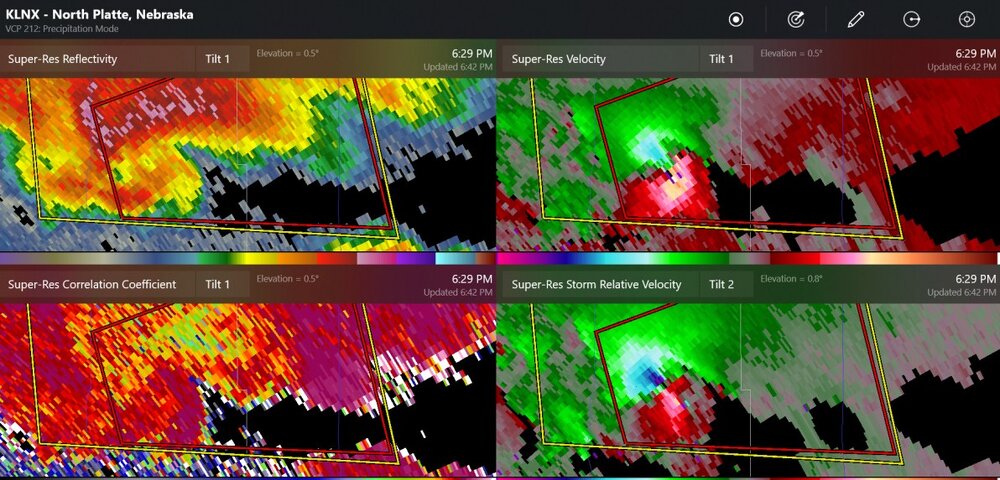
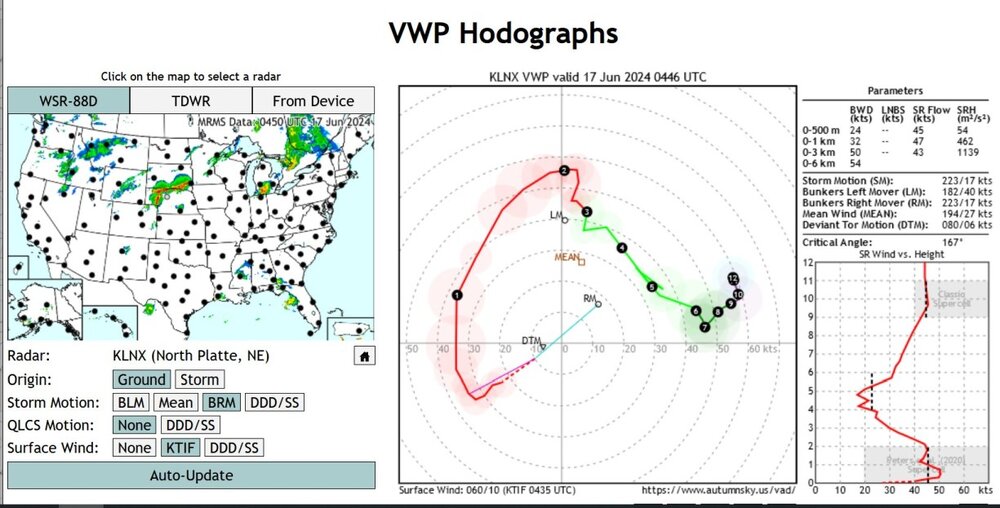
This was a measured hodograph with crazy storm-relative helicity. It was measured at the LNX radar after the low-level jet kicked in. There were some storms popping up in Nebraska, but no crazy isolated supercells.
-
With a little west wind, the air comes right in from the city to an on-land station at Summit St Marina. It's 86.4 in the Bay, as per a buoy
-
My place is scorching, with 101.3 on my home (indoor) thermometer placed outside in the shade. 58.9 dew point is suspiciously low. cooler by the lake (not really)!