high risk
-
Posts
3,145 -
Joined
-
Last visited
Content Type
Profiles
Blogs
Forums
American Weather
Media Demo
Store
Gallery
Everything posted by high risk
-
That's what I had been thinking, but the NAMs would accumulate earlier. The parent would accumulate by early afternoon; the nest at least wouldn't start accumulating until 3-4pm or so, at least on the MD side of the river.
-
The QPF/snow may come out similar, but at least from a school closing perspective, the 3 km NAM is notably slower with the arrival than the parent.
-
I totally get the frustration, and the guidance Thursday and Friday wasn't good, but several of us here pointed out last night that the 00Z CAMs had backed way off on the precip. With a delayed start and weaker event, we were inevitably going to warm up and significantly lessen any possible impacts. The problem is that once the advisories are hoisted, local WFOs are understandably super hesitant to pull them back.
-
You can't really define a range for it, as it is combining forecasts from multiple ensemble systems with some extra adjustments made with bias correction techniques for amounts (not spatial coverage). Ultimately, it only has much accuracy as the overall synoptic skill and skill-spread ratios of the various inputs, but its purpose is that it's not as prone to wild swings from individual solutions. That said, the "deterministic" solution shown in that previous post is worth looking at, but it should be done in conjunction with percentiles and probabilities.
-
The HRRR isn't alone with being stingy on the precip. Several of the evening CAMs show the same idea.
-
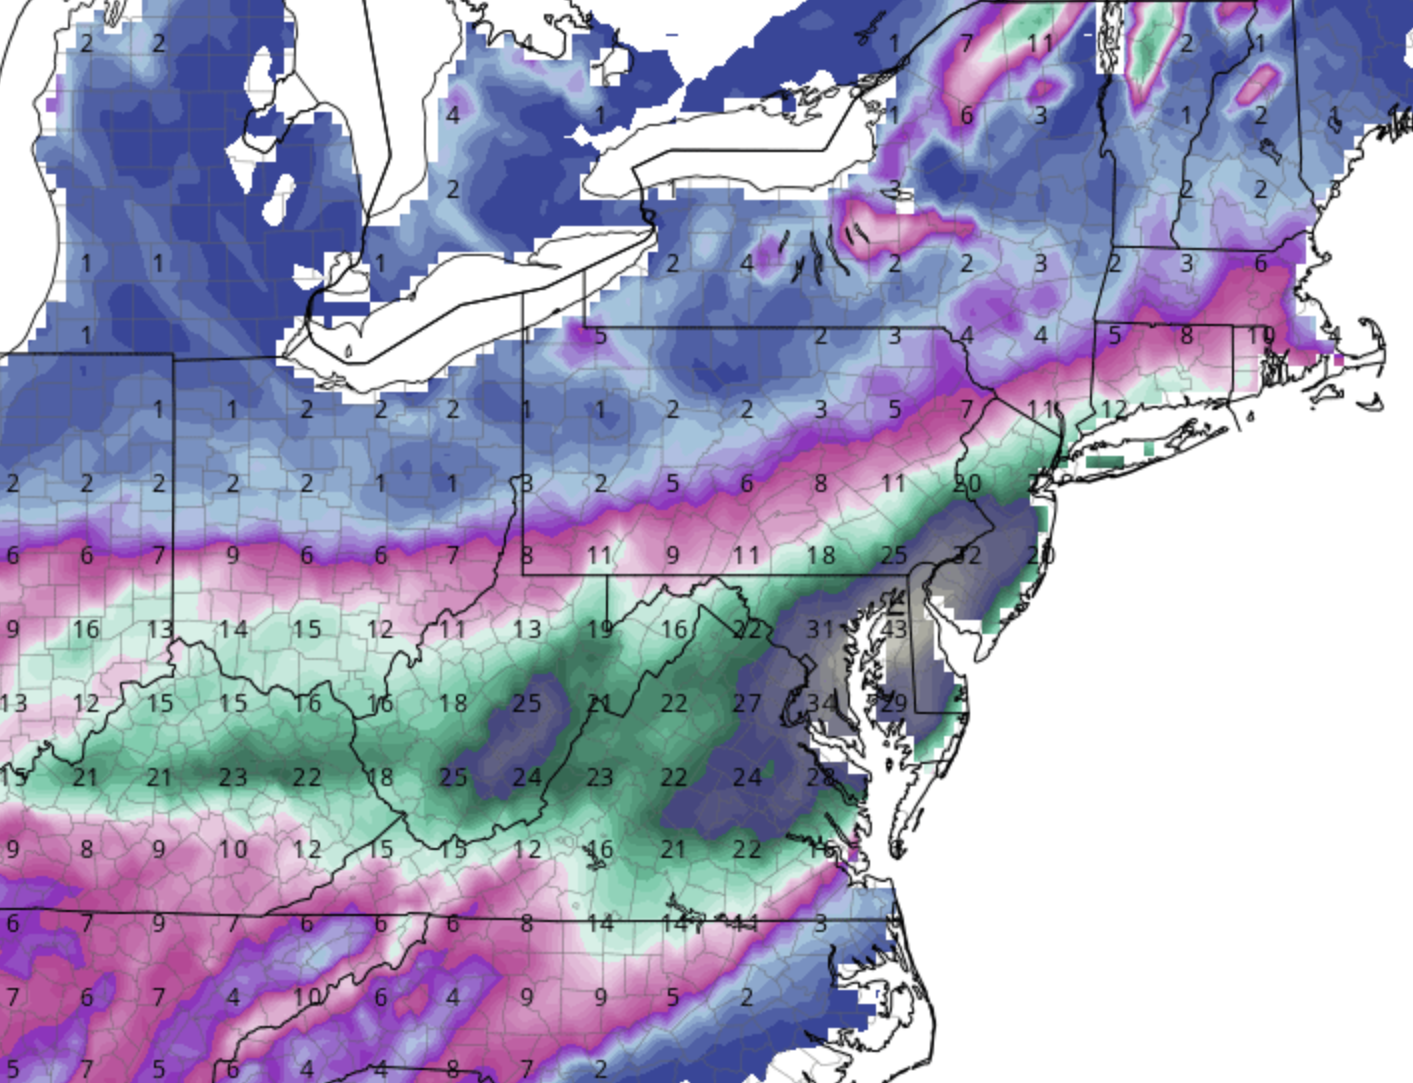
A couple of important points, from a model perspective: - The only modeling system that actually tracks and accumulates freezing rain every model time step is RAP/HRRR - For all other models, the various sites are making assumptions that the forecasted precip type on the hour applies to the entire hour. This is ok if they have hourly output from the model, but if it's 3-hourly (or even less frequent), it's pretty inaccurate - For most of the U.S. models, the precip type output shows freezing rain if the falling hydrometeors are rain, and the skin temp is at or below 32. So, the plots of "accumulated freezing rain" are tallying ice the same whether it's 31.9 or 26 - The FRAM stuff is better, but it's very much tied to rates and wind, and in my mind, it accumulates too generously when temps are marginal. - ZR at 31 degrees is very different if it's been in the 20s and temps are rising as opposed to being in the mid 30's with falling temps. None of these ZR products really account for that. So, even if you see big amounts of freezing rain on maps for the areas around DC, it's critical to assess the temperature trends. With temps in the mid 30s during the day falling to 31 or 32, I'm really skeptical about icing potential. The precip falling at night probably helps a bit, and maybe an initial burst of sleet cools surfaces enough, but the overall setup argues for the real icing potential to be well north and northwest of the city.
- 498 replies
-
- 14
-

-

-
NAM camp seems to be coming around to the idea of a later start too.
-
That's a weird evolution in the HiResW FV3, but thanks for pointing that out.
-
Is there any model other than the RGEM bring precip to most of the area during daylight hours on Wednesday? I know that several CAMs have that lead snow band in northeast MD, but it seems like a lot of guidance is dry for most of us until the tail end of the evening commute.
-
12Z NAM ptype and soundings suggest an initial shot of snow followed by a longer period of sleet. It eventually goes to rain or freezing rain but with very marginal surface temperatures until you get closer to the MD-PA border.
-
Still looks like one batch of rain during the midday and another this evening.
-
January Medium/Long Range: Chasing more snow to close out the month
high risk replied to mappy's topic in Mid Atlantic
Maybe, but the GFS always erodes cold air damming way too quickly, even at shorter ranges. -
1/19 - The Roulette Wheel 29 Black Storm - OBS
high risk replied to DDweatherman's topic in Mid Atlantic
FWIW, I found a case almost 3 years ago to the day in which we busted on a snowfall here locally as low-level arctic air was slower to arrive than progged. The RGEM was the outlier among models right before the event, showing a slower push of the front, and it was right. I don't want to make too much out of two cases in three years, but it's something I will file away in the back of my mind. -
1/19 - The Roulette Wheel 29 Black Storm - OBS
high risk replied to DDweatherman's topic in Mid Atlantic
I’m assuming that final band is on the leading edge of the arctic air. -
1/19 - The Roulette Wheel 29 Black Storm - OBS
high risk replied to DDweatherman's topic in Mid Atlantic
The Kuchera daylight ratios show us getting 37 straight hours of darkness. -
Clarification needed: the 12z soundings do not make it into the 12z HRRR. They’ll be used in the 13z cycle (which of course only runs 18 hours out…..)
-
That's awesome! But this really isn't about pulling in mild air from the ocean. It's a question of where the thermal boundary sets up at the start of the day and how quickly it moves southeast. The snowiest models move it quickly away, while the other solutions keep it close by, and we lose some QPF to a mix, before the cold air finally wins out during the afternoon.
-
1.5" in southern Howard County
-
I think that's really generous, but we'll see......
-
Looking at the RAP with Kuchera ratios for a snow event is like eating an entire stick of butter when you want a modest snack and then washing it down with a glass of canola oil.
- 957 replies
-
- 32
-

-

-

-

-
-

-
January Medium/Long Range: A snowy January ahead?
high risk replied to mappy's topic in Mid Atlantic
It's driven by lower-atmosphere temperatures. It's great at chopping amounts in marginal temperature environments, and the premise that SLRs will be better than 10:1 in cold environments has some truth, but it's not as simple as colder=better SLR, so it goes nuts when the air mass is cold. -
January Medium/Long Range: A snowy January ahead?
high risk replied to mappy's topic in Mid Atlantic
Thank you. The Kuchera drives me nuts. It always feels like this is 10:1 and this is the same case with Kuchera: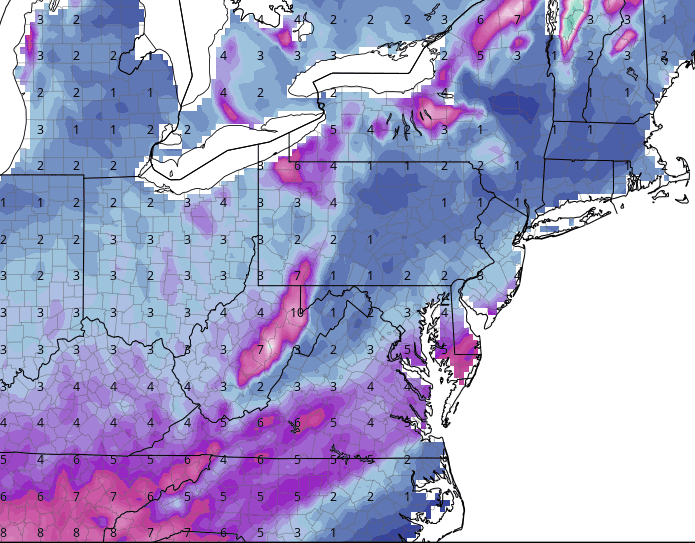

-
January Medium/Long Range: A snowy January ahead?
high risk replied to mappy's topic in Mid Atlantic
I'm in the "00Z NAM at f84 looks closer to the 18Z Euro at f90" camp. -
Up to 6" here in southern Howard County, with moderate snow falling under this good band.
-
You should have just said that you were looking at the NAM (which is 2 hours slower than most other guidance).