All Activity
- Past hour
-

September 2025 OBS-Discussion centered NYC subforum
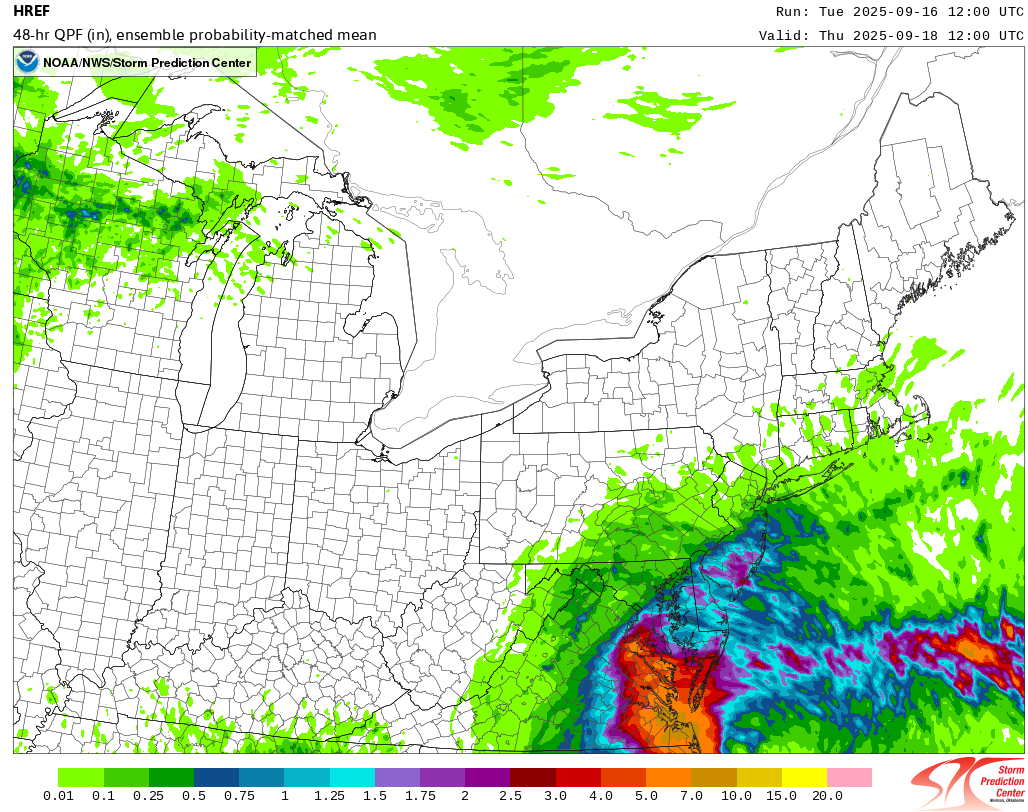
donsutherland1 replied to wdrag's topic in New York City Metro
The 9/16 12z HREF: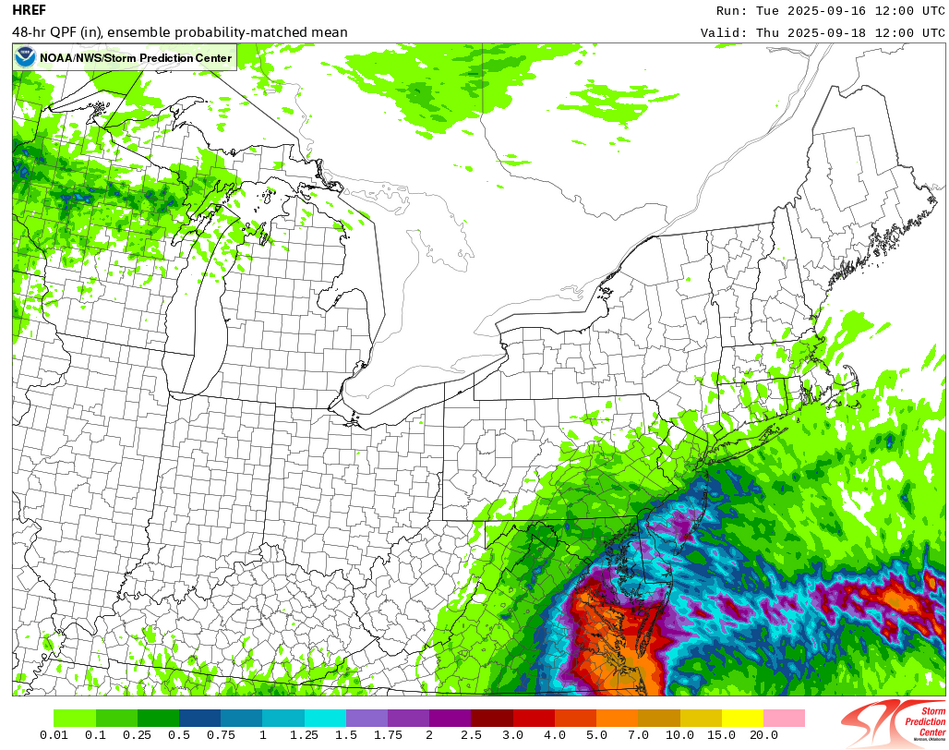
-

September 2025 OBS-Discussion centered NYC subforum
jm1220 replied to wdrag's topic in New York City Metro
Not always. Sometimes in these confluence situations the northern edge is too far north since dry air just eats away the precip. If the ridge or confluence to the north ends up weaker, the precip can climb north. -

September 2025 OBS-Discussion centered NYC subforum
Brian5671 replied to wdrag's topic in New York City Metro
Looks scattered and models won't be able to hone in on the exact areas that get a good downpour-obviously NYC S and E favored -
Great Q, big ten fan! 1. The UK has been found to be a top tier model when looking at average errors over the longterm. 2. I like to post all of the majors, good model or not. But I like to post the UK also for some other reasons like: -it’s the only one I can find with definitive textual output that’s easy to post without taking up image space and it allows one to post the entire run for a TC on just one page -so, it’s also good for documentation purposes for when one wants to look back at it for a particular TC or a TC that never formed like the recent Invest 91L -this complete run’s textual output comes out earlier than all but the Icon of the majors -The UKMET is often overlooked. You see lots of Icon, GFS, and Euro posts, but hardly any UK despite it overall being a good model. So, I happily fill in that gap.
-
Rain spreading into Lanco now .
-

September 2025 OBS-Discussion centered NYC subforum
Sundog replied to wdrag's topic in New York City Metro
Models are wishy washy with how much rain falls up here They mostly all bring the low up here to affect us, they just differ in how much rain actually falls once it's here. -

September 2025 OBS-Discussion centered NYC subforum
anthonymm replied to wdrag's topic in New York City Metro
Dont worry, we sizzle this friday and the last week of september + first half of october. -

September 2025 OBS-Discussion centered NYC subforum
LibertyBell replied to wdrag's topic in New York City Metro
Ant would be quite prolific lol -
September 2025 OBS-Discussion centered NYC subforum
Brian5671 replied to wdrag's topic in New York City Metro
there would be lots of wishcasting, posting of every model run, and radar hallucinations lol -
2025 Atlantic Hurricane Season
LibertyBell replied to BarryStantonGBP's topic in Tropical Headquarters
it looks more like a noreaster to me, Larry -
Occasional Thoughts on Climate Change
LibertyBell replied to donsutherland1's topic in Climate Change
It's Karma if that happens, for the cruelty we do to other animals. -
Occasional Thoughts on Climate Change
LibertyBell replied to donsutherland1's topic in Climate Change
People will still say they can adapt, remember humans came from Africa, so if we evolve to that kind of climate all over the world, we'll just return to our roots -
Yes! Not drought / rainfall related... 100% cicadas related...
-
September 2025 OBS-Discussion centered NYC subforum
LibertyBell replied to wdrag's topic in New York City Metro
This feels like winter and wondering where the cut off will be lol. Either way, if this kind of system happens in the winter, there will be a lot of hair being pulled out watching ACY get 20 inches of snow while this area probably wouldn't even reach 6 inches. -

2025-2026 ENSO
40/70 Benchmark replied to 40/70 Benchmark's topic in Weather Forecasting and Discussion
As do I, but again....don't expect the pervasive of an RNA. -
September 2025 OBS-Discussion centered NYC subforum
LibertyBell replied to wdrag's topic in New York City Metro
I wish August into September had been warmer, but the real heat ended after July. -
I see 22-23 as a good analog.
-
Yea, I'm sure it would be warmer for Xmas.
-
September 2025 OBS-Discussion centered NYC subforum
LibertyBell replied to wdrag's topic in New York City Metro
this is definitely going to be a noreaster and not a *coastal low* coastal low is the most PC term I can think of -

September 2025 OBS-Discussion centered NYC subforum
Stormlover74 replied to wdrag's topic in New York City Metro
Wind is picking up -

2025 Atlantic Hurricane Season
bigtenfan replied to BarryStantonGBP's topic in Tropical Headquarters
Just a question. You seem to quote the UK model quite often. Is it that good of a tropical model? -
Nothing for me to watch on radar anyway. Dry as a bone with peeks of sun. No significant rain since July 1-2
- Today
-
2025-2026 ENSO
40/70 Benchmark replied to 40/70 Benchmark's topic in Weather Forecasting and Discussion
Okay, I absolutely agree with this. The is in sync with my observation about how dialectical seasonal forecasting has become. -
2025-2026 ENSO
donsutherland1 replied to 40/70 Benchmark's topic in Weather Forecasting and Discussion
I agree. I don't think it's non-viable. I just don't think it's the slam dunk some are making it out to be. -
2025-2026 ENSO
40/70 Benchmark replied to 40/70 Benchmark's topic in Weather Forecasting and Discussion
Solar max and QBO east seasons aren't exactly void of blocking potential, either. Research by Gray et al, 2004 elaborates on the complex relationship between the solar cycle and the QBO phase. Integrating Solar & QBO Research for a Comprehensive Polar Forecast The aforementioned Holton-Tan relationship, which dictates that an easterly QBO is correlated with both a greater incidence of, and an earlier development of SSW, becomes more complicated when considering the solar cycle. In some cases, when the QBO and solar cycle are in conflict, they can either over ride one another or even cancel each other out (Gray et al 2004). Here is a list of combinations and the theorized relationships for clarity. Solar min/W QBO: This is entirely consistent with the Holton-Tan relationship in that the westerly QBO essentially "wins". The PV is likely to be stronger than average until the final warming in spring. Solar max/W QBO: In this case, the Holton-Tan relationship is applicable early on in the season, as major warmings are unlikely. However, the Holton-Tan relationship reverses mid winter and the latter portion of the season from February onward is susceptible to warmings and major PV disruption. Winter 2024-2025 was a textbook example of this. Solar Min/E QBO: There are no inconsistencies here, as the entire season is more prone to polar vortex disruptions and SSW as per the Holton-Tan relationship. Solar Max/E QBO (2025-2026): The Holton-Tan relationship applies early on given that PV disruptions are likely in December, before the relationship reverses and they are less likely later in the season