All Activity
- Past hour
-
-
AI models picked up on this way before the conventional models…. I think its time to start giving way more stock to the ai models
-
I‘m not sure exactly what you’re asking. But I do know that both the Icon and the UKMET on every single run going back to when they first had this on their runs 5+ days ago had this after moving it N to NNW hook sharply right OTS. They were absolutely stellar and were far better than any other non-JMA models with their essentially perfect records. I have the JMA as a clear 3rd as only its 12Z 9/23 run hit NC. All others hooked sharply right and OTS although two of them (12Z 9/25 and 12Z 9/26) combined with Humberto to make one storm. All of this is still on Tropical Tidbits for those who are interested. They have runs back a full week. Check them out before it’s too late!
-
Central PA Fall Discussions and Obs
Mount Joy Snowman replied to ChescoWx's topic in Upstate New York/Pennsylvania
Low of 60. Completely exhausted from this past weekend, being up at Penn State and the emotional roller coaster that ensued, then Green Bay getting a tie last night, with both games going into the wee hours. I’m shot. At least the upcoming weather looks delightful. -
So we'll have a cat 10, cool.
-
The most "fun" and "challenging" part of this weeks forecast is tomorrow's sky cover
-

Central PA Fall Discussions and Obs
sauss06 replied to ChescoWx's topic in Upstate New York/Pennsylvania
Perfect, opening night for the Bears -
Picked up another .19" last night. Up to 2.88" for the month.
-
Yes and no....I agree generally with what you are saying, but it's not the warming itself that is prohibitive to having good seasons....it's the western warm pool in-and-of-itself that is the reason NAO blocking hasn't been paying dividends....AKA +WPO. Do me a favor and find a great SNE season that also had a strongly +WPO......you can't find one...not in 1948, and not in 2025. https://psl.noaa.gov/data/correlation/wp.data Extreme +WPO being prohibitive isn't a recent development, but rather the consistency and strength of it is. Since 2016-2017, 2021-2022 is the only -WPO season we have had......the concern is that this is some sort of permanent pattern as a result of CC. While we won't know definitely for another 10 years or so, I am still of the opinion that the globe will find a way to achieve balance, and will wait before seeing otherwise. As for the WPO....we here in SNE can thrive with a modestly +WPO value, as was the case in 2017-2018....and yes, we can still get a -WPO season, as was the case in 2021-2022. That being said, SSTs over the eastern Indian ocean do look supportive of +WPO, but the hope is that more abundant E PAC warmth can counter that in much the same manner that the West warm Pool did with El Nino a couple of seasons back...think Relative Ocean Nino Index https://www.cpc.ncep.noaa.gov/data/indices/RONI.ascii.txt Always remeber that NOTHING operates in a vacuum, so don't obsess too over any single point on the globe, as ultimately it is not what is going on at said point that is paramount, but rather what is going on at said point relative to the rest of the globe.
-
Finally getting good rainfall at my house. It’s been so long the grass clippings from when I last mowed 3 weeks ago are still visible
-
2025 Atlantic Hurricane Season
WxWatcher007 replied to BarryStantonGBP's topic in Tropical Headquarters
I think the risk is still there, especially as climo shifts to the Gulf/Western Caribbean. -
Last couple of nights have left me wishing I hadn't uninstalled.
-
Poplar trees are crunchy overly toasted toast in my neighborhood. Lawns are still green cuz we've had a couple showers.
-
I hope so. I haven’t done too much thinking about winter yet but it’s less that it’s been dry thus far in my mind and more the background state of warm seasons and worse, that it seems our results are untethered from patterns that normally would be good to great for us. That concerns me. Like @CoastalWx, I’ve totally lost faith after the last decade.
-
September 2025 OBS-Discussion centered NYC subforum
anthonymm replied to wdrag's topic in New York City Metro
Depressing. -

Spooky Season (October Disco Thread)
WxWatcher007 replied to Prismshine Productions's topic in New England
Truly horrific. -
Idk if anyone can confirm/ verify but hasn't the icon been the most consistent with this nearly going up the florida coast before going east for many runs? I may have my models mixed up but I can't remember
-
2025-2026 ENSO
40/70 Benchmark replied to 40/70 Benchmark's topic in Weather Forecasting and Discussion
Now, one could argue that the character of La Nina isn't important since it's so weak, which is true.....then you would have to default to this: Solar Max/E QBO (2025-2026): The Holton-Tan relationship applies early on given that PV disruptions are likely in December, before the relationship reverses and they are less likely later in the season. The final warming is of course the exception to this rule, while it is usually more relevant for spring, it can and does sometimes occur early enough to have an impact for the major population centers in terms of late season cold and/or snowfall. Below are a couple of annotations to aide in the simplification and visualization of these relationships. Interestingly enough, although statistically speaking early and late season disruptions are favored, there is a an outlier set of major PV disruptions noted in the solar max/E QBO quadrant of the chart above. This also becomes a theme when comparing the solar QBO analog composites. Here is a list of cool ENSO/ solar analogs for the winter 2025-2026 season. Here is a DM composite of these seasons. There are obvious similarities between the Solar composite (right) and the QBO composite (left) given that they both feature high latitude blocking and poleward Aleutian ridging. The primary difference is that the QBO analog composite is biased more towards early and late season NAO blocking, whereas the solar composite focuses the NAO blocking more in the early portion of the season. The discrepancy is primarily with respect to late season owed to the aforementioned outlier set of mid winter PV disruptions, which is evident in the list of SSW analogs compiled from the solar and QBO composites, respectively. January 17, 1971: PV Split December 4, 1981: PV Displacement February 11, 2001: PV Split January 2, 2002: PV Displacement February 22, 2008: PV Displacement January 7, 2013: PV Split February 14, 2018: PV Split March 20, 2025: PV Displacement The majority of the SSW events are split between the mid winter months of January and February with three events per month. There is also an outlier event in December, 1981 and March 2025. The primary analog events of January 17, 1971 and February 11, 2001 were both accompanied by PV splits and are the only two members to appear in both of the QBO and solar analog composites, which lends more credence to the mid winter outlier scenario that contains 6/8 the analogs. Thus the favored timeframe for a SSW and subsequent split of the polar vortex is during the January 14 to February 14 timeframe, which favors late season NAO blocking to commence roughly between February 8 through March 6. -
That's nuts! We only got .80" this month and 1" in August.
-

2025-2026 ENSO
40/70 Benchmark replied to 40/70 Benchmark's topic in Weather Forecasting and Discussion
Not much has changed in the September update: The persistence of this regime is generally supported by the consensus of guidance, which is perhaps slightly more supportive of an eastward leaning basin-wide event by winter, as opposed to a bonafide east-base event. This is perceived to be a rather trivial discrepancy, especially given the modest strength of the ENSO event. The newest El Niño Modoki Index (EMI) guidance from JAMSTEC has also remained fairly consisted in it's depiction of an EMI value of around -.20 to -.30 during the boreal winter season. This range is similar to the EMI analogs of 1995-1996, 2017-2018 and 2021-2022, which is supported by the similarity in both the placement (near 140 longitude) and the intensity of the respective subsurface cold pool analogs relative to 2025. -

2025-2026 ENSO
40/70 Benchmark replied to 40/70 Benchmark's topic in Weather Forecasting and Discussion
Weak, East-Based La Niña Impact on Extra Tropical Pacific The expectation for both a weaker and east-based La Niña influence during winter 2025-2026 remains consistent with earlier analysis this summer. Note that the behavior of the subsurface during the month of August was anticipated quite well last month, and continues to set the stage for an eastern biased event centered around 120 degrees longitude. Historically speaking, in east-based La Niña winter seasons there is both a high latitude blocking signature and a prevalent poleward Aleutian ridge displaced to the northwest, off of the west coast of the CONUS relative to the central-based and Modoki La Niña composites. These are shared features with the weak La Nina composite, which is similar due to the fact that the majority of east-based events are also weaker cool ENSO episodes . Thus it is not surprising that the composite of the three primary El Niño Modoki Index analogs of 1995, 2017 and 2021 were all centered in the vicinity of 120 West longitude, and 2/3 were weak events; with the 2021-2022 La Nina representing the lone moderate season. Nor is it a shock that the pronounced Aleutian ridging positioned off of the coast and protruding poleward in conjunction with some degree of NAO blocking is also very evident. -

2025-2026 ENSO
40/70 Benchmark replied to 40/70 Benchmark's topic in Weather Forecasting and Discussion
Here is +QBO: While it looks like the ridge is a bit more poleward in this composite, I def. don't think it looks flat in the other one. I would say it has more to do with the type/intensity of cool ENSO than it does QBO. Def. more NAO blocking in the Easterly QBO composite. - Today
-
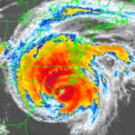
BULLETIN Tropical Storm Imelda Intermediate Advisory Number 11A NWS National Hurricane Center Miami FL AL092025 800 AM EDT Mon Sep 29 2025 ...IMELDA CONTINUES NORTHWARD AND A LITTLE STRONGER... ...TROPICAL STORM CONDITIONS CONTINUE OVER THE NORTHWEST BAHAMAS THIS MORNING... SUMMARY OF 800 AM EDT...1200 UTC...INFORMATION ---------------------------------------------- LOCATION...26.3N 77.0W ABOUT 10 MI...15 KM SE OF GREAT ABACO ISLAND ABOUT 265 MI...425 KM ESE OF CAPE CANAVERAL FLORIDA MAXIMUM SUSTAINED WINDS...50 MPH...85 KM/H PRESENT MOVEMENT...N OR 360 DEGREES AT 9 MPH...15 KM/H MINIMUM CENTRAL PRESSURE...993 MB...29.33 INCHES
-
BULLETIN Hurricane Humberto Intermediate Advisory Number 19A NWS National Hurricane Center Miami FL AL082025 800 AM AST Mon Sep 29 2025 ...HUMBERTO A LITTLE STRONGER AND EXPECTED TO PRODUCE DANGEROUS SURF FOR BERMUDA AND MOST OF THE U.S. EAST COAST THIS WEEK... ...TROPICAL STORM CONDITIONS POSSIBLE IN BERMUDA ON TUESDAY... SUMMARY OF 800 AM AST...1200 UTC...INFORMATION ---------------------------------------------- LOCATION...27.5N 67.3W ABOUT 365 MI...585 KM SSW OF BERMUDA MAXIMUM SUSTAINED WINDS...145 MPH...230 KM/H PRESENT MOVEMENT...NW OR 320 DEGREES AT 14 MPH...22 KM/H MINIMUM CENTRAL PRESSURE...938 MB...27.70 INCHES


