Typhoon Tip
-
Posts
44,869 -
Joined
-
Last visited
Content Type
Profiles
Blogs
Forums
American Weather
Media Demo
Store
Gallery
Everything posted by Typhoon Tip
-
It's almost like a TUTT on steroids in some ways.
-
By small amounts ...some more coherent than others, the guidance were too deep/structurally evolved for what is observed at 12z May or may not be indicative of much. We'll see. We may be disappointed in Now-cast ranges. I'm not completely sold on how far above pedestrian inclemency this will be. I think the lunar tides and surface feed-back should be fun either way. Op ed that no one asked for but ... my original impression of this scenario from 2 or 3 days back was that it was dubiously too amplified in the guidance. Two main reasons for suspecting so ... 1, the total S/W wave mechanics feeding into the region were very weak. As far as I can tell that still seems to be the case. At the time this was a bit of a head scratch as to what was driving this ordeal. The best I could surmise was that this was a very (if perhaps unusually so) non-linear in origin. The circulation mode from the eastern Pac across N/A is technically is in a strong, albeit transient, negative PNAP. The polar branch retreated N very quickly, earlier in the week - so fast it left a weakness pearled out from the S Lake through the mid Atlantic.. Similar to a "pinch cut-off" you see in April climo - but it is doing it amid a higher ambient height medium. You realize, the hydrostats are in the mid 560s during this - we've been close to 90 F at the surface with 566 dm thickness before! Yet, it's so raw.. It's bizarre, maybe some tized aspects going on... Anyway, a ridge from James Bay clear to Florida would be geophysically hard to maintain, particularly when the flow around it is not that strong. So the heights inside 'implode' ... My feel on that is that the models were over assessing this ambient, large scaled mass balancing response, as a total forcer. 2, the other reason is much simpler ... guidance et al tend to shed amplitude as they move events from the extended toward the short lead periods. It's really quite a dependable corrective behavior. It's never been abundantly clear why they do this, but I suspect it has something to do with not yet seeing the emergence of noise/offsets/and interferences that will inexorably arise - they only see the system with the most prominent physical signature out in time. If, then, the prominence is the only thing there is, they are maximizing it. Something like this...
-
Occasional Thoughts on Climate Change
Typhoon Tip replied to donsutherland1's topic in Climate Change
A "projector theory" of sorts is probably an easy back into when the "holographism" idea was put forth. "Where is the image coming from then?" ..etc. Different processes in getting there, though. The ontological manifestation of reality in my Sci Fi idea is that every step after the Plank unit communication, creates a new layer of synergism ... with new synergistic foci. This is why birth happens at our level ... one among all actions traceable to the first primal creation. Those then interact, because their progenitor foci also interacted, and on and on... producing new layers with new foci interactions. Incomprehensibly large numbers of synergistic products later ... the naked tree against the gray winter sky looks identical to a higher resolution rendering of a river's complete water basin. And hence ... the "inheritance" I was describing in the earlier missive is exposed, as is reality. hint hint... nothing is truly unique or original. The primitive mind - perhaps - categorizes as a survival tactic, but then is imprisoned for eternity in a perception that the categorization describes reality. The mathematics is reused and repurposing, but it's just describing the relationships of the synergistic field - which means we're certainly species -capable of perceiving that something is going on that connects the stars. So..okay, my idea may bear some semblance to your Loop QT - and in fact, ...I think I saw a 5 minute conjecture on that either in a meme, or on the Science channel with a Sean Carol type - though not him... Can't specifically recall, but I can understand why you think it may be similar. -
ah, gotcha Yeah, and I'm also waiting on the NAM's dependable NW bias to kick in, too. we'll see
-
Surf should be fun. Don't need those ( likely ) hyperbolic ideas of "90 mph" wind gust coming out of some the usual weather pundits to be a substantial ocean risk for the shores. This looks like a 48 hours of sustained 35 mph integrating energy into the tumult. What do the lunar guys say?
-
-
Septorcher 2026 Discussion - Endless Summer
Typhoon Tip replied to Damage In Tolland's topic in New England
It's actually recovered pretty well here... 37 to now 65. We can still put ~ 1.5 hours of heating into this bad boy. Not sure we're going higher than 68 at this time of year and soundings but ... close to able to open the windows and let some of that 'warm' air in... I play this game every autumn ... how long I can wait until I kick on the heat. It used to matter for me as I was a base-board resister heated home up until last year. Resisters are money pits! I've since installed a compressor/Mini split sys and it's fractions of the cost and vastly more efficient. Also updated the windows and modernized some other stuff so... it's probably no big whoop just to flip it over to Heat from Cool but I still like the challenge haha this is year is ahead of schedule. The game usually doesn't commence until somewhere October 10ish... I've been actually trading punches with it for 4 days at this point. This morning I was about to flip but I got distracted by work calls... by the time I got off it's in the mid 60s and full sun and I'm like well... -
I can already see the models festering in their schemes to create a snow chance in October ... Probably continues to deepen as these successive fast moving cold knife air mass inserts eventually mean bouts of early Lake Effect cold/LR convection grapple and cat paws. Post the 15th this all gestates into an actual snow chance perhaps. Or not, but the synoptically cryo supportive. **This isn't associated with ENSO I should also add ... warm ups after these successive cold shots may be equally handsome
-
Septorcher 2026 Discussion - Endless Summer
Typhoon Tip replied to Damage In Tolland's topic in New England
Yeah ...last night with a nearly missed frost here. 37 ping temp but it appeared to really hover around 38 ...whoosk. Chilly. Pretty sure this is ahead of schedule against conventional climatology, ... definitely is so against relative climo associated with CC! 58 now so explosive recovery I can already see the models festering in their schemes to create a snow chance in October ... before the compression of winter allows NINO to take over for whatever that's gonna entail ... Fun year for weather incoming. Doesn't say jack about whether that's coming with winter d-dripper's withdraw symptoms in mind, however -
Not meaning to digress the thread but all of humanity appears to be swooning over and guided by the 'grand presentation' these days. It's like we're all participating unwittingly in a dystopian cinema - if not delusion. It's a movie about the evolutionary scaled, socio-technological experiment we're sending our own species through.
-
Agree. And the Euro ... described below. As far as the GFS ...the difference seems to be that it doesn't include a tropical source. It is more purely cooler thermodynamic/baroclinic, and as such a weaker total cyclonic recovery takes place when this ...weirdness closes off. In and of itself I suspect it is too strong ? Not certain on that; just a-priori on modeling tending to bias on the strong side with everything at this range ...only to Charlie Brown the top 10, 20 ...30% off results at go time... I think there's wiggle room in this scenario as far as amplitude results. The Euro on the other hand, heh. It pretty clearly indicates what it "thinks" is a kind of 'zygote' tropical entity straddling or just barotropic sidled to the frontalysis boundary, which it is extending between the Carolinas and mid way to Bermuda over these next 48 hours. WPC currently analyzes a stationary boundary with low on it, however. Still, it first appears more tropical in the phase space nearing 988 mb as it moves W toward the VA Capes lat (off shore).. Then drifts NNE toward the Benchmark, losing those characteristics in a less hospitable environment, before undergoing some sort of delayed baroclinic inject, it then re-deepens to 984 or so as it retrogrades back W along or S of LI.. Helluva sell for meticulous skill - I find that overall evolution either extraordinary, or ... unlikely to be so well handled and accurate by the Euro so precisely. We'll see. It's interesting... All of it I suspect is more open to uncertainty than many are likely aware. Just higher than normal for this range.
-
Septorcher 2026 Discussion - Endless Summer
Typhoon Tip replied to Damage In Tolland's topic in New England
No shit ...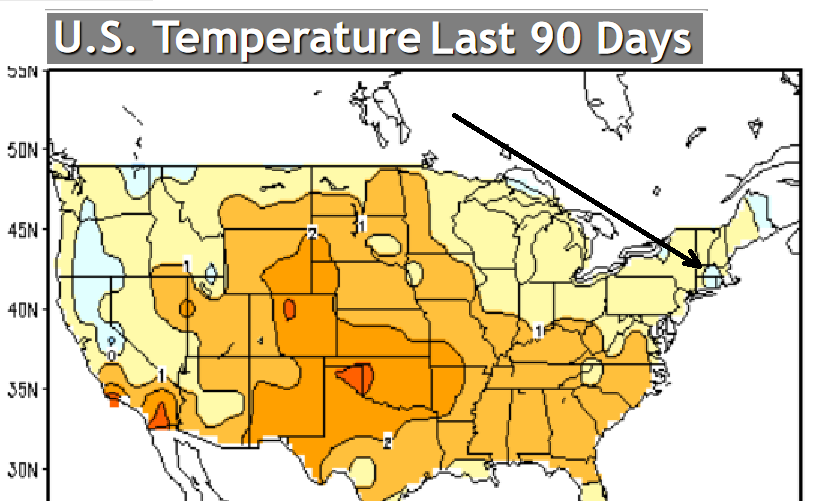
-
heh... let em have their fun. They need it. These addicts are rocking in their chairs, blood shot eyed and smelly in straight jackets withdraw for ...what has this been? 8 months since jack shit's happened? I think the February blizzard that only struck SE Mass and turned out be a blue baller for most else was the last d-drip of any stoning value they've had. lol No, but it is a nice homage of winter. You have a cool anomaly ( sort of ...) with high pressure N imparting NE/E trades into the area, and "some" kind of low stalling in a climo recognizable fashion.
-
Occasional Thoughts on Climate Change
Typhoon Tip replied to donsutherland1's topic in Climate Change
https://phys.org/news/2026-09-unevenness-global-regional-speedups-emerge.html -
Septorcher 2026 Discussion - Endless Summer
Typhoon Tip replied to Damage In Tolland's topic in New England
https://phys.org/news/2026-09-unevenness-global-regional-speedups-emerge.html -
Septorcher 2026 Discussion - Endless Summer
Typhoon Tip replied to Damage In Tolland's topic in New England
It's significance is being masked some by CC. We have to consider this in a relativistic sense - Earth as we type and read is putting up the 2nd warmest it has ever been since humanity developed any awareness of the subject matter - a.k.a. hundreds of years. But this is also probably true in climate recreation/reanalysis going back much farther... It is a reasonable assumption that relative to that state of affairs, we have to be quite cold in fact to even get a negative anomaly day at all. It's both anecdotal, as well as objectively clear just by record and empirical data, that it is easier to be above normal, if only by decimals, than it is to be below by that same margin. ...etc Just a personal observation ... current hourly observations have 62 to 65 F over eastern Mass/coastal sites. From near I-495 and points went, we're 57-ish. We are actually getting an inverse thermal conditioning penetrating from the ocean. It's not that unusual to do so in general? During the cold months/winter, when there is a coastal cyclone with flow coming from the NE/E, this often takes place. However, doing it under fair where not full sun, in September, during this latter leg of CC no less... very relative. Particularly when/while the rest of the planet is so warm, ... it may even argue that we are, in the relative sense, one of the coldest locations there is per latitude at this moment. When it is long proven harder to actually get a negative day at all. -
Septorcher 2026 Discussion - Endless Summer
Typhoon Tip replied to Damage In Tolland's topic in New England
It's not really noise though if one can identify the cause of the differences... Not meaning to be priggish ...just that it seems pretty clear - to me - that if the smear cross Cuba and gets pulled in en masse like the Euro, it's getting a huge physical feedback from that. I think Scott mentioned feedback yesterday - no arg there but 16 dm of?! "Noise" seems like a spray of offsetting probabilities... Well, this explains where. The GFS is less proficient with that infusion... The Euro, more. Results follow - But I agree, higher resolution is worth wondering - -
Septorcher 2026 Discussion - Endless Summer
Typhoon Tip replied to Damage In Tolland's topic in New England
Makes sense ... I was attempting to be in the water near the end of July up near Rye Beach/NH coast, and the 57ness of it was too much for the balls to handle... Couldn't really go in deeper than knees. 3 years ago around that same time I was there, and the 73 F water was warm enough that we were able to spend over an hour on boogie boards with no wet suits... Granted, this was an excessive warm anomaly for that area. Now, this is just one bloke's take on it, but I do check the summer progression of SST around here as a matter of course. And world over for that matter. As an ongoing observation I was never very impressed with the buoy numbers this summer. Seemed this was a regression year for local SSTs ... whether normal or not, notwithstanding. Just less in the way of residual heat to keep things elevated into autumn? -
Septorcher 2026 Discussion - Endless Summer
Typhoon Tip replied to Damage In Tolland's topic in New England
There's some sensitivity to deterministic solutions coming from the amount of positive vorticity ( how much?) getting pulled out of the Caribbean and injected between 42 and 90+ hours or so. This window of interaction is being slightly differently handled in the Euro vs GFS. The Euro is sweaty love-making. The GFS isn't sure what its feelings are ..heh Recent Euro runs are quite proficient/bullish with the result, because it is massively infusing this junk/failed zygote tropical entity into the agglomeration of weak S/W aspect that is wobbling through that lat/lon of the MA by the end of that time range. This transition of annotated charts over the course shows what happens when even weak N stream gets injected with a pithy diabatic heat source... The GFS is occasionally not as proficient with/in the integrating idea. The Euro has been rather persistent in forecasting a proficient phase at a range when modeling et al typically has higher average error when handling delicate matters. I took a look at the ensemble means of both ... it appears the idea of vestigial tropical infusion and subsequent unusual feedback due to that source is what I was personally missing yesterday in my analysis at that time. That does not mean it will happen like the Euro, per se... the 00z GGEM was less, as was the 06 GFS... We'll pick and choose ( ha, I can imagine which this particular group will pick!). But there's enough support from the orbit of the ens means of both camps to suggest a Euro idea isn't impossible. It is, however, one of the stronger members out of the whole EPS cluster, whereas the GFS is in the apparent interquartile mean of its own group. This is why suggest the scenario is a bit touchy. Smaller percentages less of the lower latitude diabatic source-inclusion into the holistic set up... will probably manifest something more like the a flatter/weaker less entertaining surface result. For now ..I'm willing to go less than the Euro's bigger dawg with this thing, but give it a nod should we get into a better deterministic range and the other models start getting more proficient/synergistic like that.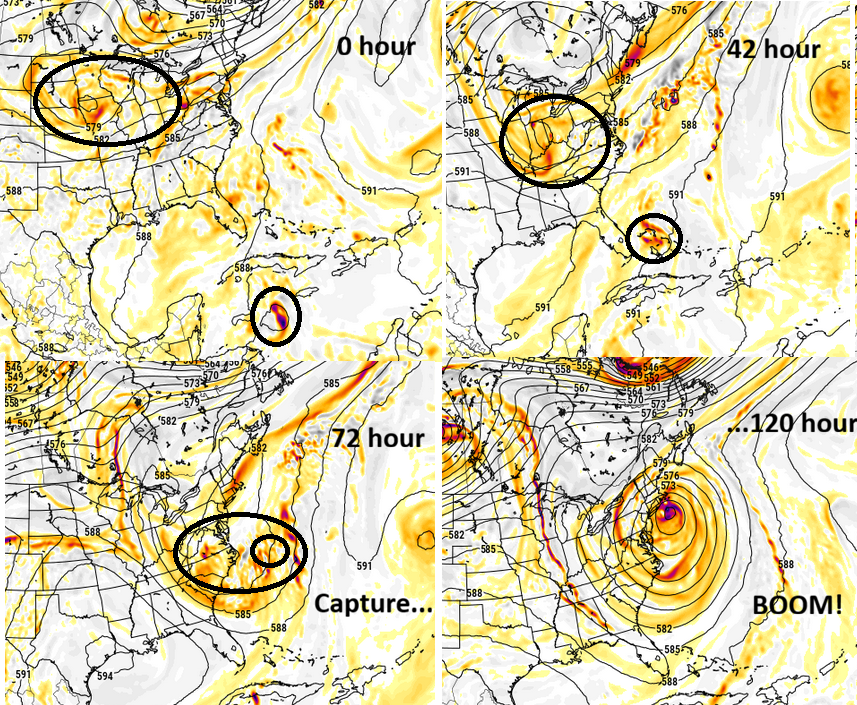
-
Occasional Thoughts on Climate Change
Typhoon Tip replied to donsutherland1's topic in Climate Change
It seems unification has taken a backseat to 'quantum gravity'. It may be that in efforts to unify the 4 forces ...they keep running into a mathematical wall they can't get over because they've slaved the logic to (inevitably) needing to Quantize gravity - which I wonder if that can be done. But again, I don't believe that is possible in 'this' universe. Paraphrasing before ... gravity may have a field equation/origin that is different from its force - 'why' the force emerges. My conjecture is a Plank scale "pixerlarium" flow of information density. Analogous to how electrical flow produces a corresponding magnetic field - as an oddly useful analog. The former form ... it's not electrons, however. It's "bytes" of "god code" Only the gravity field is a monopole ... whereas magnetic monopoles have not yet been conclusively observed in nature. One creepy idea I was dancing with is that it is dipolar but the other side is "on the other side" It's kind of like starting out with a goal that would eventually require quantum gravity. Why not? every metric in physical math is quantum or can be quantized. But, my conjecture is that Einsteinian/GTR emerges out of Quantum Mechanics - trying to reconcile the math in either direction would then become a universal, improper epistemic direction. Another way to describe "synergistic heredity" is a "grand projector theory" Imagine the analog, a reel-to-reel cinema machine humming away... The gears inside are the plank mechanics, the lens is the quantum mechanical 'event horizon' and the the screen is the result. Machine --> Lens --> Reality. We are the far right. GTR is the mathematics of the far right result. Not the source. I don't believe Quantum Mechanics is the source, either. Again, the pixelarium is where the discussion begins in this holistic idea. Hint hint... a black hole event horizon is a boundary in which the complete reality wave function collapses - reality as we know it suffers decomposition at that boundary ... perhaps a distorted sort of "primordial" version. The "object" lurking inside is pure Plank information - if the information slows below the pixel-to-pixel 'communication' rate of one C, all heredity ceases. No reality. Not as we know it. There is no state of no pixels. The entire physical volume of the cosmos is pixels. There is no 'space in between' in that sense. More over, the most fundamental/rudimentary information level is 0 point energy. The information has a fixed transmission rater of one C at 0 point energy. Otherwise known as the vacuum energy density. 10¹⁹ KeV A pixel is equivalent to a Plank unit .. roughly 10⁻³⁵ m As we add information - the drag is gravity but what is it dragging against? the expansion of the cosmos. -
Septorcher 2026 Discussion - Endless Summer
Typhoon Tip replied to Damage In Tolland's topic in New England
Not living with cold ocean surrounding us ... -
Occasional Thoughts on Climate Change
Typhoon Tip replied to donsutherland1's topic in Climate Change
I believe that the reality we perceive is the end product of what I call 'synergistic inheritance' "plank pixels" exchange information and a byproduct of that interaction ( which takes place at C rate, never more, never less...) creates something near or perhaps substrate to the Quark spectrum ..etc. the formulation of the fundamental forces of nature takes place in this near infinitesimal scale ... whereby larger and larger constructs emerging and the Quark spectrum. we recognize (eventually) as energy and matter. -
Septorcher 2026 Discussion - Endless Summer
Typhoon Tip replied to Damage In Tolland's topic in New England
12z UKMET's your dealer if you're seeking a d-drip hit off this thing ... -
Septorcher 2026 Discussion - Endless Summer
Typhoon Tip replied to Damage In Tolland's topic in New England
Ha y'all's just got model magnified ? -
2026-2027 Record-breaking El Nino
Typhoon Tip replied to Stormchaserchuck1's topic in Weather Forecasting and Discussion
Whether this is the case on January 15 ... who knows. But this is an apparent unique - perhaps historically so - state of affairs we are in heading into Autumn. When comparing other warm ENSOs that were anywhere near peers with this one, the PDO was in better agreement. Those being 1982-1983, 1997-1998 and 2015 very warm events. But, +.7 isn't 1.0 The offset .3 isn't exactly a trivial anticorrelation value. 30% of PDO/ENSOs didn't want to cooperate ( according to CDC). The qualitative difference being ... it is easier on intuition to see a weaker warm ENSO being more likely to anticorrelate - break downs in the machinery in weaker gradients..etc. However, very powerful ones would instinctively dominate the hemisphere because tall heat S abuts canonical seasonal lowering hgts N, and that's proficient coupling. That's the '82/'97/'15 events. This ENSO is (presumably) as powerful ( even in a RONI dimming consideration ... it's just too overwhelming? ) yet having this over-arcing -PDO is thus uncharted water ( pun hopefully annoying ... ) It's hard to say how that will impact the circulation 'scaffolding' of the hemisphere, should it persist. This latter bold being a key question. There is a modest pos correlation between the PDO and EPO in November, which strengthens significantly through the winter. This is intriguingly implicating for both warm and cool N/A. In a shortened planetary wave lengths, the -EPO dives the mean height anomaly distribution over the west. This correlates/teleconnects to ridging/+geopotential hgts 80W. But in the winter, when the wave lengths are necessarily long as a physical response to high seasonal velocity foot, the -EPO tends to mean the lower heights progress E fairly quickly. That's the reason -EPOs cause cold snaps. However, the STJ "should be" lurking over TX into the TV and lower MA; so what then should this mean if an ongoing -PDO/-EPO keeps sending in knuckle achers... This sort of 'unicorn' scenario has been discussed among some of us, already. It's not confident enough to predict... for one, we don't know if this -PDO/atmospheric circulation mod over the arc of the N. Pac will continue. You know, that big winter storm - the first of the two - that took place last winter is a reasonable implication/typology. That January one was a broad continental scale overrunning event really..