GaWx
-
Posts
19,030 -
Joined
Content Type
Profiles
Blogs
Forums
American Weather
Media Demo
Store
Gallery
Everything posted by GaWx
-
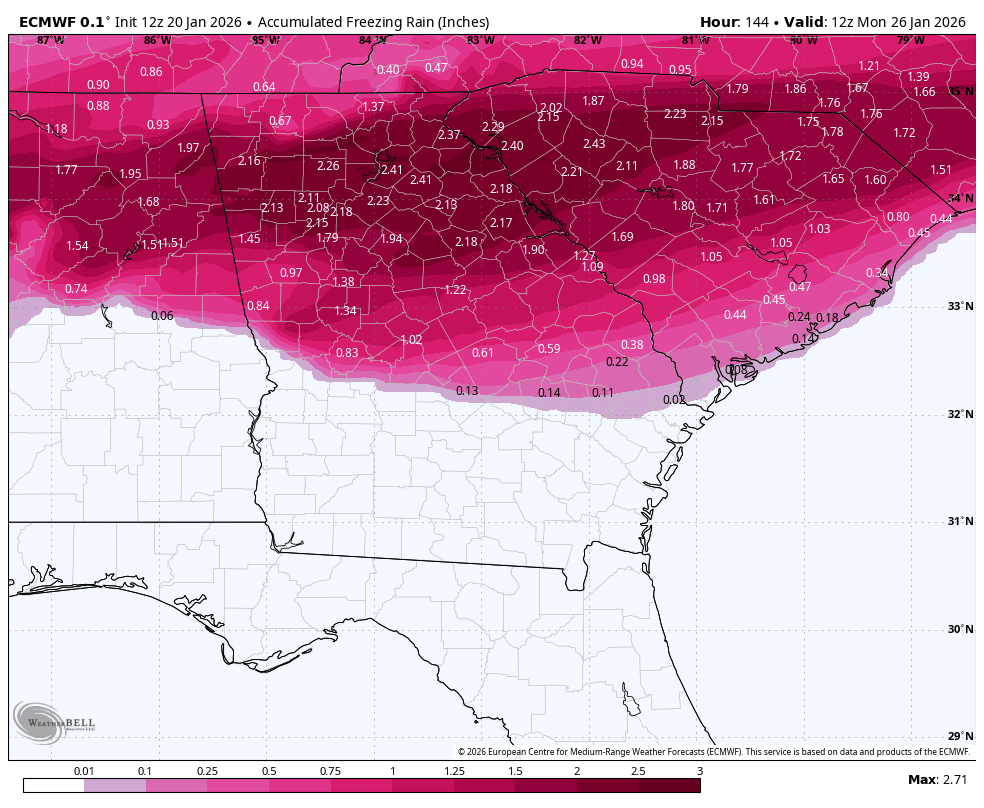
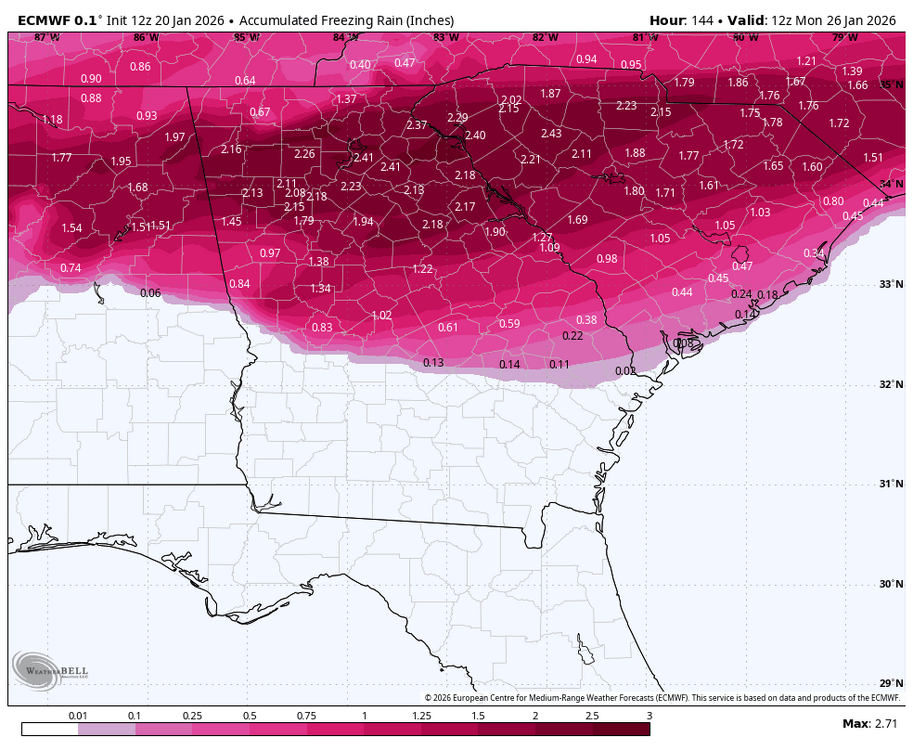
1” of ZR at ATL (or anywhere) would be bad enough. That hasn’t happened at ATL since 2/12/2014 and that much was only from Hartsfield S and mainly E. (That’s the one that killed the Eisenhower tree at Augusta National). Other than the terrible 1/1973 icestorm, which had temps only barely below 32, the last I could find giving ATL 2”+ was the devastating ~2” icestorm of 12/28-29/1935. Temps did drop into the 20s for part of that and probably as cold as mid 20s for the coldest, similar to the 12Z Euro. I read ATL news articles on this 30 years ago at the downtown library. It was horrible. So, essentially the 12Z Euro is calling for the worst combo of heaviest/very cold ZR at ATL in 90 years! Thus, of course it would be correct to bet on it not being as bad as modeled based on history. But unfortunately there’s a small chance it could actually happen like 90 years ago. Let’s hope not! Link to ATL day by day historical data: https://www.weather.gov/wrh/Climate?wfo=ffc @suzook@dsaur
-
Unfortunately for the ATL area, the atmosphere on the 12Z Euro has warmed notably vs the prior 2 runs, especially at/near 850 mb. Thus, the WxBell Euro’s ptype, which is clearly almost all ZR even without looking at soundings, isn’t debatable. The 12Z Euro has ~2.3” qpf of wintry precip, with the vast majority being ZR, falling over a 36 hour period from hour 99 (10 AM Sat 1/24) til hour 135 (10 PM Sun 1/25). The coldest is from Sat evening through the entire night with mid 20s. Fortunately it’s still out 4-5.5 days and obviously a lot can change. This as well as recent runs are in the ballpark of worst case scenarios for there, a colder version of Jan 1973 (which was only barely <32). So, keep hope alive as just about any change would be better than what this run shows. As ominous as this is, it still being out 4-5.5 days leaves notable opportunity for improvement from the worst case. @dsaur
-
Wow, that 12Z GFS Tue modeled historic snowstorm came out of nowhere! But of course that’s just great entertainment so far out.Well before that period and thus much more significantly as of now, KCHS has since yesterday afternoon been warning about a significant ZR threat for this weekend even way down into much of the just inland and even possibly coastal SE SC/upper GA that could linger til as late as Mon AM. As I posted last night, the last few GEFS runs of individual members have been strongly advertising a ZR threat in the KCHS forecast region:KEY MESSAGE 2: WIDESPREAD PRECIPITATION IS EXPECTED TO OCCUR THIS WEEKEND, BRINGING INCREASING POTENTIAL FOR A WINTER WEATHER EVENT TO IMPACT THE REGION. MODELS CONTINUE TO SUPPORT POTENTIAL FOR A WINTER WEATHER EVENT IMPACTING AT LEAST PORTIONS OF SOUTHEAST SOUTH CAROLINA AND SOUTHEAST GEORGIA THIS WEEKEND. THE SYNOPTIC PATTERN WILL FEATURE STRONG, COLD HIGH PRESSURE WEDGING DOWN THE EASTERN SEABOARD THROUGH THE WEEKEND, WITH AN AREA OF LOW PRESSURE FAVORED TO DEVELOP OFF THE SOUTHEAST COAST. BROAD MID LEVEL TROUGHING WILL LARGELY BE IN PLACE TO START, WITH A STRONGER WAVE DIVING INTO THE REGION LATER IN THE WEEKEND. FURTHER ALOFT, WE CAN FIND AN IMPRESSIVE UPPER LEVEL JET POSSIBLY ON THE ORDER OF 160+ KNOTS. THE CONDITIONS WILL CERTAINLY BE IN PLACE TO SUPPORT PRECIPITATION SPREADING ACROSS THE AREA, WITH INCREASING CONFIDENCE OF SOME OVERLAP WITH COLDER TEMPERATURES. ATTENTION THEN TURNS TO PRECIPITATION TYPE AS COLD AIR SETTLES INTO THE REGION. WHILE FORECAST DETAILS ON TIMING, AMOUNTS, AND P-TYPES WILL CONTINUE TO BE REFINED IN THE COMING DAYS, A PERUSAL OF MODEL SOUNDINGS INDICATE A NOTABLE WARM NOSE CENTERED AROUND 850 MB WITH SURFACE TEMPS DROPPING TO NEAR OR BELOW FREEZING SATURDAY NIGHT INTO SUNDAY MORNING. THIS WOULD SUGGEST FREEZING RAIN AS A PRIMARY THREAT, WHICH ALSO JIVES WITH THE LATEST NBM PRECIP PROBABILITIES. THE PROBABILISTIC WINTER STORM SEVERITY INDEX (WSSI-P) SHOWS CHANCES OF MINOR WINTER STORM IMPACTS ACROSS THE ENTIRE AREA, WITH EVEN A 20- 40% CHANCE OF MODERATE IMPACTS ESPECIALLY NORTH OF I-16.THE COLUMN BEGINS TO DRY OUT LATER SUNDAY INTO MONDAY, BUT IF PRECIPITATION LINGERS, THE THREAT FOR WINTER WEATHER COULD CONTINUE INTO EARLY MONDAY AS ENSEMBLE GUIDANCE SHOWS HIGH LIKELIHOOD FOR SUB-FREEZING TEMPERATURES AGAIN SUNDAY NIGHT. WE WILL ALSO NEED TO BE ON THE LOOKOUT FOR TEMPS/WIND CHILLS APPROACHING COLD WEATHER ADVISORY CRITERIA SUNDAY NIGHT AND BEYOND. @Awesomesauce81
-
Anthony’s not exaggerating. He’s absolutely right in terms of temperatures. Every week cooled in the latest run! It’s amazing how much the EW have cooled for Feb vs not too long ago looking mild every week! The chances of a mild Feb in the E US are now on life support after I earlier agreed with @snowman19thinking Feb was going to be mild per analogs.
-
But that wouldn’t be as strong as the biggest worry of all for many, a potential massive highly damaging and long lasting power outage causing icestorm. If the only alternative to nonwintry is a massive icestorm, who other than cray cray wx weenies would want that? Give them mainly 33F+ rain instead, please. Hope to the big guy for their sake that much of it would be sleet, my favorite wintry precip these days! I may consider a trip to ATL for this weekend IFF the odds of a massive icestorm are low and instead odds of a big sleetstorm with possibly a bonus of some snow along with only a fairly limited amount of ZR are high.
-
Great question. I haven’t investigated Euro AI ensemble precip/temp maps closely, but a “quick and dirty” check doesn’t reveal to me any obvious algo issues with those. So, my focus on these posts remains fully with the snow maps.
-
Hey Carvers and others, WxBell definitely didn’t fix the Euro AI ensemble snow maps algos. These two members (#10 and #22) with multiple inches of snow way out in the Gulf are from the hour 84 6Z Euro AIFS, when temps are near normal (70s):
-
Due to much colder 2 week forecasts vs how it looked on Friday, natural gas is now up an incredible 19%!! If anywhere near this rise were to hold til the close, this would likely be the largest % daily rise in years:
-
Forecasted indices for 1/24-6: 1. PNA rises from neutral to moderate + 2. AO strong - 3. NAO moderate - 4. EPO rises from a very strong - to moderate -; despite the moderation, the lagging from the prior very strong -EPO in combo with a rising PNA and with the help of a -AO/-NAO is why extreme cold will be dropping into the C/E US. 5. WPO pretty strong - 6. MJO: GEFS has 7 while EPS has mainly 8 So, overall the indices are just about as good as it gets for cold and thus storm potential. —— Edit: Due to the huge amount of blocking, this time there may not be the typical NW trend as we get closer. In other words, the models a few days out may already be closer to reality assuming there actually is a storm.
-
The #s are out. We just had the 3rd largest 2 day drop in winter of the EPO into negative territory on record back to 1948: 2026 01 14 88.01 2026 01 15 -92.49 2026 01 16 -254.34 So, it dropped 342 from 1/14 to 1/16. The only two larger 2 day winter drops are not much higher: the 367 of 2/9-11/1996 and the 364 of 1/16-18/1961. As I said, this isn’t a measure of the strongest EPO ridges. Rather, it is a measure of the speed in establishing a new strong EPO ridge.
-
I do need to emphasize that I’m only talking about the algos that produce the WxBell EPS AI snow maps having a major issue. Regarding the qpf and other maps, I have no evidence to suggest these are off. So, I’m saying that it’s possible that it’s only the snow maps that have a major problem with regard to EPS AI.
-
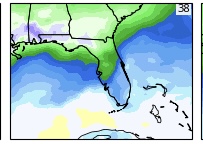
Carver and others, The WxBell Euro AIFS ens snow maps have a flaw so major that the 12Z run (just for one example) had one member (#38) 300 miles offshore in the Gulf getting a foot of snow within a 6 hour period while the temp was 65F+! You read that right, a 2”/hour snowstorm with temps in the 60s. These maps are so flawed than even Joe Bastardi, himself, noticed the same problem a few weeks ago! If even Joe noted this, well….use these at your own risk. The regular EPS snow maps are otoh legit:
-
If it is looks like it’s insane, quacks like it’s insane, it really is insane. That’s because the WxBell Euro AIFS ens snow maps have a flaw so major that the 12Z run (just for one example) had one member 300 miles offshore in the Gulf getting a foot of snow within a 6 hour period while the temp was 65F+! You read that right, a 2”/hour snowstorm with temps in the 60s. These maps are so flawed than even Joe Bastardi, himself, noticed the same problem a few weeks ago! If even Joe noted this, well….use these at your own risk. The regular EPS snow maps are otoh legit:
-
I’m not sure. But near the bottom was the regular Euro as it was last to trend NW with the track. It kept the snow centered near the coast for so long.
-
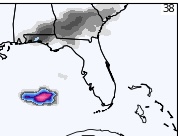
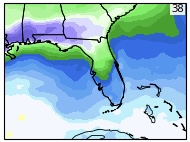
The WxBell Euro AI ensemble snow maps have to be using faulty algos. Here’s proof: From today’s 12Z Euro AI ens, this is member #38’s 6 hour snow map for hours 270-276 showing a blob of a foot of snow in the Gulf 300 miles from the N Gulf coast meaning an avg of 2”/hour over 6 hours lmao: That right there is proof enough that the snow algos are screwed up bigtime. But fwiw, I’ll also show the temp anomalies for hours 270 and 276 for that member: Member #38 temp 2m anom hour 270: Member #38 temp 2m anom hour 276: Those temp maps show that the coldest it is during hours 270-6 where it has that snow blob is only ~8 BN. The SST there now is ~77F. That means that the air temp during the supposed snow is likely no colder than ~65F. There’s no way it could snow a foot way out in the Gulf, much less while air temps are 65F+. Conclusion: There is a major algo issue with these Euro AI ensemble snow maps. Thus, I’d be very wary about using them. Even snow weenie Bastardi criticized them. EPS ens snow maps are fine, but not Euro AI ens snow maps. @donsutherland1
-
Yep, for the main snow not starting for 6-7 days out this may be the heaviest I’ve seen on an EPS mean in NC even after taking ~1” off in some areas for today; also there’s quite the falloff S of NC as ZR seems to take over
-
Swainsboro switched from rain to snow at the 11AM hourly:SWAINSBORO LGT SNOW 34 34 100 W5
-
1-1.25” Marianna, FL, just SW of GA/FL/AL corner!1042 AM SNOW MARIANNA 30.78N 85.24W 01/18/2026 M1.3 INCH JACKSON FL PUBLIC ABOUT 1 TO 1.25 INCHES OF SNOW MEASURED AS A FINAL ACCUMULATION.
-
Has a lot of it melted away already? I read someone else said the Macon camera showed it “gone”, but I didn’t know exactly what he meant. That seemed awfully fast if it did.
-
At Smithville, GA, 10 miles S of Americus, 2-3” reported by EM:1002 AM SNOW SMITHVILLE 31.90N 84.26W 01/18/2026 E3.0 INCH LEE GA EMERGENCY MNGR 2 TO 3 INCHES OF SNOW REPORTED IN SMITHVILLE BY LEE COUNTY EM. SOME ACCUMULATION ON DIRT ROADS WITH ICY PATCHES ON SPOTS IN PAVED ROADS.
-
Biggest I’ve seen so far: 2.5” Cuthbert, WNW of Albany, GA!0932 AM SNOW CUTHBERT 31.77N 84.79W 01/18/2026 M2.5 INCH RANDOLPH GA BROADCAST MEDIA AVERAGE OF SNOWFALL FROM SEVERAL MEASUREMENTS.
-
I read that it just changed to all snow at Dublin, GA. The radar looks good, too, regarding what’s falling/coming there. I just read 2” was measured 20 miles ESE of Macon at Jeffersonville near I-16!
-
Radar is quite impressive in a band in GA centered from Albany/Tifton to Dublin to Augusta.
-
Biggest winner so far: 3” at Monticello, GA!0908 AM SNOW MONTICELLO 33.30N 83.68W 01/18/2026 M3.0 INCH JASPER GA BROADCAST MEDIA REPORT FROM MEDIA OF 3 INCHES OF SNOW IN MONTICELLO. *Edit: later corrected down by NWS to 2” from 3”.
-
It appears per radar that Augusta might be about to get hit hard with something! Meanwhile: 2” reported at Byron, GA! (Just WNW of Warner Robbins)0830 AM SNOW 2 N POWERVILLE 32.63N 83.79W 01/18/2026 E2.0 INCH PEACH GA PUBLIC AN ESTIMATED 2 INCHES OF SNOW FELL AT HAYES CT IN BYRON. ————— *Edit: Wow, what a correction downward at Byron, GA, from 2” to 0.5”:1013 AM SNOW 2 N POWERVILLE 32.63N 83.79W 01/18/2026 E0.5 INCH PEACH GA PUBLIC CORRECTS PREVIOUS SNOW REPORT FROM 2 N POWERVILLE. AN ESTIMATED 0.5 INCH OF SNOW FELL AT HAYES CT IN BYRON.